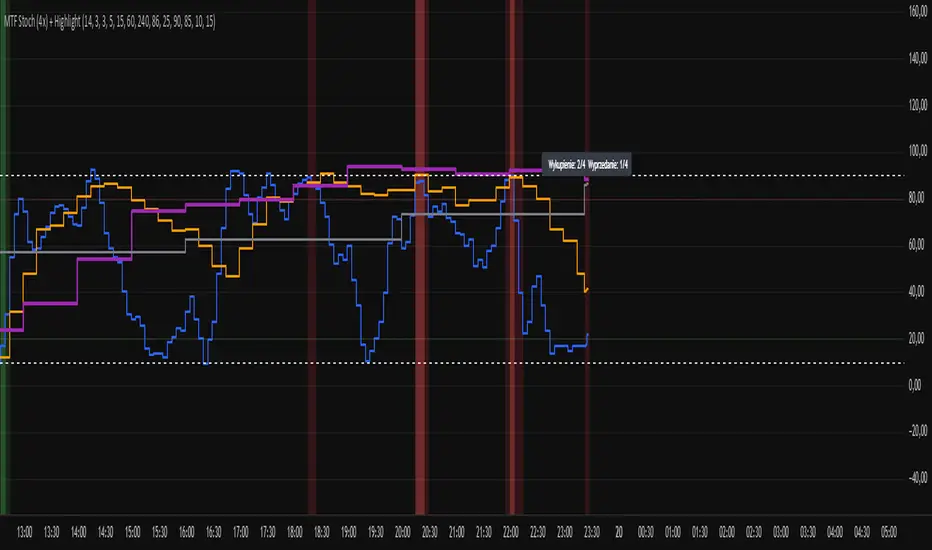
Multi-Timeframe Stochastic (4x) z PodświetlaniemStochastic z możliwością paru tfów gdzie jak są w danej strefie to podświetla
頻帶和通道
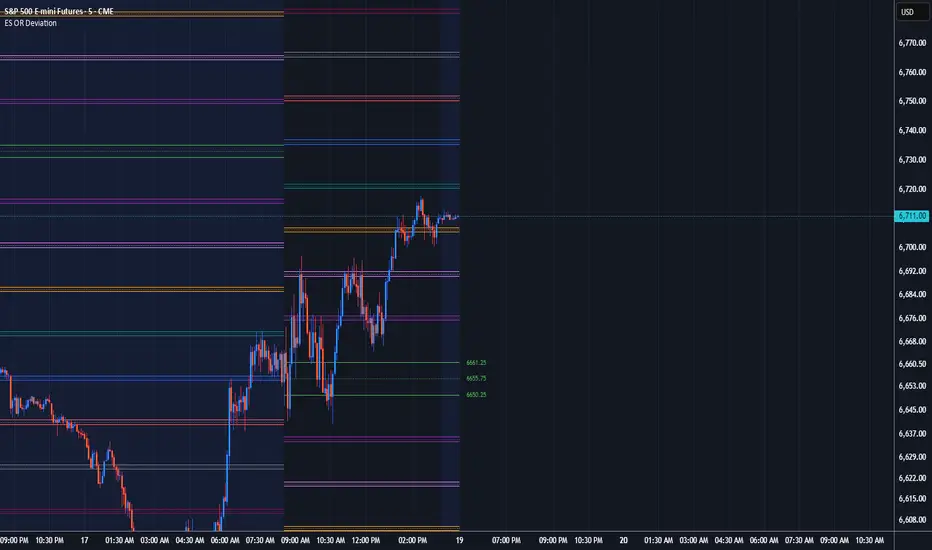
ES OR DeviationES Opening Range Deviation target points. Used to find possible support or resistance.
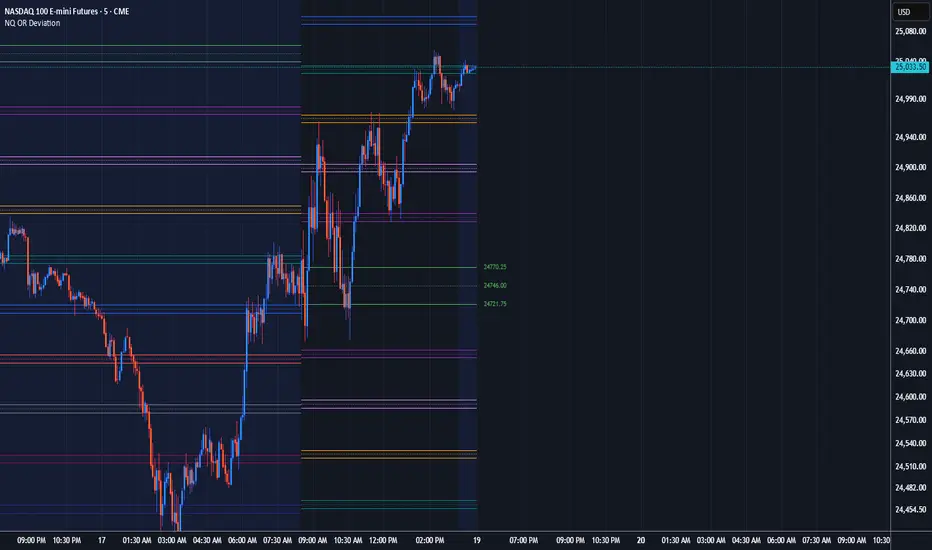
NQ OR DeviationNQ Opening Range Deviation target points. Used to find possible support or resistance.
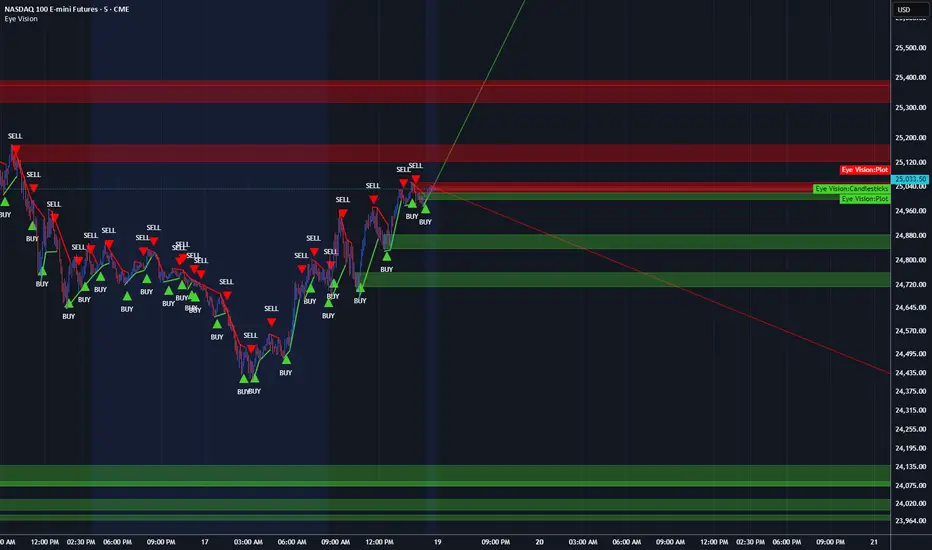
Eye VisionSee the setup. Execute with confidence.
EYE Vision Algo translates market structure into clear, actionable trade plans so you can stop second-guessing and start executing.
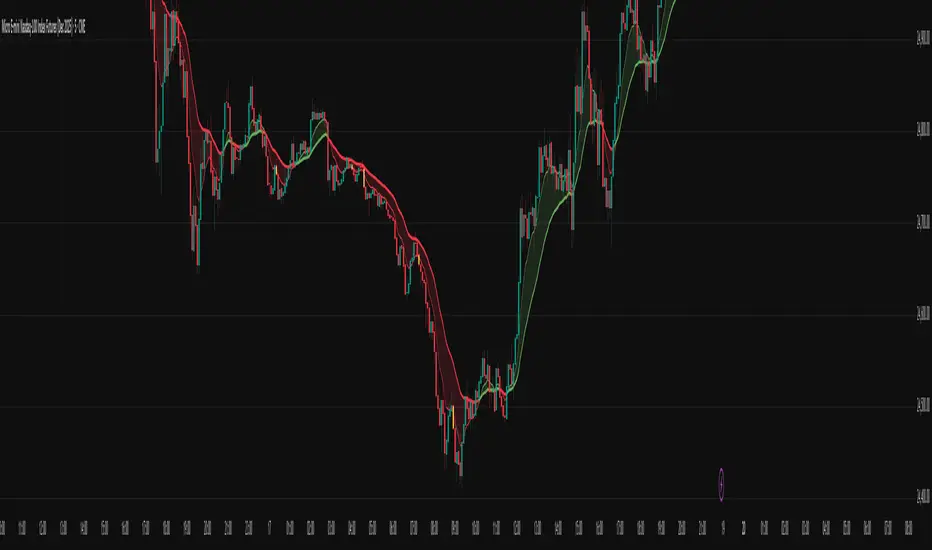
Momentum ContinuationMomentum Continuation - By racy_1
The Momentum Continuation indicator helps traders identify high-probability continuation points in established trends — where momentum is likely to resume after a controlled pullback or brief pause.
Concept
At its core, the indicator tracks the relationship between two EMAs (fast and slow) to define the local trend direction, then checks whether multiple higher-timeframe trends support that trend.
When alignment occurs across all selected timeframes, and price confirms a continuation move, the script highlights the corresponding bar — signalling potential momentum re-entry opportunities.
Key Features
Dual EMA Band: Visual representation of short- and medium-term trend structure, with optional shading for clarity.
Multi-Timeframe Alignment: Up to 3 configurable higher timeframes ensure trend agreement before signalling continuation.
Continuation Triggers: Highlights candles where momentum resumes after a pullback or reclaim, confirming that trend structure remains intact.
Optional Distance Filter: Adds a configurable minimum distance (by % or ATR multiples) from the fast EMA to improve signal quality.
Pierce-and-Reclaim Logic: Optionally allows signals where price briefly violated the EMA band but reclaimed direction without breaking alignment.
No-Repaint Option: Choose between *Closed-Bar HTF Mode* (safer, slightly delayed) and *Live HTF Mode* (faster, may flicker).
Built-in Alerts: Receive notifications for both continuation triggers and trend-state changes (e.g., Trending Up / Trending Down).
How to Use
Select your fast and slow EMA lengths (default 8 / 24).
Configure HTF1–3 to define which higher timeframes must align (or leave any blank to ignore).
Enable “Continuation Logic” to activate triggers, bar highlights, and alerts.
Optionally enable Pierce-and-Reclaim or apply a distance filter for stricter setups.
Look for highlighted bars (and alerts) confirming momentum continuation in the prevailing trend direction.
Tips
Works on any asset and timeframe, but performs best on clean, trending instruments.
Combine with market structure or liquidity analysis to time entries more precisely.
The HTF Closed-Bar option is recommended for backtesting and signal reliability.
Disclaimer
This script is for educational and informational purposes only.
It does not constitute financial advice. Always manage risk appropriately before making any trading decision.
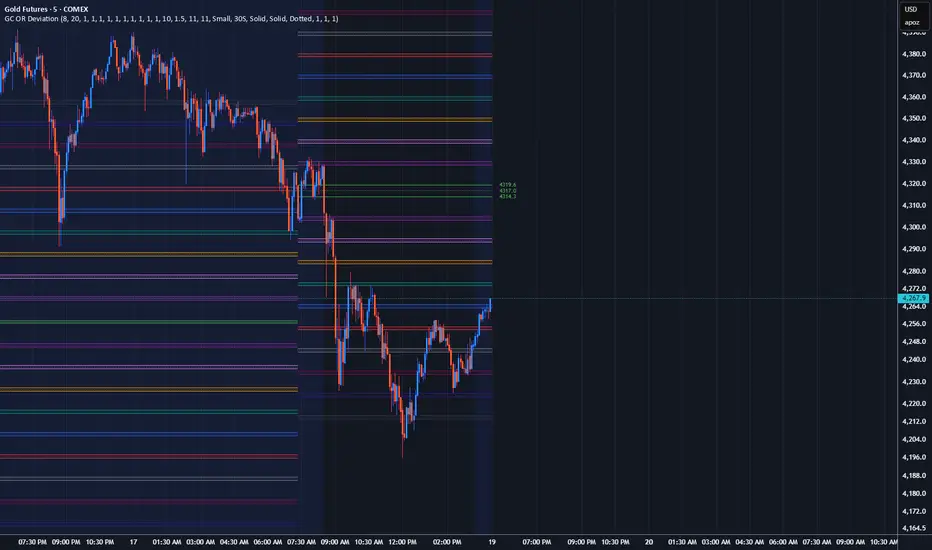
007 GC"Golden EYE" 007 GC is used to quickly identify reversals on GC/MGC with clear entries and exits.

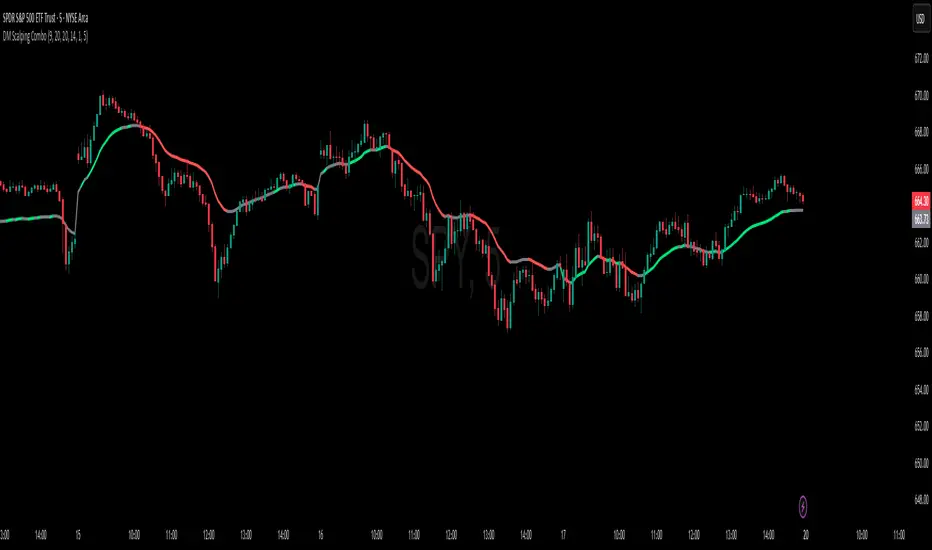
DM Scalping Combo (Price vs EMA9 • EMA20 • VWAP)Here’s a simple, tradeable way to use your indicator. I’ll give you two core “enter” playbooks (one momentum, one pullback), with exact triggers, invalidation, and targets. You can use either or both.
1) Momentum after consolidation (my top pick)
Idea: wait for a tight consolidation, then take the first aligned break when price is above/below the ema combo line. for bull enter green after consolidation break.
For bear enter red after consolidation break
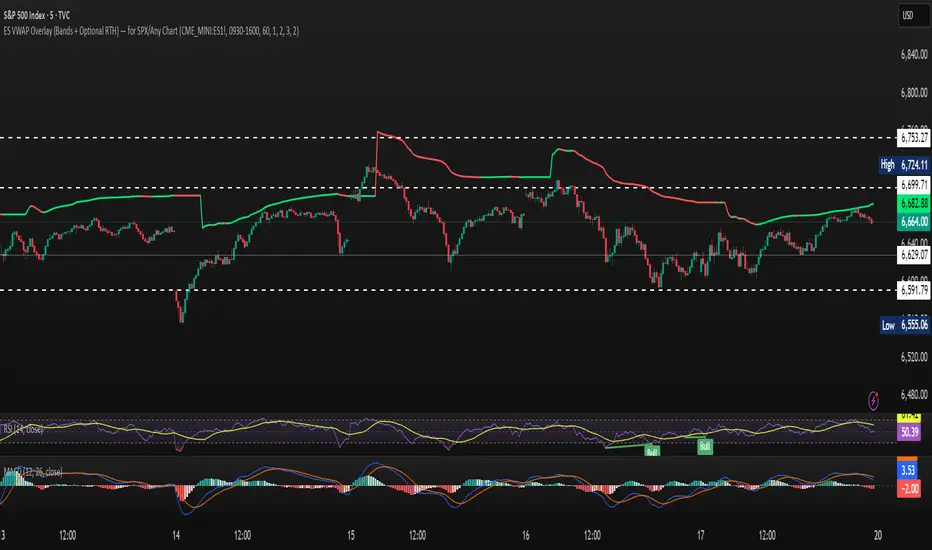
ES VWAP Overlay for SPX VWAP indicator for SPX. Since SPX does not have volume (index) it's using /es to mimic SPX volume. I find it good for day trading
Buy The F*cking Dip [DotGain]How to Interpret the "Buy The F*cking Dip" (BTFD) Indicator
Main Purpose and Timeframe
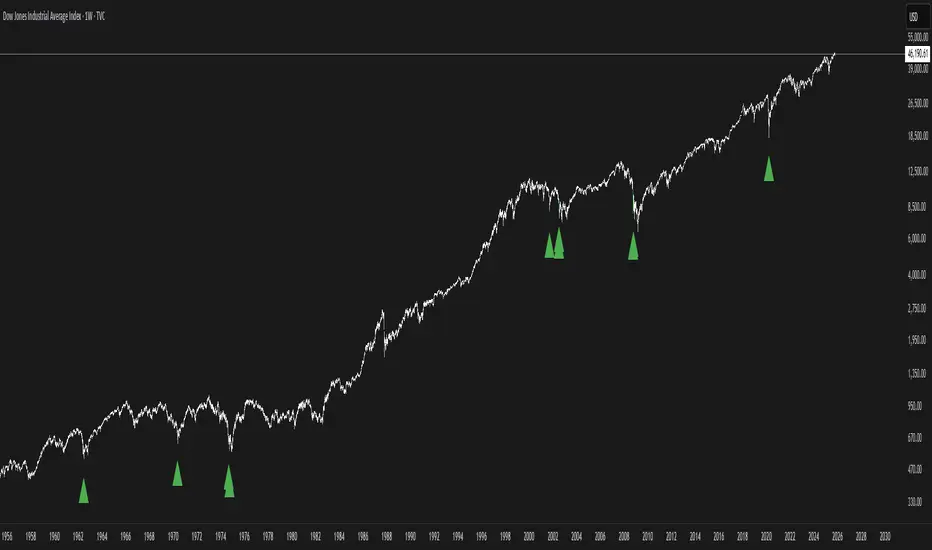
The BTFD indicator is a confluence indicator designed to identify rare moments of extreme capitulation and panic in the market. As the name suggests, its primary focus is identifying significant buying opportunities ("Dips") on high timeframes.
Recommended Timeframes: Minimum Daily chart, ideally Weekly chart.
Primary Signal: The green "Buy" triangle is the default signal to watch for.
The Buy Signal (Green Triangle)
A green "Buy" triangle appears only when all three of the following conditions are met simultaneously. It signals not just a minor pullback, but a potentially macro-level oversold condition.
High Panic (CM Williams Vix Fix): The market is in a state of heightened volatility or "fear." This indicates that sellers are acting out of panic.
Structurally Oversold (Deviation from MA): The price has deviated extremely far (default: >10%) below its long-term moving average (default: 200-period EMA). This signals that the price is "cheap" in the big picture.
Short-Term Overextended (TRMAD): The price has fallen extremely hard and fast relative to its recent volatility (ATR) (default: < -3.0). This signals "maximum pain" on a short-term level.
In summary, a green triangle means: The market is panicky, structurally undervalued, and extremely oversold short-term. These are often the moments when long-term bottoms are formed.
The Sell Signal (Red Triangle)
The indicator can also identify the exact opposite: moments of extreme euphoria or "blow-off tops."
Disabled by Default: The red "Sell" triangle is disabled by default in the settings (display=display.none), as the indicator's focus is on buying.
Meaning (if enabled): It signals that the market (1) has high volatility, (2) is structurally overbought (far above its 200 MA), and (3) is extremely overextended (euphoric) on a short-term basis.
Visual Adjustments (In the "Style" Tab)
By default, only the green "Buy" triangle is active. You can, however, enable other visuals in the indicator's "Style" settings tab:
Buy (Green Triangle): On by default.
Sell (Red Triangle): Off by default.
Signal Bar Color: Colors the candle green/red. Off by default.
Signal Background: Shows a transparent green/red background. Off by default.
Have fun :)
Disclaimer
This "Buy The F*cking Dip" (BTFD) indicator is provided for informational and educational purposes only. It does not, and should not be construed as, financial, investment, or trading advice.
The signals generated by this tool (both "Buy" and "Sell") are the result of a specific set of algorithmic conditions. They are not a direct recommendation to buy or sell any asset. All trading and investing in financial markets involves substantial risk of loss. You can lose all of your invested capital.
Past performance is not indicative of future results. The signals generated may produce false or losing trades. The creator (© DotGain) assumes no liability for any financial losses or damages you may incur as a result of using this indicator.
You are solely responsible for your own trading and investment decisions. Always conduct your own research (DYOR) and consider your personal risk tolerance before making any trades.
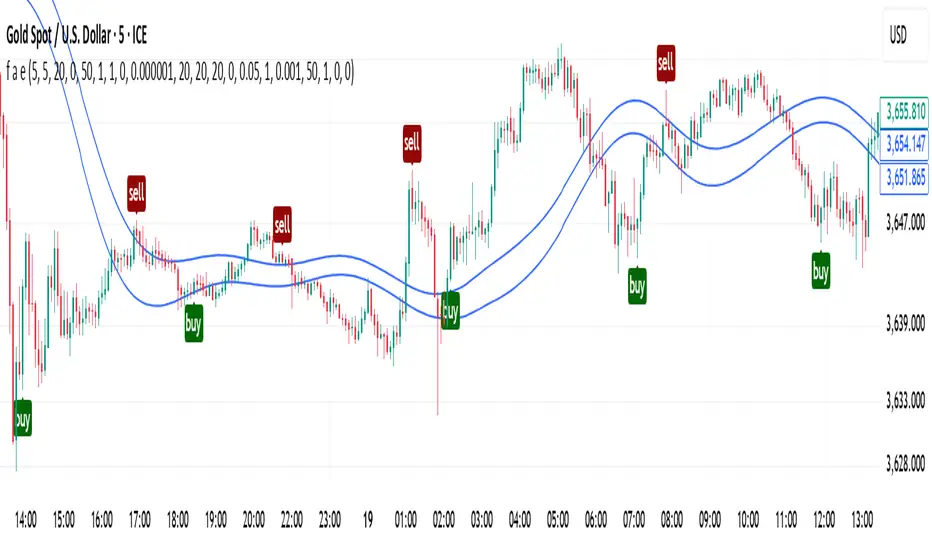
buy and sell signal f a e abarmoamelegar🔒 f a e — Trend-Sensitive Signal System
This invite-only indicator combines multiple layers of market analysis to help traders identify potential buy and sell zones with dynamic visual feedback. While the core logic remains proprietary, here’s what users can expect:
📈 Structure Recognition
The script detects recent swing highs and lows using configurable pivot logic. It then connects these points with color-coded lines that reflect the current market regime — bullish, bearish, or neutral — based on slope analysis.
🧠 Multi-Factor Confirmation
Signals are generated only when multiple conditions align. These include:
- Price interaction with adaptive volatility bands
- Trend direction inferred from recent structural shifts
- Optional filters based on candle behavior, momentum, and timing
- Risk-to-reward logic for dynamic stop-loss and take-profit levels
🎯 Signal Management
Each signal is tracked internally to evaluate its outcome. The system calculates hit rate, net performance, and trade count — helping users assess historical behavior without repainting.
⚙️ Customization
Users can fine-tune sensitivity, confirmation layers, and risk parameters to match their trading style. The system adapts to both trending and ranging environments.
This tool is designed to assist with market analysis and does not guarantee future performance. All signals are for informational purposes only and should be used alongside sound risk management.
ProbRSI Adaptive SPY and QQQ Swing One Hour Strategy Summary in one paragraph
A probabilistic RSI engine for large cap ETFs and index names on intraday and swing timeframes. It converts ATR scaled returns into a 0 to 100 probability line, adapts its smoothing from path efficiency, and gates flips with simple percent levels. It is original because it fuses three pieces that traders rarely combine in one signal line: ATR normalized return probability, curvature compression, and per bar adaptive EMA. Add it to a clean chart, keep the default one hour signal on QQQ, and read the entry and exit markers generated by the strategy. For conservative alerts select on bar close.
Scope and intent
• Markets. Major ETFs and large cap equities. Index futures. Liquid crypto. Major FX pairs
• Timeframes. One minute to daily. Defaults to one hour for swing pace
• Default demo used in this publication. SPY/QQQ on one hour
• Purpose. Reduce false flips by adapting to path efficiency and by gating long and short separately
• Limits. This is a strategy. Orders are simulated on standard candles only
Originality and usefulness
• Unique fusion. Logistic probability of ATR scaled returns with arcsine pre transform, optional curvature compression, and per bar adaptive EMA steered by an efficiency ratio
• Failure mode addressed. Fast whips in congestion and late entries after spikes
• Testability. Each component has a named input and can be tuned directly. Entry names Long and Short are visible in the list of trades
• Portable yardstick. ATR scaled return is a common unit across symbols and venues
• Protected rationale. The code stays protected to preserve implementation details of the adaptive engine and curvature assist while the method and usage are fully explained here for community review
Method overview in plain language
You convert raw returns into a probability scale, adapt the smoothing to the straightness of the path, and only allow flips when a simple gate is satisfied. The probability line crosses its own EMA to generate signals. When the cross happens below a short gate or above a long gate, the flip is allowed. Otherwise it is ignored.
Base measures
• Return basis. Close minus prior close normalized by ATR, then arcsine to damp large steps. ATR window is set by ATR length. Sensitivity is adjusted by an ATR scale input
• Probability map. A logistic function maps the normalized return to 0 to 1 which becomes 0 to 100 after scaling
Components
• Probability core. Logistic probability of ATR scaled returns. Higher values imply upside pressure. Smoothed by an adaptive EMA
• Curvature assist optional. A curvature proxy compresses extreme spikes toward neutral. Useful after news bars. Weight controls strength
• Efficiency ratio. A path efficiency score from 0 to 1 extends the smoothing length during noisy paths and shortens it during directional paths
• Signal line. An EMA of the probability line creates the reference for cross up and cross down
• Gates. Two simple percent levels define when long and short flips are allowed
Fusion rule
• The adaptive EMA length is computed as a linear map between a minimum and a maximum bound based on one minus efficiency
• If curvature assist is enabled the probability is adjusted by a small counter spike term
• Final probability is compared to its EMA
Signal rule
• Long. A long entry is suggested when probability crosses above the signal line and the current probability is above the Long gate level
• Short. A short entry is suggested when probability crosses below the signal line and the current probability is below the Short gate level
• Exit and flip. When an opposite entry condition appears the current position is closed and a new position opens in the opposite direction
What you will see on the chart
• Strategy markers on suggestion bars. Orders named Long and Short
• Exit marker when the opposite signal closes the open side
• No table by design. All tuning lives in Inputs for a clean chart
Inputs with guidance
Market TF
• Symbol. Series used for oscillator computation. Use the instrument you trade or a close proxy
• Signal timeframe. Timeframe where the oscillator is evaluated. Leave blank to follow the chart
Core
• Price source. Series used for returns. Typical choice close
• Base length. Fallback EMA length used when adaptation is off. Typical range 20 to 200. Larger smooths more
• ATR length. Window for ATR that scales returns. Typical range 10 to 30. Larger normalizes more and lowers sensitivity
• Logit sharpness. Steepness of the logistic link. Typical range 1 to 8. Raising it reacts more to the same input
• ATR scale. Extra divisor on ATR. Typical range 0.5 to 2. Smaller is more sensitive
• Signal length. EMA of the probability line. Typical range 5 to 20. Larger gives fewer flips
• Long gate. Allow long flips only above this level. Typical range 20 to 40
• Short gate. Allow short flips only below this level. Typical range 20 to 40
Adaptive
• Adaptive smoothing. If on, the efficiency ratio controls the per bar EMA length
• Min effective length. Lower bound of adaptive EMA. Typical range 5 to 50
• Max effective length. Upper bound of adaptive EMA. Typical range 50 to 300
• Efficiency window. Window for efficiency ratio. Typical range 30 to 100
Shape Assist
• Curvature influence. If on, extreme spikes are nudged toward neutral
• Curvature weight. Strength of compression. Typical range 0.1 to 0.3
Properties visible in this publication
• Initial capital. 25000
• Base currency. USD
• request.security lookahead off everywhere
• Commission. 0.03 percent
• Slippage. 5 ticks
• Default order size method percent of equity with value 3 for realistic testing
• Pyramiding 0
• Process orders on close ON
• Bar magnifier OFF
• Recalculate after order is filled OFF
• Calc on every tick OFF
Realism and responsible publication
• No performance claims. Past results never guarantee future outcomes
• Shapes can move while a bar forms and settle on close
• Strategies use standard candles for signals and orders only
Honest limitations and failure modes
• Economic releases and thin liquidity can break assumptions behind the curvature assist
• Gap heavy symbols may prefer a longer ATR window
• Very quiet regimes can reduce signal contrast. Consider higher gates or longer signal length
• Session time follows the exchange of the chart and can change symbol to symbol
• Symbol sensitivity is expected. Use the gates and length inputs to find stable settings
• Past results never guarantee future outcomes
Open source reuse and credits
• None
Mode
Public protected. Source is hidden while access is free. Implementation detail remains private. Method and use are fully disclosed here
Legal
Education and research only. Not investment advice. You are responsible for your decisions. Test on historical data and in simulation before any live use. Use realistic costs.

EMA 9 + VWAP Lower Band Buy SignalEMA 9 + VWAP Lower Band Buy Signal. It uses Ema 9 and VWAP lower band. Has buy alerts

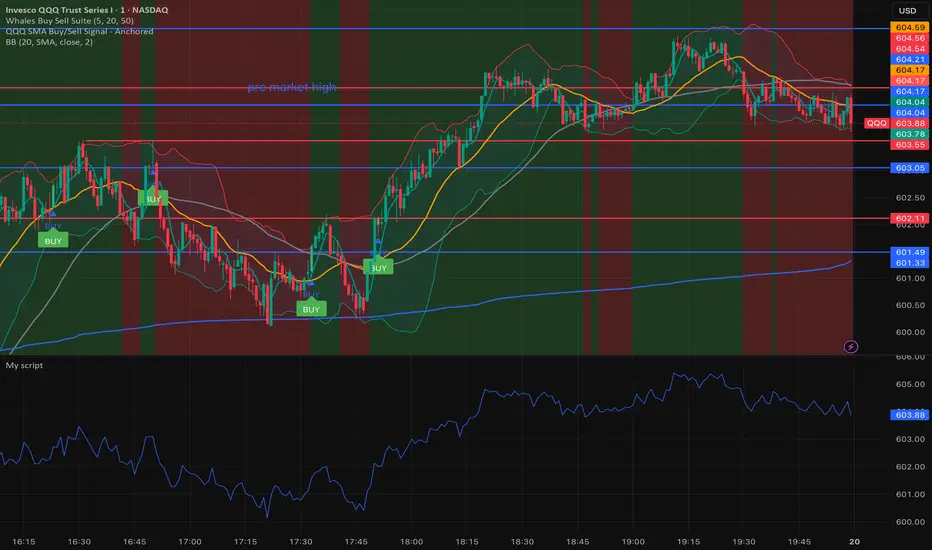
Whales buy & sell🐋 Whales on Wall Street — Buy & Sell Signal Indicator
The Whales on Wall Street Signal Indicator is a precision-built trading tool designed to simplify your decision-making and give you real-time clarity in the market.
It automatically identifies high-probability reversal zones, momentum shifts, and trend confirmations — marking exact Buy (green) and Sell (red) signals based on price action, volume confirmation, and momentum strength.
Built for day traders and scalpers, this indicator eliminates the guesswork by combining multiple technical confluences such as:
EMA & RSI alignment for trend direction
Smart volume spikes for institutional activity
Volatility filters to reduce false signals
Dynamic alerts for entries and exits in real time
Whether you’re trading SPY, QQQ, NVDA, or Tesla, this indicator adapts to any ticker and timeframe — giving you crystal-clear entries, cleaner exits, and the confidence to trade like a whale.
Super Test Indicator – Automated TP/SL SignalsThe Super Test indicator is designed to help traders automatically detect potential entry and exit points using a combination of technical logic and trend tracking. While it’s optimized for XAU/USD (Gold) on the 15-minute timeframe, it can be adapted to work with other symbols and timeframes.
🛠️ Key Features:
Automated Buy/Sell Signals
Take Profit (TP) and Stop Loss (SL) zones shown as green/red boxes
Trend Confirmation via two dynamic lines (orange and blue)
Green Triangle Markers for additional entry confirmation
Clean and professional chart visuals for easier analysis
Optimized for 15-minute timeframe, but versatile across others
🔍 How to Use:
Watch for Buy or Sell labels on the chart.
Green and red boxes show TP/SL zones for each trade.
Use the blue and orange lines to confirm overall trend direction.
Green triangle markers can help confirm stronger entries.
⚙️ Best For:
Scalpers and intraday traders
Beginners looking for guided visual signals
Traders testing semi-automated strategies

2 Bandas de Bollinguer (10-20) + 4 EMA + 2 SMA 2 BB (10-20) + 4 EMA (35-50-100-200) + 2 SMA (75-100) configurable

Pro Scalper - Kalman Supertrend with Dynamic OB/OS Zones═══════════════════════════════════════════════════════════════════
PRO SCALPER - KALMAN SUPERTREND WITH DYNAMIC OB/OS ZONES
Developed by Zakaria Safri
═══════════════════════════════════════════════════════════════════
A powerful day trading and scalping indicator designed for the 30-minute
timeframe, combining advanced Kalman filtering with Supertrend analysis
and VWMA-based overbought/oversold detection for stocks and cryptocurrencies.
🎯 KEY FEATURES
═══════════════════════════════════════════════════════════════════
✅ Kalman-Filtered Supertrend
• Advanced noise reduction using Kalman Filter mathematics
• Reduces false signals by filtering market noise
• Adaptive trend-following with dynamic support/resistance
✅ Clear Buy/Sell Signals
• Green "BUY" labels for long entries
• Red "SELL" labels for short entries
• Signals trigger on confirmed trend reversals
• Matrix-style candle coloring (Green=Bull, Red=Bear)
✅ Dynamic Overbought/Oversold Zones
• VWMA-based adaptive zones
• Automatically adjusts to market volatility
• Visual zone highlighting with fills
✅ Reversal Signal Detection
• "R" markers identify potential reversals
• Vertical lines highlight reversal bars
• Based on price rejection from OB/OS zones
✅ Smart Take Profit System
• Automatic TP levels at OB/OS zones
• "X" markers when targets are hit
• Based on higher-high/lower-low logic
✅ Live Entry Price Table
• Shows current trend direction
• Displays last signal type (BUY/SELL)
• Real-time entry price tracking
✅ Comprehensive Alert System
• Buy/Sell signal alerts
• Reversal detection alerts
• Take profit hit notifications
• All alerts are non-repainting
📊 HOW IT WORKS
═══════════════════════════════════════════════════════════════════
1. KALMAN FILTER
The indicator applies Kalman filtering to price and ATR data, using
mathematical equations derived from Rudolf E. Kalman's work. This
advanced filtering technique:
• Smooths price data while maintaining responsiveness
• Removes outliers and reduces market noise
• Adapts to changing market conditions
• Improves signal accuracy and reliability
2. MODIFIED SUPERTREND
A customized Supertrend calculation that uses:
• Kalman-filtered HL2 price instead of raw prices
• Filtered ATR for volatility measurement
• Adaptive trailing bands that follow price
• Trend detection with minimal lag
3. VWMA DYNAMIC ZONES
Volume-Weighted Moving Average bands that:
• Calculate from highest/lowest prices over lookback period
• Adapt to current volatility and price range
• Identify true overbought/oversold conditions
• Provide logical take-profit targets
4. SIGNAL GENERATION
• BUY: When price breaks above Supertrend (trend flips bullish)
• SELL: When price breaks below Supertrend (trend flips bearish)
• REVERSAL: When price rejects from OB/OS zones
• TAKE PROFIT: When price reaches target zones or forms HH/LL
⚙️ SETTINGS GUIDE
═══════════════════════════════════════════════════════════════════
🔧 KALMAN FILTER SETTINGS
┌─────────────────────────────────────────────────────────────┐
│ Gain (0.7) → Higher = More responsive, Less smooth │
│ Momentum (0.3) → Higher = More momentum, Less filtering │
└─────────────────────────────────────────────────────────────┘
📈 SUPERTREND SETTINGS
┌─────────────────────────────────────────────────────────────┐
│ ATR Period (10) → Lookback for volatility calculation │
│ ATR Multiplier (3.0) → Distance of bands (lower = more sigs)│
└─────────────────────────────────────────────────────────────┘
📊 VWMA BANDS (OB/OS ZONES)
┌─────────────────────────────────────────────────────────────┐
│ VWMA Length (20) → Smoothing period │
│ Overbought Multiplier (1.5) → OB zone distance │
│ Oversold Multiplier (1.5) → OS zone distance │
│ Band Lookback (20) → Range calculation period │
└─────────────────────────────────────────────────────────────┘
💡 USAGE INSTRUCTIONS
═══════════════════════════════════════════════════════════════════
RECOMMENDED SETUP:
• Timeframe: 30 minutes (optimized for intraday trading)
• Markets: Stocks, Cryptocurrencies, Forex
• Risk Management: Always use stop losses
• Confirmation: Combine with volume and support/resistance
ENTRY SIGNALS:
1. Wait for BUY/SELL label to appear
2. Check trend direction (candle color)
3. Confirm entry on next candle open
4. Set stop loss below/above Supertrend line
EXIT SIGNALS:
1. Take profit at "X" markers
2. Exit on opposite signal
3. Exit on reversal "R" if against your position
4. Manual exit at predetermined R:R ratio
REVERSAL TRADING:
1. Wait for "R" marker in OB/OS zone
2. Confirm with candlestick pattern
3. Enter counter-trend trade
4. Target middle VWMA or opposite zone
🎨 VISUAL ELEMENTS
═══════════════════════════════════════════════════════════════════
• GREEN LINE → Bullish Supertrend (support)
• RED LINE → Bearish Supertrend (resistance)
• CYAN LINE → VWMA baseline
• RED ZONE → Overbought area
• GREEN ZONE → Oversold area
• GREEN CANDLES → Bullish trend active
• RED CANDLES → Bearish trend active
• BUY LABEL → Long entry signal
• SELL LABEL → Short entry signal
• R MARKER → Reversal signal
• X MARKER → Take profit hit
⚠️ IMPORTANT NOTES
═══════════════════════════════════════════════════════════════════
✓ NON-REPAINTING: All signals are confirmed on candle close
✓ BACKTESTING: Test on your specific market before live trading
✓ RISK MANAGEMENT: Use proper position sizing and stop losses
✓ MARKET CONDITIONS: Works best in trending and range-bound markets
✓ CONFLUENCE: Combine with other analysis for best results
⚡ Best Performance:
• Trending markets with clear momentum
• Moderate to high volatility environments
• 30-minute to 1-hour timeframes
• Liquid markets with tight spreads
⚠️ Avoid Using:
• During major news events (high slippage)
• In extremely choppy/sideways markets
• On illiquid assets with wide spreads
• Without proper risk management
📚 METHODOLOGY
═══════════════════════════════════════════════════════════════════
This indicator combines three proven technical analysis methods:
1. TREND FOLLOWING (Supertrend)
Captures major price movements and momentum
2. MEAN REVERSION (VWMA Zones)
Identifies extremes and potential reversals
3. NOISE FILTERING (Kalman)
Reduces false signals and improves accuracy
By integrating these approaches with volume weighting and adaptive
calculations, the Pro Scalper provides a comprehensive trading system
suitable for active traders and scalpers.
⚖️ DISCLAIMER
═══════════════════════════════════════════════════════════════════
This indicator is provided for educational and informational purposes
only. It does not constitute financial advice, and past performance
does not guarantee future results.
Trading carries substantial risk of loss and is not suitable for all
investors. Always:
• Do your own research and analysis
• Use proper risk management
• Never risk more than you can afford to lose
• Test thoroughly before live trading
• Consult a financial advisor if needed
The creator (Zakaria Safri) assumes no liability for trading losses
incurred using this indicator.
📞 ABOUT THE DEVELOPER
═══════════════════════════════════════════════════════════════════
Developer: Zakaria Safri
Specialization: Advanced algorithmic trading indicators
Focus: Noise reduction, signal filtering, and trend analysis
• Regular updates and improvements
• Community feedback integration
• Bug fixes and optimization
• Feature requests welcome
📋 VERSION INFO
═══════════════════════════════════════════════════════════════════
Version: 1.0
Created: 2024
License: Mozilla Public License 2.0
Author: Zakaria Safri
═══════════════════════════════════════════════════════════════════
Happy Trading! 📈
Developed with precision by Zakaria Safri
═══════════════════════════════════════════════════════════════════

多周期趋势动量面板(Multi-Timeframe Trend Momentum Panel - User Guide)多周期趋势动量面板(Multi-Timeframe Trend Momentum Panel - User Guide)(english explanation follows.)
📖 指标功能详解 (精简版):
🎯 核心功能:
1. 多周期趋势分析 同时监控8个时间周期(1m/5m/15m/1H/4H/D/W/M)
2. 4维度投票系统 MA趋势+RSI动量+MACD+布林带综合判断
3. 全球交易时段 可视化亚洲/伦敦/纽约交易时间
4. 趋势强度评分 0100%量化市场力量
5. 智能警报 强势多空信号自动推送
________________________________________
📚 重要名词解释:
🔵 趋势状态 (MA均线分析):
名词 含义 信号强度
强势多头 快MA远高于慢MA(差值≥0.35%) ⭐⭐⭐⭐⭐ 做多
多头倾向 快MA略高于慢MA(差值<0.35%) ⭐⭐⭐ 谨慎做多
震荡 快慢MA缠绕,无明确方向 ⚠️ 观望
空头倾向 快MA略低于慢MA ⭐⭐⭐ 谨慎做空
强势空头 快MA远低于慢MA ⭐⭐⭐⭐⭐ 做空
简单理解: 快MA就像短跑运动员(反应快),慢MA是长跑运动员(稳定)。短跑远超长跑=强势多头,反之=强势空头。
________________________________________
🟠 动量状态 (RSI力度分析):
名词 含义 操作建议
动量上攻↗ RSI>60且快速上升 强烈买入信号
动量高位 RSI>60但上升变慢 警惕回调,可减仓
动量中性 RSI在4060之间,平稳 等待方向明确
动量低位 RSI<40但下跌变慢 警惕反弹,可止盈
动量下压↘ RSI<40且快速下降 强烈卖出信号
简单理解: RSI就像汽车速度表。"动量上攻"=油门踩到底加速,"动量高位"=已经很快但不再加速了。
________________________________________
🟣 辅助信号:
MACD:
• MACD多头 = 柱状图>0 = 买方力量强
• MACD空头 = 柱状图<0 = 卖方力量强
布林带(BB):
• BB超买 = 价格在布林带上轨附近 = 可能回调
• BB超卖 = 价格在布林带下轨附近 = 可能反弹
• BB中轨 = 价格在中间位置 = 平衡状态
________________________________________
💡 快速上手 3步看懂面板:
第1步: 看"综合结论标签" (K线上方)
• 绿色"多头占优" → 可以做多
• 红色"空头占优" → 可以做空
• 橙色"震荡/均衡" → 观望
第2步: 看"票数 多/空" (面板最下方)
• 多头票数远大于空头 (差距>2) → 趋势强
• 票数接近 (差距<1) → 震荡市
第3步: 看"趋势强度" (综合标签中)
• 强度>70% → 强势趋势,可重仓
• 强度5070% → 中等趋势,正常仓位
• 强度<50% → 弱势,轻仓或观望
________________________________________
🎨 时段背景色含义:
• 紫色背景 = 亚洲时段 (东京交易时间) 波动较小
• 橙色背景 = 伦敦时段 (欧洲交易时间) 波动增大
• 蓝色背景 = 纽约凌晨 美盘准备阶段
• 红色背景 = 纽约关键5分钟 (09:3009:35) ⚠️ 最重要! 市场最活跃,趋势易形成
• 绿色背景 = 纽约上午后段 延续早盘趋势
交易建议: 重点关注红色关键时段,这5分钟往往决定全天方向!
________________________________________
⚙️ 三大市场推荐设置
🥇 黄金: Hull MA 12/EMA 34, 阈值0.250.35%
₿ 比特币: EMA 21/EMA 55, 阈值0.801.20%
💎 以太坊: TEMA 21/EMA 55, 阈值0.600.80%
参数优化建议
黄金 (XAUUSD)
快速MA: Hull MA 12 (超灵敏捕捉黄金快速波动)
慢速MA: EMA 34 (斐波那契数列)
RSI周期: 9 (加快反应)
强趋势阈值: 0.25%
周期: 5, 15, 60, 240, 1440
比特币 (BTCUSD)
快速MA: EMA 21
慢速MA: EMA 55
RSI周期: 14
强趋势阈值: 0.8% (波动大,阈值需提高)
周期: 15, 60, 240, D, W
外汇 EUR/USD
快速MA: TEMA 10 (快速响应)
慢速MA: T3 30, 因子0.7 (平滑噪音)
RSI周期: 14
强趋势阈值: 0.08% (外汇波动小)
周期: 5, 15, 60, 240, 1440
📖 Indicator Function Details (Concise Version):
🎯 Core Functions:
1. MultiTimeframe Trend Analysis Monitors 8 timeframes simultaneously (1m/5m/15m/1H/4H/D/W/M)
2. 4Dimensional Voting System Comprehensive judgment based on MA trend + RSI momentum + MACD + Bollinger Bands
3. Global Trading Sessions Visualizes Asia/London/New York trading hours
4. Trend Strength Score Quantifies market strength from 0100%
5. Smart Alerts Automatically pushes strong bullish/bearish signals
📚 Key Term Explanations:
🔵 Trend Status (MA Analysis):
| Term | Meaning | Signal Strength |
| | | |
| Strong Bull | Fast MA significantly > Slow MA (Diff ≥0.35%) | ⭐⭐⭐⭐⭐ Long |
| Bullish Bias | Fast MA slightly > Slow MA (Diff <0.35%) | ⭐⭐⭐ Caution Long |
| Ranging | MAs intertwined, no clear direction | ⚠️ Wait & See |
| Bearish Bias | Fast MA slightly < Slow MA | ⭐⭐⭐ Caution Short |
| Strong Bear | Fast MA significantly < Slow MA | ⭐⭐⭐⭐⭐ Short |
Simple Understanding: Fast MA = sprinter (fast reaction), Slow MA = longdistance runner (stable). Sprinter far ahead = Strong Bull, opposite = Strong Bear.
🟠 Momentum Status (RSI Analysis):
| Term | Meaning | Trading Suggestion |
| | | |
| Momentum Up ↗ | RSI >60 & rising rapidly | Strong Buy Signal |
| Momentum High | RSI >60 but rising slower | Watch for pullback, consider reducing position |
| Momentum Neutral | RSI between 4060, stable | Wait for clearer direction |
| Momentum Low | RSI <40 but falling slower | Watch for rebound, consider taking profit |
| Momentum Down ↘ | RSI <40 & falling rapidly | Strong Sell Signal |
Simple Understanding: RSI = car speedometer. "Momentum Up" = full throttle acceleration, "Momentum High" = already fast but not accelerating further.
🟣 Auxiliary Signals:
MACD:
MACD Bullish = Histogram >0 = Strong buyer power
MACD Bearish = Histogram <0 = Strong seller power
Bollinger Bands (BB):
BB Overbought = Price near upper band = Possible pullback
BB Oversold = Price near lower band = Possible rebound
BB Middle = Price near middle band = Balanced state
💡 Quick Start 3 Steps to Understand the Panel:
Step 1: Check "Composite Conclusion Label" (Above the chart)
Green "Bulls Favored" → Consider Long
Red "Bears Favored" → Consider Short
Orange "Ranging/Balanced" → Wait & See
Step 2: Check "Votes Bull/Bear" (Bottom of the panel)
Bull votes significantly > Bear votes (Difference >2) → Strong Trend
Votes close (Difference <1) → Ranging Market
Step 3: Check "Trend Strength" (In the composite label)
Strength >70% → Strong Trend, consider heavier position
Strength 5070% → Moderate Trend, normal position size
Strength <50% → Weak Trend, light position or wait & see
🎨 Trading Session Background Color Meanings:
Purple = Asian Session (Tokyo hours) Lower volatility
Orange = London Session (European hours) Increased volatility
Blue = NY Early Morning US session preparation phase
Red = NY Critical 5 Minutes (09:3009:35) ⚠️ Most Important! Market most active, trends easily form
Green = NY Late Morning Continuation of early session trend
Trading Tip: Focus on the red critical period; these 5 minutes often determine the day's direction!
⚙️ Recommended Settings for Three Major Markets
🥇 Gold (XAUUSD):
Fast MA: Hull MA 12 (Highly sensitive for gold's fast moves)
Slow MA: EMA 34 (Fibonacci number)
RSI Period: 9 (Faster reaction)
Strong Trend Threshold: 0.25%
Timeframes: 5, 15, 60, 240, 1440
₿ Bitcoin (BTCUSD):
Fast MA: EMA 21
Slow MA: EMA 55
RSI Period: 14
Strong Trend Threshold: 0.8% (High volatility, requires higher threshold)
Timeframes: 15, 60, 240, D, W
💎 Ethereum (ETHUSD):
Fast MA: TEMA 21
Slow MA: EMA 55
RSI Period: 14
Strong Trend Threshold: 0.600.80%
Timeframes: 15, 60, 240, D, W
💱 Forex EUR/USD:
Fast MA: TEMA 10 (Fast response)
Slow MA: T3 30, Factor 0.7 (Smooths noise)
RSI Period: 14
Strong Trend Threshold: 0.08% (Forex has low volatility)
Timeframes: 5, 15, 60, 240, 1440

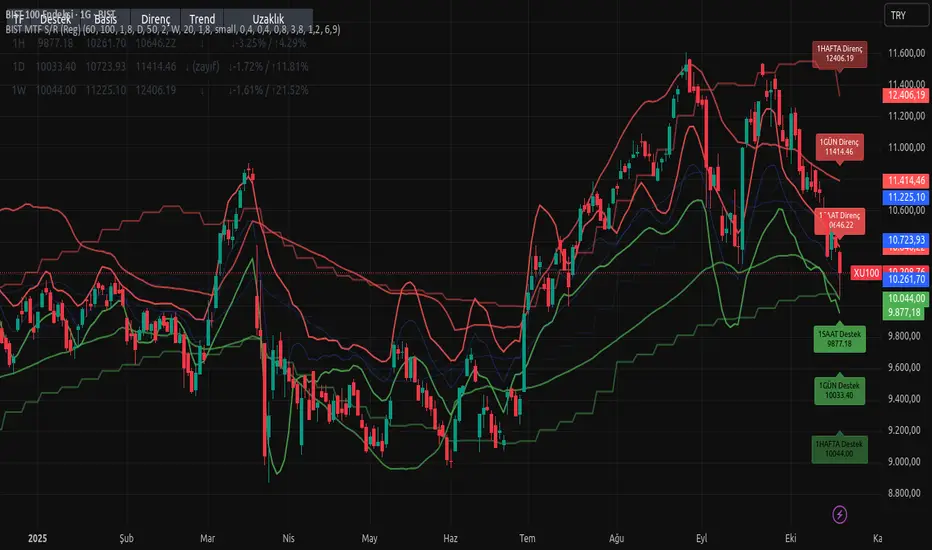
1H / 1D / 1W Çoklu Zaman Ölçekli Destek–Direnç (Reg Kanal Özeti)Multi-Timeframe Regression Channel — Support & Resistance Map
This indicator automatically plots regression-based support and resistance levels for three major timeframes — 1H (short-term traders), 1D (swing traders), and 1W (long-term investors) — all displayed on the same chart.
It combines linear regression channels and standard deviation offsets to reveal the active trend and volatility structure across multiple time horizons.
Each timeframe includes:
Upper band (Resistance) — potential selling or overextension zone
Basis line (Regression mean) — fair-value trend midpoint
Lower band (Support) — potential accumulation or reaction zone
A summary table in the top-left corner shows current levels, slope direction (↑ / ↓ / →), RSI-based strength notes, and percentage distances to each band.
All levels auto-update with the latest data, regardless of the chart timeframe.
Ideal for:
Multi-timeframe confluence analysis
Swing trading setups and breakout confirmations
Trend-following or mean-reversion strategies
✅ Tip:
When price holds above the lower band, the structure remains bullish.
A clean break above resistance often signals momentum continuation, while a close below support can mark a trend weakening.
G_GMMA• Comprehensive GMMA Visualization: It plots six fast EMAs and six slow EMAs, clearly distinguishing short term and long term trends. The indicator fills the space between the fastest and slowest EMAs in each group, turning the moving averages into easily identifiable ribbons rather than a mass of overlapping lines.
• Customizable Appearance: Users can adjust the colors of the fast and slow EMA lines, the fill colors of each ribbon, and the overall line thickness. This makes it easy to tailor the chart to personal preferences or trading templates.
• Dynamic Background Shading: The script can shade the chart’s background depending on whether the fast ribbon is above or below the slow ribbon, giving a quick visual cue for trend direction (uptrend vs. downtrend).
• Touch Alert System: Up to three different EMA lengths can be monitored for “touch” events. When price touches a selected EMA (e.g., 20 , 50 or 200 period EMA), the indicator triggers an alert condition and plots a small circle on the chart at the contact point. This helps traders catch precise entry or exit signals without staring at the screen.
• Flexible Input: Both fast and slow EMA lengths, colors, and alert parameters are user adjustable from the indicator’s settings. This allows the same script to be used on different instruments (e.g., Gold, forex pairs) and time frames by simply changing the period values.
• Trend Sensitive Support/Resistance: By treating the slow EMA ribbon as a dynamic support/resistance zone, the indicator helps traders identify where price is likely to stall or reverse. Combining this with the touch alerts makes it well suited for scalping or intraday trades.

Bollinger Bands — Bounce, Squeeze & Trend Rider📘 Bollinger Bands Indicator — Quick Lookup Sheet
🟢 Bounce Signals (Mean Reversion)
Bounce Buy
→ Price touched or fell below the lower band and then re-entered inside the bands.
→ Signals a possible oversold rebound.
→ Typical action: buy or cover shorts.
Bounce Sell
→ Price touched or exceeded the upper band and then fell back inside.
→ Signals a possible overbought pullback.
→ Typical action: sell or take profits.
🟩 Squeeze Breakout Signals (Volatility Expansion)
SZ Long
→ Squeeze Breakout Long.
→ The Bollinger Bands were tight (low volatility) and price broke above the upper band.
→ Signals a bullish breakout — often the start of a strong upward move.
SZ Short
→ Squeeze Breakout Short.
→ The Bollinger Bands were tight and price broke below the lower band.
→ Signals a bearish breakout — possible start of a downward move.
🌿 Trend Rider Markers (Trend Confirmation)
Ride Up (tiny green dot)
→ The 20-day SMA is sloping upward, and price stays near the upper band (%B > 0.8).
→ Confirms a strong uptrend — don’t fade it too early.
Ride Down (tiny red dot)
→ The 20-day SMA is sloping downward, and price stays near the lower band (%B < 0.2).
→ Confirms a strong downtrend — momentum remains bearish.
🧭 Background Colors
Light green background → Market in a confirmed uptrend.
Light red background → Market in a confirmed downtrend.

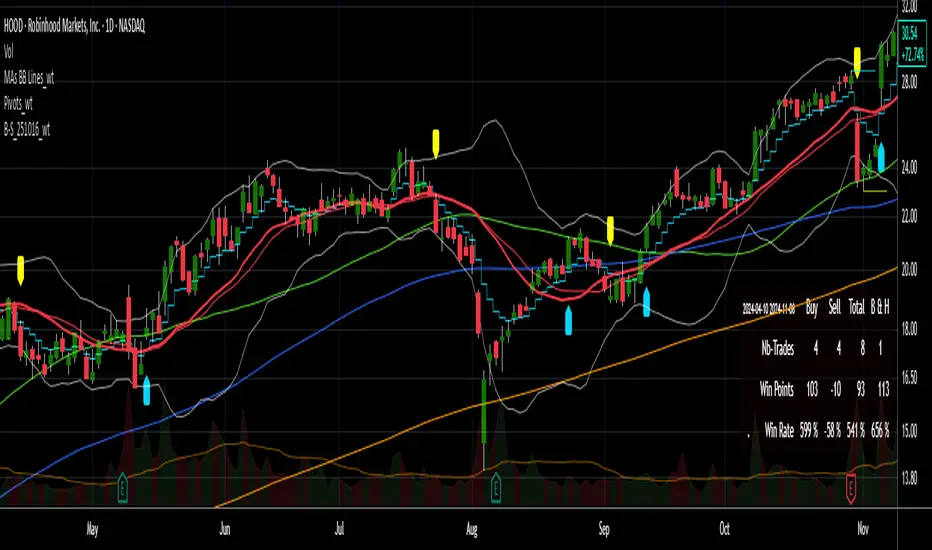
Buy/Sell Signals [WynTrader]My name is WynTrader. I cumulate 24 years of experience.
This Indicator produces Buy/Sell Signals using these features:
- Fast and Slow Moving averages (modifiable) optimized at EMA-8 and SMA-35
- Bollinger Bands (modifiable) optimized at Basis-18 and Multiplier-1
Also, the Buy/Sell Signals are conditioned by three Filters (optionable, modifiable) :
. Bollinger-Bands Lookback
. High-Low vs Candle Range %
. Distance from Fast and Slow Moving averages %
The Results Calculation presented in a Table are based :
- on the Current Chart Visible Range (optionable)
or
- on the specified TIme Frame Start and End Dates (modifiable)
The Table shows Calculation Results of the Buy and Sell Signals that are activated on the chart, with the Number of Trades (Signals), the Winning Points and the Win Rate %. The Buy&Hold starts calculation at the first Buy encountered.
So be surprised by my Buy/Sell Indicator. But always remember that the world is not perfect. The Graal Indicator, even with AI, doesn't already exist, maybe one day (all of us richier...), but not now. , depending on the chart product (stocks...), volatility, probabilities, unpredictable behaviour. , the moves, etc.
Enjoy
WynTrader
P. s. :
My name is WynTrader. I cumulate 24 years of experience. In 2001, I took an intensive technical analysis course taught by an exceptional friend, Cyril, who taught me everything I know. The foundation I gained through his teaching remains solid and relevant to this day, never failing me.
Before i made this Indicator, I have used many Trading View Buy/Sell Indicators using alone or combined RSI, SMI, OBV, MACD ATR, ADX, Neural, Fractal, Geometry, etc., that are already available for the Trading View community. A great thanks to those who give their time that help me build this tool.
Note that I'm not a programmer, so... ;-)