EMA CloudThe EMA Crossover Cloud is a clean and intuitive indicator that combines two Exponential Moving Averages (EMA) into a visual cloud.
Key features:
Cloud visualization: The space between EMA A and EMA B is shaded, making the current trend direction easier to identify.
Crossover signals: A clear LONG signal is plotted when EMA A crosses above EMA B, and a SHORT signal when EMA A crosses below EMA B.
Bar coloring: Candles are automatically colored according to the trend (uptrend, downtrend, or neutral).
Customizable colors: Cloud, signals, and bars can all be customized to match your chart style.
Alerts ready: Built-in alerts for EMA crossovers (LONG/SHORT).
Status label: A compact label shows the current cloud trend state in real time.
This indicator is ideal for traders who prefer simple and reliable crossover signals combined with a clear trend visualization. It works on any timeframe or asset.
頻帶和通道

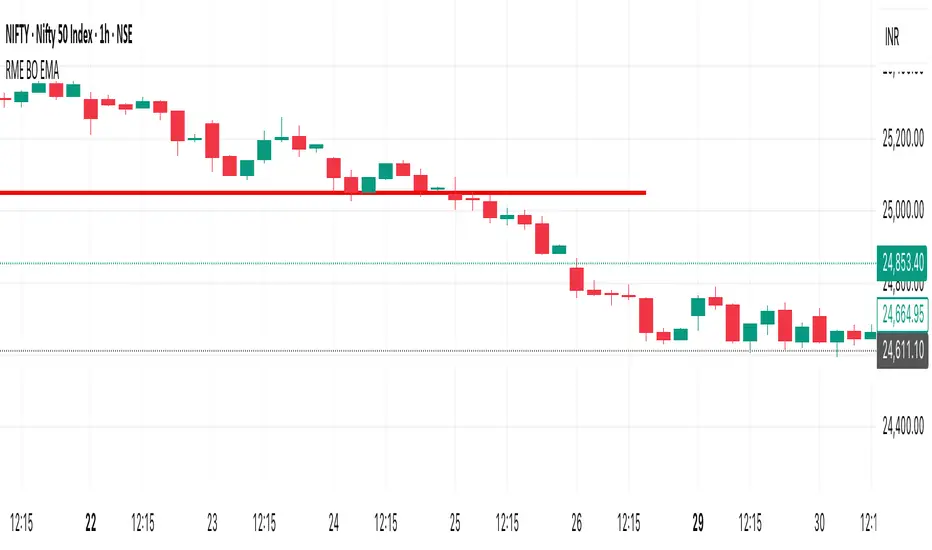
RME BO EMAThe Market Structure Indicator is a powerful TradingView tool designed to automatically detect and display market structure shifts, break of structure (BOS), and change of character (ChoCH). It helps traders quickly identify bullish or bearish trends, key swing highs and lows, and potential reversal zones without manually drawing levels.
✅ Key Features:
Auto-detection of swing highs & lows
Marks Break of Structure (BOS) & Change of Character (ChoCH)
Highlights trend direction (bullish/bearish)
Customizable alerts for BOS/ChoCH confirmations
Works across all timeframes & instruments (stocks, forex, crypto, indices)
Filters out market noise with smart sensitivity settings
⚡ Why It’s the Best:
This indicator simplifies price action analysis by visually mapping the market’s backbone—its structure. Instead of second-guessing where a trend begins or ends, traders get clear, rule-based confirmations to improve entries, exits, and overall trade confidence.
RSI-like VWAP — DivergencesThis script introduces a unique RSI-style oscillator built from VWAP (Volume-Weighted Average Price) instead of price alone, offering a more volume-aware perspective of market momentum.
🔹 Key Features:
Computes an RSI-like indicator using either a per-bar VWAP proxy (HLC3/OHLC4) or true intrabar VWAP (via lower timeframe aggregation).
Customizable overbought, oversold, midline, and deadband levels for better signal filtering.
Divergence detection (regular + hidden) between price and the VWAP-RSI oscillator, with clear lines and labels in the indicator pane.
Auto-scaled pivot sensitivity across different chart timeframes to maintain consistency.
Built-in alert conditions for bullish/bearish divergences, making it watchlist-friendly.
🔹 Use Cases:
This tool helps traders spot momentum shifts and early reversal signals by blending the logic of RSI with the weighting power of VWAP. It’s especially useful for detecting divergences where price action may be misleading without volume context.

8 SMA Bands (Points)The "8 SMA Bands (Points)" indicator creates a set of eight Simple Moving Average (SMA) bands with adjustable offsets, overlaid on a price chart.
Here’s a breakdown:
Purpose: It tracks price trends using multiple SMAs of varying lengths (default 25, 50, 100, 200, 400, 800, 1600 periods) and adds upper and lower bands around each SMA based on point offsets, helping identify potential support, resistance, and trend strength.
Key Components:
SMAs: Eight SMAs are calculated using closing prices with lengths ranging from 25 to 1600 periods. Each SMA is plotted with a distinct color and line thickness (e.g., MA 1 is blue, MA 8 is white with thicker lines).
Bands: For each SMA, upper and lower bands are created by adding or subtracting a point-based offset (suggestions are to use default Murray Math based numbers e.g., 0.305176 for MA 1, 39.062528 for MA 8) multiplied by a global multiplier (default 1.0). These offsets define the band width and are customizable.
Customization: Users can adjust SMA lengths, offset points, colors, and the global multiplier via input settings grouped by each MA.
Visuals: SMAs are plotted as solid lines with increasing thickness for longer periods (e.g., MA 6–8 use thicker lines or circles).
Bands are plotted as semi-transparent lines matching the SMA color, with longer-term bands (MA 6–7) using a different style for emphasis.
Usage: The indicator helps traders visualize trend direction (upward if price is above most SMAs, downward if below) and potential reversal zones where price interacts with band boundaries.
The flattening or crossing of bands can signal momentum shifts. The coming together of multiple envelope tops/bottoms can signal reversal zones of various degrees based on how many envelopes come together. More envelopes converging mean a more significant top or bottom.
This indicator is particularly useful for identifying multi-timeframe trends and volatility zones on assets like Gold Futures, with flexibility to fine-tune based on market conditions.

Trend Candle CounterComplete Tutorial: Trend Candle Counter Pine ScriptTable of Contents
Installation Guide
Understanding the Indicator
How It Works
Customization Options
Trading Strategies
Setting Up Alerts
Troubleshooting
1. Installation Guide {#installation}Step-by-Step Installation:Step 1: Open TradingView
Go to www.tradingview.com
Log in to your account
Step 2: Access Pine Editor
Click on "Pine Editor" tab at the bottom of the chart
Or press Alt + E (Windows) or Option + E (Mac)
Step 3: Create New Indicator
Click "Open" → "New blank indicator"
Delete any default code
Step 4: Paste the Script
Copy the entire Trend Candle Counter script
Paste it into the editor
Step 5: Save and Apply
Click "Save" (or Ctrl + S)
Give it a name: "Trend Candle Counter"
Click "Add to Chart"
✅ Done! The indicator should now appear on your chart.2. Understanding the Indicator {#understanding}What Does It Do?This indicator numbers each candle based on the current trend: {scrollbar-width:none;-ms-overflow-style:none;-webkit-overflow-scrolling:touch;} ::-webkit-scrollbar{display:none}Trend TypeNumberingVisualUptrend+1, +2, +3, +4...🟢 Green labelsDowntrend-1, -2, -3, -4...🔴 Red labelsTrend ChangeResets to ±1Label color switchesVisual Components:
Candle Labels - Numbers above each candle
Trend Line (EMA) - Green (up) / Red (down)
Background Shading - Light green/red tint
Info Table - Top-right corner showing:
Current trend direction
Current candle number
Current price
3. How It Works {#how-it-works}Trend Detection Logic:IF Close > EMA → UPTREND (positive counting)
IF Close < EMA → DOWNTREND (negative counting)
Counting Mechanism:Example Uptrend:Candle 1: Close > EMA → Label: +1
Candle 2: Close > EMA → Label: +2
Candle 3: Close > EMA → Label: +3
Candle 4: Close < EMA → Label: -1 (trend changed!)
Example Downtrend:Candle 1: Close < EMA → Label: -1
Candle 2: Close < EMA → Label: -2
Candle 3: Close < EMA → Label: -3
Candle 4: Close > EMA → Label: +1 (trend changed!)
Key Insight:The higher the absolute number, the longer the trend has been running!4. Customization Options {#customization}Accessing Settings:
Click the gear icon ⚙️ next to the indicator name
Go to "Inputs" tab
Available Parameters: {scrollbar-width:none;-ms-overflow-style:none;-webkit-overflow-scrolling:touch;} ::-webkit-scrollbar{display:none}ParameterDefaultDescriptionRecommendationTrend Detection Length14EMA period for trend5-10: Scalping14-20: Day trading50-200: Swing tradingShow Candle Numbers✅ YesDisplay labelsDisable for cleaner chartLabel SizeSmallSize of numbersTiny: Multi-timeframeLarge: Focus on one chartUptrend ColorGreenPositive number colorCustomize to preferenceDowntrend ColorRedNegative number colorCustomize to preferenceOptimization by Trading Style:For Scalpers (1m - 5m charts):Trend Detection Length: 5-10
Label Size: Tiny
Show Labels: Optional (can be cluttered)
For Day Traders (15m - 1h charts):Trend Detection Length: 14-20
Label Size: Small
Show Labels: Yes
For Swing Traders (4h - Daily charts):Trend Detection Length: 50-100
Label Size: Normal
Show Labels: Yes
5. Trading Strategies {#strategies}Strategy 1: Trend Reversal TradingEntry Signals:
Buy: When counter changes from negative to +1
Sell: When counter changes from positive to -1
Confirmation:
Wait for +2 or -2 to confirm trend strength
Use additional indicators (RSI, MACD) for validation
Example:Candle: -5, -6, -7, -8, +1, +2 ← BUY HERE
Stop Loss: Below the -8 candle low
Target: When counter reaches +8 to +10
Strategy 2: Trend Continuation TradingEntry Signals:
Buy: Enter on pullbacks during uptrend (e.g., at +3, +5, +7)
Sell: Enter on bounces during downtrend (e.g., at -3, -5, -7)
Risk Management:
Avoid entering at high numbers (+15, -15) - trend may be exhausted
Example:Candle: +1, +2, +3 ← Small pullback, BUY
Continue: +4, +5, +6, +7
Exit: When counter resets to -1
Strategy 3: Trend Exhaustion DetectionWarning Signs:
Counter reaches +10 or higher → Uptrend may be overextended
Counter reaches -10 or lower → Downtrend may be overextended
Action:
Tighten stop losses
Take partial profits
Watch for reversal patterns (doji, engulfing)
Strategy 4: Multi-Timeframe AnalysisSetup:
Add indicator to 3 timeframes (e.g., 15m, 1h, 4h)
Look for alignment
Best Trades:15m: +1 (new uptrend)
1h: +5 (established uptrend)
4h: +3 (strong uptrend)
→ HIGH PROBABILITY BUY
6. Setting Up Alerts {#alerts}Built-in Alert Conditions:The script includes 2 automatic alerts:
"Uptrend Started" - Triggers when counter = +1
"Downtrend Started" - Triggers when counter = -1
How to Set Up Alerts:Step 1: Right-click on chart
Select "Add Alert"
Step 2: Configure Alert
Condition: Select "Trend Candle Counter"
Choose: "Uptrend Started" or "Downtrend Started"
Options:
Once per bar close (recommended)
Webhook URL (for automation)
Step 3: Notification Settings
✅ Popup
✅ Send email
✅ Push notification (mobile app)
✅ Play sound
Step 4: Create Alert
Click "Create"
Custom Alert Ideas:Alert for Specific Candle Numbers:
Notify when counter reaches +5 or -5
Notify when counter exceeds +10 or -10 (exhaustion)
7. Troubleshooting {#troubleshooting}Common Issues & Solutions:Issue 1: Labels are too cluttered
Solution:
Disable "Show Candle Numbers" in settings
Use larger timeframe
Reduce label size to "tiny"
Issue 2: Too many false signals
Solution:
Increase "Trend Detection Length" (e.g., 20, 50)
Wait for +2 or -2 confirmation
Combine with other indicators
Issue 3: Trend line doesn't match price action
Solution:
Adjust EMA length to match your trading style
Consider using different trend detection (SMA, HMA)
Issue 4: Indicator not showing on chart
Solution:
Check if it's in a separate pane - move to main chart
Refresh the page
Re-add the indicator
Issue 5: Counter seems delayed
Solution:
This is normal - indicator confirms on candle close
For faster signals, use lower timeframe
Reduce EMA length (but expect more noise)
8. Advanced Tips 💡Combining with Other Indicators:Best Combinations:
RSI + Trend Candle Counter
Buy at +1 when RSI > 50
Sell at -1 when RSI < 50
MACD + Trend Candle Counter
Confirm +1 with MACD bullish crossover
Confirm -1 with MACD bearish crossover
Volume + Trend Candle Counter
Strong trends (+1) should have increasing volume
Low volume at high numbers (+10) = exhaustion
Reading Market Psychology: {scrollbar-width:none;-ms-overflow-style:none;-webkit-overflow-scrolling:touch;} ::-webkit-scrollbar{display:none}Counter ValueMarket Psychology+1 to +3Early adopters entering+4 to +7Momentum building+8 to +12FOMO phase+13+Extreme greed - caution!-1 to -3Early sellers-4 to -7Panic building-8 to -12Capitulation-13+Extreme fear - reversal likely9. Real Trading Example 📊Scenario: BTC/USD 1H ChartTime | Counter | Action
--------|---------|----------------------------------
10:00 | -8 | Downtrend established
11:00 | -9 | Still falling
12:00 | -10 | Exhaustion zone - watch closely
13:00 | +1 | ✅ BUY SIGNAL - Trend reversal!
14:00 | +2 | Confirmation - trend valid
15:00 | +3 | Hold position
16:00 | +4 | Add to position (optional)
17:00 | +5 | Move stop loss to breakeven
...
22:00 | +11 | Take partial profits
23:00 | +12 | Tighten stop loss
00:00 | -1 | ❌ EXIT - Trend reversed

BTC Pro – Modular v6 (Final Version with Clean Labels)A complete Bitcoin charting toolkit built for clarity and decision-making.
✅ EMA levels (21, 50, 200, 800)
✅ Daily EMA 50 (constant across timeframes)
✅ SuperTrend for directional bias
✅ Liquidity zones based on ±2×ATR around SMA50
✅ On-Balance Volume (manual calculation)
✅ ADX trend strength with threshold labeling
✅ RSI divergence detection (bullish/bearish)
✅ Market structure: HH/LL breaks
✅ Entry zones with auto-generated SL/TP boxes
✅ Clean right-side labels (stacked)
✅ Modular toggles for full control via settings
Created by WhyPhy – modular, readable, and ready for live use.

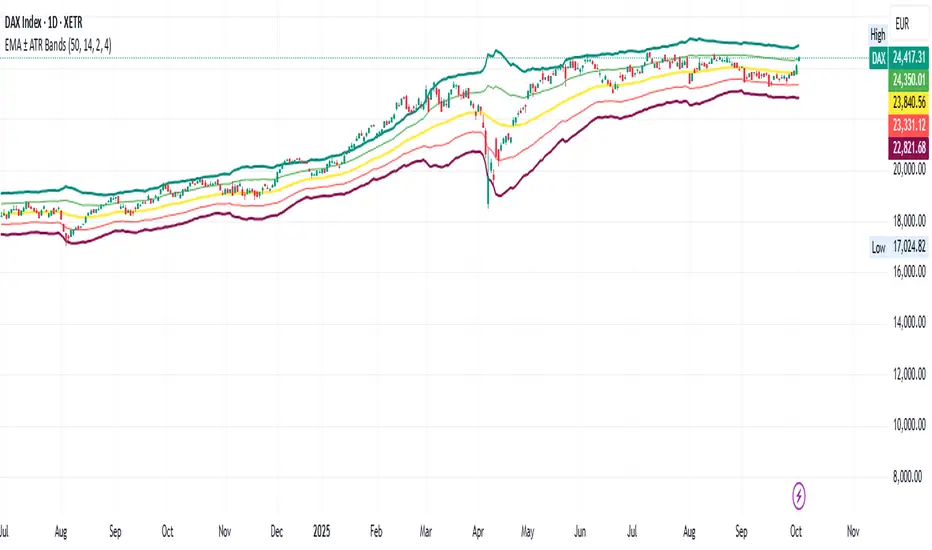
EMA ± ATR BandsPlot the bands from EMA as potential points where may want to enter/exit on principle that price returns to mean over time.
This script was created using Chat GPT.
Atlantean Sideways / Range Regime DetectorPurpose
When using trend based indicators, you can skip the false signals when there is a sideways action, protecting you from the false signals.
Flags likely sideways/range phases using three checks:
Weak trend (ADX from DMI)
Price compression (Bollinger Band Width, normalized)
Low volatility (NATR = ATR/Price%)
Logic
isSideways = (ADX < adxThresh) AND (bbNorm < 0.25) AND (NATR < natrMax)
When true: bars + background turn teal and a provisional Range High/Low (rolling rangeWin) is drawn.
Key Inputs
DMI: diLen(22)
Optimized for 15 mins Bitcoin, could change it to 14 for more general approach
ADX: adxSmooth(14), adxThresh(18)
Volatility: lenATR(14), natrMax(1.8)
Visuals: rangeWin(20), bar/range toggles
Quick Tuning
More signals: raise adxThresh to 20–25, raise natrMax to 2.5–4.0, increase BB cutoff by editing bbNorm < 0.25 --> 0.35–0.50.
Smoother range lines: increase rangeWin to 30–40.
Use Cases
Mean reversion inside teal ranges.
Breakout prep when price closes outside the drawn range after teal ends. Could be used as a signal although not suggested.
Filter trend systems: skip trades when sidewaysCond is true. This is the main purpose, for it to be combined with trend based indicators, like Supertrend.
Alert
“Sideways Detected” triggers when isSideways is true.
Script could be expanded upon your requests.

Sri_Heikinashi T3 Candle line for long entry📌 Script Name:
Sri_Heikinashi T3 line for long entry (SRi-T3)
🔎 What this script does:
This indicator is a custom Heikin Ashi + T3 smoothed candle plotting tool.
Instead of showing raw candles or raw Heikin Ashi, it applies a double stage of T3 smoothing to Heikin Ashi values, giving a cleaner trend-following visual without market noise.
It doesn’t replace the original chart candles — it overlays smoothed, wick-less “trend candles” on top of your chart to highlight trend direction clearly.
🧩 Key Components:
1. Custom Timeframe Input
customTF = input.timeframe("120", "Custom Timeframe")
👉 You can choose any timeframe (5m, 15m, 1h, Daily, etc.), regardless of your chart timeframe.
This allows multi-timeframe analysis (e.g., plotting 2-hour smoothed candles on a 5-minute chart).
2. T3 Smoother Function
A custom function t3(src, length, v) is used.
T3 is a triple exponential moving average (EMA) smoother with a “volume factor” v.
Advantage: less lag than normal EMA/SMA, but smoother and cleaner trend lines.
3. Heikin Ashi Logic (inside calcHaT3)
Stage 1: Apply T3 smoothing to Heikin Ashi open, high, low, close.
Stage 2: Recalculate Heikin Ashi formula (open/close averaging, high/low logic).
Stage 3: Apply another round of T3 smoothing.
Final Output: Super-smooth OHLC values.
4. Plotting
Candles are plotted with:
No wicks (only body high/low).
Colors:
Green (lime) if close > open.
Red/Orange if close < open.
Slight transparency (95) so they don’t overpower chart candles.
👉 This way you get a visual overlay of the smoothed Heikin Ashi trend.
5. Alerts
Alerts are triggered when trend color changes:
From red → green (potential long entry).
From green → red (potential exit/short).
✅ Pros (Advantages)
Noise Reduction
Double T3 + Heikin Ashi makes signals smoother than raw price or single MA.
Clear Trend Identification
Candles change color only when trend is strong enough, filtering false moves.
Multi-Timeframe Support
You can plot higher timeframe trends (e.g., daily smoothed trend) on lower charts.
No Wick Confusion
Removes wicks to simplify visuals, focusing purely on direction.
Alerts for Trend Shifts
Automatic alert conditions for quick reaction.
Perfect for Long Entries
Since it’s designed for “long entry” confirmation, it’s especially helpful to avoid early entries.
⚡ How to Use This Script
Add to Chart
Copy → Paste into TradingView Pine Editor → Save & Add to Chart.
Select Custom Timeframe
Default is 120m (2 hours) but you can change to 15m, 60m, Daily, etc.
Example: On a 5m chart, load a 1h or 4h SRi-T3 to align with bigger trend.
Look for Color Changes
Green = bullish trend (favorable for long entries).
Orange/Red = bearish trend (avoid longs or look for short setup).
Use Alerts
Set alerts for "Heikin-Ashi Smoothed from red to green" = Long Signal.
"Heikin-Ashi Smoothed from green to red" = Exit/Short Signal.
Combine with Other Tools
Works best if combined with pivots, support/resistance, or momentum oscillators (RSI, CCI, etc.).
Use SRi-T3 as trend filter, enter trades only in its direction.
📊 Example Trading Setup
On a 15m chart:
Plot SRi-T3 with 60m timeframe → this gives you higher timeframe trend.
Enter long trades only if SRi-T3 is green.
Add RSI/MACD for entry confirmation.

Candle Density Indicator_SH_v1This indicator visually highlights the price zones where candlesticks have most frequently passed, using box shapes.
Unlike a standard volume profile, it focuses soley on the areas most visited by candlestick bodies, displayed as gray boxes, and marks the highest and lowest prices within each zone. Additionally, it features a highlight function:
The number displayed inside the gray box represents the average trading volume of the most recent supply zone.
candlestick bodies that exceed the zone's average trading volume are emphasized in yellow.

Open Range Breakout (ORB) with Alerts and LabelsThis is a classic 5min ORB indicator that highlights the orb range for your chosen session. This makes it easy to reference the range later in the trading day. In addition to the original orb signals for both buy and sell you can play off that zone for powerful entries later in the session. The signals give TP1 1:1 TP2 2:1
Options
You can set the name of the session
The color of the range.
The buffer for the SL
How many entries for the orb
EQ + Bandas Pro 📊 EQ + Bands Pro is an advanced indicator built on OHLC analysis. It calculates a synthetic equilibrium price and plots dynamic, robust bands that adapt to volatility while filtering outliers. The tool highlights zones of overvaluation and undervaluation, helping traders identify key imbalances, potential reversals, and trend confirmations.

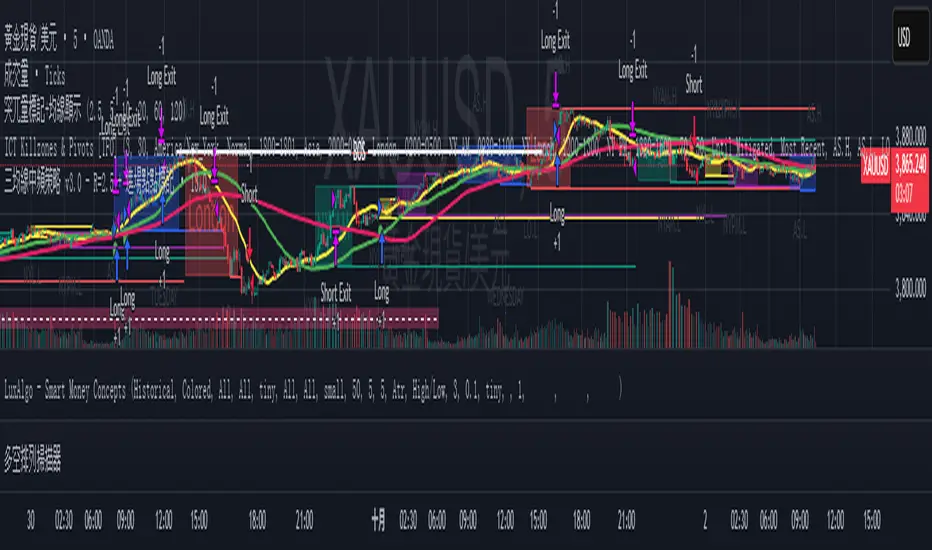
三均線中頻策略 v3.0 - R=2.5 + 進場點點標記📌 Core Strategy Concept
This is a medium-frequency trend-following model that utilizes three Simple Moving Averages to determine bullish or bearish alignment. It then enters trades in the direction of the trend when price confirms a breakout and applies a fixed risk-to-reward ratio (R). Stop loss and take profit levels are dynamically calculated based on moving averages, ensuring clear risk control and systematic execution.
✅ Strategy Advantages
📏 Clear Rules Trade conditions based on triple SMA alignment and price breakout; easy to replicate.
🛡 Defined Risk Stop loss and take profit are calculated based on moving averages with a fixed R ratio, ensuring disciplined risk management.
⚖️ Balanced Frequency Medium trade frequency avoids overtrading while still capturing sufficient opportunities.
👁 Visual Markers Entry points are visually marked on the chart for easy backtesting and live tracking.
Harry Dunn Volatility BandsEnter strike price and 2 percentage numbers to automatically calculate and draw volatility bands on chart.

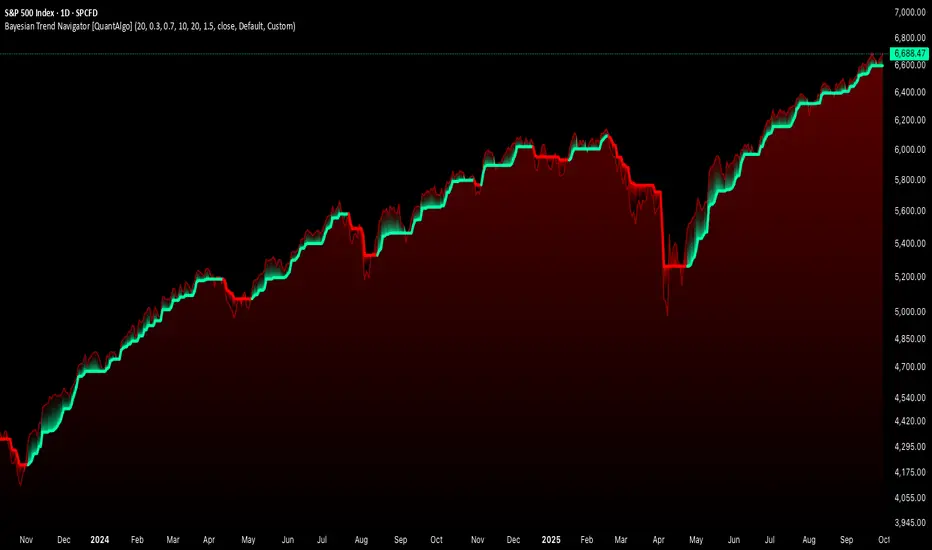
Bayesian Trend Navigator [QuantAlgo]🟢 Overview
The Bayesian Trend Navigator uses Bayesian statistics to continuously update trend probabilities by combining long-term expectations (prior beliefs) and short-term observations (likelihood evidence), rather than relying solely on recent price data like many conventional indicators. This mathematical framework produces robust directional signals that naturally balance responsiveness with stability, making it suitable for traders and investors seeking statistically-grounded trend identification across diverse market environments and asset types.
🟢 How It Works
The indicator operates on Bayesian inference principles, a statistical method for updating beliefs when new evidence emerges. The system begins by establishing a prior belief - a long-term trend expectation calculated from historical price behavior. This represents the "baseline hypothesis" about market direction before considering recent developments.
Simultaneously, the algorithm collects recent market evidence through short-term trend analysis, representing the likelihood component. This captures what current price action suggests about directional momentum independent of historical context.
The core Bayesian engine then combines these elements using conjugate normal distributions and precision weighting. It calculates prior precision (inverse variance) and likelihood precision, combining them to determine a posterior precision. The resulting posterior mean represents the mathematically optimal trend estimate given both historical patterns and current reality. This posterior calculation includes intervals derived from the posterior variance, providing probabilistic confidence bounds around the trend estimate.
Finally, volatility-based standard deviation bands create adaptive boundaries around the Bayesian estimate. The trend line adjusts within these constraints, generating color transitions between bullish (green) and bearish (red) states when the posterior calculation crosses these probabilistic thresholds.
🟢 How to Use
Green/Bullish Trend Line: Posterior probability favoring upward momentum, indicating statistically favorable conditions for long positions (buy)
Red/Bearish Trend Line: Posterior probability favoring downward momentum, signaling mathematically supported timing for short positions (sell)
Rising Green Line: Strengthening bullish posterior as new evidence reinforces upward beliefs, showing increasing probabilistic confidence in trend continuation with favorable long entry conditions
Declining Red Line: Intensifying bearish posterior with accumulating downside evidence, indicating growing statistical certainty in downtrend persistence and optimal short positioning opportunities
Flattening Trends: Diminishing posterior confidence regardless of color suggests equilibrium between prior beliefs and contradictory evidence, potentially signaling consolidation or insufficient statistical clarity for high-conviction trades
🟢 Pro Tips for Trading and Investing
→ Preset Configuration Strategy: Deploy presets based on your trading horizon - Scalping preset maximizes evidence weight (0.8) for rapid Bayesian updates on 1-15 minute charts, Default preset balances prior and likelihood for general applications, while Swing Trading preset equalizes weights (0.5/0.5) for stable inference on hourly and daily timeframes.
→ Prior Weight Adjustment: Calibrate prior weight according to market regime - increase values (0.5-0.7) in stable trending markets where historical patterns remain predictive, decrease values (0.2-0.3) during regime changes or news-driven volatility when recent evidence should dominate the posterior calculation.
→ Evidence Period Tuning: Modify the evidence period based on information flow velocity. Use shorter periods (5-8 bars) for assets with continuous price discovery like cryptocurrencies, medium periods (10-15) for liquid stocks, and longer periods (15-20) for slower-moving markets to ensure adequate likelihood sample size.
→ Likelihood Weight Optimization: Adjust likelihood weight inversely to market noise levels. Higher values (0.7-0.8) work well in clean trending conditions where recent data is reliable, while lower values (0.4-0.6) help during choppy periods by maintaining stronger reliance on established prior beliefs.
→ Multi-Timeframe Bayesian Confluence: Apply the indicator across multiple timeframes, using higher timeframes (Daily/Weekly) to establish prior belief direction and lower timeframes (Hourly/15-minute) for likelihood-driven entry timing, ensuring posterior probabilities align across temporal scales for maximum statistical confidence.
→ Standard Deviation Multiplier Management: Adapt the multiplier to match current uncertainty levels. Use tighter multipliers (1.0-1.5) during low-volatility consolidations to capture early trend emergence, and wider multipliers (2.0-2.5) during high-volatility events to avoid premature signals caused by statistical noise rather than genuine posterior shifts.
→ Variance-Based Position Sizing: Monitor the implicit posterior variance through trend line stability - smooth consistent movements indicate low uncertainty warranting larger positions, while erratic fluctuations suggest high statistical uncertainty calling for reduced exposure until clearer probabilistic convergence emerges.
→ Alert-Based Probabilistic Execution: Utilize trend change alerts to capture every statistically significant posterior shift from bullish to bearish states or vice versa without constantly monitoring the charts.
ATR Volatility and Trend AnalysisATR Volatility and Trend Analysis
Unlock the power of the Average True Range (ATR) with the ATR Volatility and Trend Analysis indicator. This comprehensive tool is designed to provide traders with a multi-faceted view of market dynamics, combining volatility analysis, dynamic support and resistance levels, and trend detection into a single, easy-to-use indicator.
How It Works
The ATR Volatility and Trend Analysis indicator is built upon the core concept of the ATR, a classic measure of market volatility. It expands on this by providing several key features:
Dynamic ATR Bands: The indicator plots three sets of upper and lower bands around the price. These bands are calculated by multiplying the current ATR value by user-defined multipliers. They act as dynamic support and resistance levels, widening during volatile periods and contracting during calm markets.
Volatility Breakout Signals: Identify potential breakouts with precision. The indicator generates a signal when the current ATR value surges above its own moving average by a specified threshold, indicating a significant increase in volatility that could lead to a strong price move.
Trend Detection: The indicator determines the market trend by analyzing both price action and ATR behavior. A bullish trend is signaled when the price is above its moving average and volatility is increasing. Conversely, a bearish trend is signaled when the price is below its moving average and volatility is increasing.
How to Use the ATR Multi-Band Indicator
Identify Support and Resistance: Use the ATR bands as key levels. Price approaching the outer bands may indicate overbought or oversold conditions, while a break of the bands can signal a strong continuation.
Confirm Breakouts: Look for a volatility breakout signal to confirm the strength behind a price move. A breakout from a consolidation range accompanied by a volatility signal is a strong indicator of a new trend.
Trade with the Trend: Use the background coloring and trend signals to align your trades with the dominant market direction. Enter long positions during confirmed bullish trends and short positions during bearish trends.
Set Up Alerts: The indicator includes alerts for band crosses, trend changes, and volatility breakouts, ensuring you never miss a potential trading opportunity.
What makes it different?
While many indicators use ATR, the ATR Volatility and Trend Analysis tool is unique in its integration of multiple ATR-based concepts into a single, cohesive system. It doesn't just show volatility; it interprets it in the context of price action to deliver actionable trend and breakout signals, making it a complete solution for ATR-based analysis.
Disclaimer
This indicator is designed as a technical analysis tool and should be used in conjunction with other forms of analysis and proper risk management.
Past performance does not guarantee future results, and traders should thoroughly test any strategy before implementing it with real capital.

Regression Channel (ShareScope-style, parallel)What it does
Replicates ShareScope’s Trend of displayed data look: a single straight linear-regression line (dashed) across a chosen window with parallel, constant-width bands above and below, plus optional shading.
Use it to see the overall trend gradient for a period and a statistically sized channel based on the fit’s residual error.
How it works (math, short)
Computes an OLS regression once over the analysis window.
Residual standard error s is derived from SSE and degrees of freedom (n−2).
Band half-width is constant across the window:
Mean CI (narrower): half = z * s / √n
Prediction (wider): half = z * s * √(1 + 1/n)
Three straight, parallel lines are drawn from the regression endpoints; midline is dashed.
This is intentionally not a tapered CI (which widens at the ends). It matches the visual behaviour of ShareScope’s shaded trend line channel.
Inputs
Source – Price series (Close, High, Low, HL2, etc.).
Use last N bars / N (bars) – Rolling window length.
From / To (date mode) – Alternative fixed date window.
Confidence (%) – 90 / 95 / 99 / Custom (uses z≈t).
Custom Z (t) – Override the quantile if desired.
Prediction bands – Use wider prediction envelope instead of mean CI.
Shade region + colors / opacity / line width.
Usage
To mimic ShareScope exactly, pick the same date span (use date mode) and set Confidence 99%.
Choose Prediction OFF for a tighter “confidence” look; ON for a wider, more permissive channel.
If ShareScope used High as source, set Source = High here as well.
Notes & limitations
TradingView does not expose the visible viewport to Pine. The script cannot auto-read “displayed data.” Use last N bars or date range.
Bands are parallel by design. Prices may close outside; the channel does not bend.
Window capped at 5,000 bars for performance. No alerts are emitted.
Differences vs TV’s native tools
Linear Regression (drawing) – manual object; no statistical sizing or shading.
Linear Regression Channel (indicator) – uses price standard deviations around the regression; width is a user stdev multiple.
This script – uses residual error of the OLS fit and a z/t quantile to size a statistically meaningful parallel channel.
Changelog
r3.1 – Guard fix (no return at top level), minor refactor, stable line updates.
r3 – Switched to single-fit OLS with parallel constant-width bands (ShareScope look).
(Earlier experimental builds r1–r2.2 implemented rolling/tapered CI; superseded.)
Disclaimer: Educational use only. Not investment advice.

Dynamic Volume Trace Profile [ChartPrime]⯁ OVERVIEW
Dynamic Volume Trace Profile is a reimagined take on volume profile analysis. Instead of plotting a static horizontal histogram on the side of your chart, this indicator projects dynamic volume trace lines directly onto the price action. Each bin is color-graded according to its relative strength, creating a living “volume skeleton” of the market. The orange trace highlights the current Point of Control (POC)—the price level with maximum historical traded volume within the lookback window. On the right side, the tool builds a mini profile, showing absolute volume per bin alongside its percentage share, where the POC always represents 100% strength .
⯁ KEY FEATURES
Dynamic On-Chart Bins:
The range between highest high and lowest low is split into 25 bins. Each bin is drawn as a horizontal trace line across the lookback chart period.
Gradient Color Encoding:
Trace lines fade from transparent to teal depending on relative volume size. The more intense the teal, the stronger the historical traded activity at that level.
Automatic POC Highlight:
The bin with the highest aggregated volume is flagged with an orange line . This POC adapts bar-by-bar as volume distribution shifts.
Right-Side Volume Profile:
At the chart’s right edge, the script prints a box-style profile. Each bin shows:
• Total volume (absolute units).
• Percentage of max volume, in parentheses (POC bin = 100%).
This gives both raw and normalized context at a glance.
Adjustable Lookback Window:
The lookback defines how many bars feed the profile. Increase for stable HTF zones or decrease for responsive intraday distributions.
POC Toggle & Styling:
Optionally toggle POC highlighting on/off, adjust colors, and set line thickness for better integration with your chart theme.
⯁ HOW IT WORKS (UNDER THE HOOD)
Step Sizing:
over last 100 bars is divided by to calculate bin height.
Volume Aggregation:
For each bar in the , the script checks which bin the close falls into, then adds that bar’s volume to the bin’s counter.
Gradient Mapping:
Bin volume is normalized against the max volume across all bins. That value is mapped onto a gradient from transparent → teal.
POC Logic:
The bin with highest volume is colored orange both on the dynamic trace and in the right-side profile.
Right-Hand Profile:
Boxes are drawn for each bin proportional to volume / maxVolume × 50 units, with text labels showing both absolute volume and normalized %.
⯁ USAGE
Use the orange trace as the dominant “magnet” level—price often gravitates to the POC.
Watch for clusters of strong teal traces as areas of high acceptance; thin or faint zones mark low-liquidity gaps prone to fast moves.
On intraday charts, tighten lookback to reveal session-based distributions . For swing or position trading, expand lookback to surface more durable volume shelves.
Compare the right-side profile % to judge how “top-heavy” or “bottom-heavy” the current distribution is.
Use bright, intense color traces as context for confluence with structure, OBs, or liquidity hunts.
⯁ CONCLUSION
Dynamic Volume Trace Profile takes the traditional volume profile and fuses it into the body of price itself. Instead of a fixed sidebar, you see gradient traces layered directly on the chart, giving real-time context of where volume concentrated and where price may be drawn. With built-in POC highlighting, normalized % readouts, and an adaptive right-side profile, it offers both precision levels and market structure awareness in a cleaner, more intuitive form.

Pivot Trend Flow [BigBeluga]🔵 OVERVIEW
Pivot Trend Flow turns raw swing points into a clean, adaptive trend band. It averages recent pivot highs and lows to form two dynamic reference levels; when price crosses above the averaged highs, trend flips bullish and a green band is drawn; when it crosses below the averaged lows, trend flips bearish and a red band is drawn. During an uptrend the script highlights breakouts of previous pivot highs with ▲ labels, and during a downtrend it flags breakdowns of previous pivot lows with ▼ labels—making structure shifts and continuation signals obvious.
🔵 CONCEPTS
Pivot-Based Averages : Recent pivot highs/lows are collected and averaged to create smoothed upper/lower reference levels.
if not na(ph)
phArray.push(ph)
if not na(pl)
plArray.push(pl)
if phArray.size() > avgWindow
upper := phArray.avg()
phArray.shift()
if plArray.size() > avgWindow
lower := plArray.avg()
plArray.shift()
Trend State via Crosses : Close above the averaged-highs ⇒ bullish trend; close below the averaged-lows ⇒ bearish trend.
Trend Band : A colored band (green/red) is plotted and optionally filled to visualize the active regime around price.
Structure Triggers :
In bull mode the tool watches for prior pivot-high breakouts (▲).
In bear mode it watches for prior pivot-low breakdowns (▼).
🔵 FEATURES
Adaptive Trend Detection from averaged pivot highs/lows.
Clear Visuals : Green band in uptrends, red band in downtrends; optional fill for quick read.
Breakout/Breakdown Labels :
▲ marks breaks of previous pivot highs in uptrends
▼ marks breaks of previous pivot lows in downtrends
Minimal Clutter : Uses compact lines and labels that extend only on confirmation.
Customizable Colors & Fill for trend states and band styling.
🔵 HOW TO USE
Pivot Length : Sets how swing points are detected. Smaller = more reactive; larger = smoother.
Avg Window (pivots) : How many recent pivot highs/lows are averaged. Increase to stabilize the band; decrease for agility.
Read the Band :
Green band active ⇒ prioritize longs, pullback buys toward the band.
Red band active ⇒ prioritize shorts, pullback sells toward the band.
Trade the Triggers :
In bull mode, ▲ on a prior pivot-high break can confirm continuation.
In bear mode, ▼ on a prior pivot-low break can confirm continuation.
Combine with Context : Use HTF trend, S/R, or volume for confluence and to filter signals.
Fill Color Toggle : Enable/disable band fill to match your chart style.
🔵 CONCLUSION
Pivot Trend Flow converts swing structure into an actionable, low-lag trend framework. By blending averaged pivots with clean breakout/breakdown labels, it clarifies trend direction, timing, and continuation spots—ideal as a core bias tool or a confirmation layer in any trading system.

Swing T3 Ribbon with Dynamic Bandswing T3 Ribbon with Dynamic Bands
This indicator combines T3 moving averages with a dynamic Bollinger-style ribbon to highlight early trend changes and volatility-driven price moves.
Key Features:
T3 Ribbon: Fast T3 vs. Slow T3 shows trend direction; ribbon color is green for bullish, red for bearish.
Dynamic Bands: Bands fluctuate with recent price volatility, similar to Bollinger Bands, providing a visual guide for overbought/oversold areas.
Early Swing Markers:
E0 (Early Upswing): Price above top band while trend is temporarily bearish.
Ex (Early Downswing): Price below bottom band while trend is temporarily bullish.
Alerts:
Early upswing (E0)
Early downswing (Ex)
Price crossing the bottom (red) band from below.
Purpose:
Helps traders detect early trend reversals or price breakouts in the context of volatility.
Dynamic bands adapt to changing market conditions, giving a more responsive signal than fixed-width ribbons.
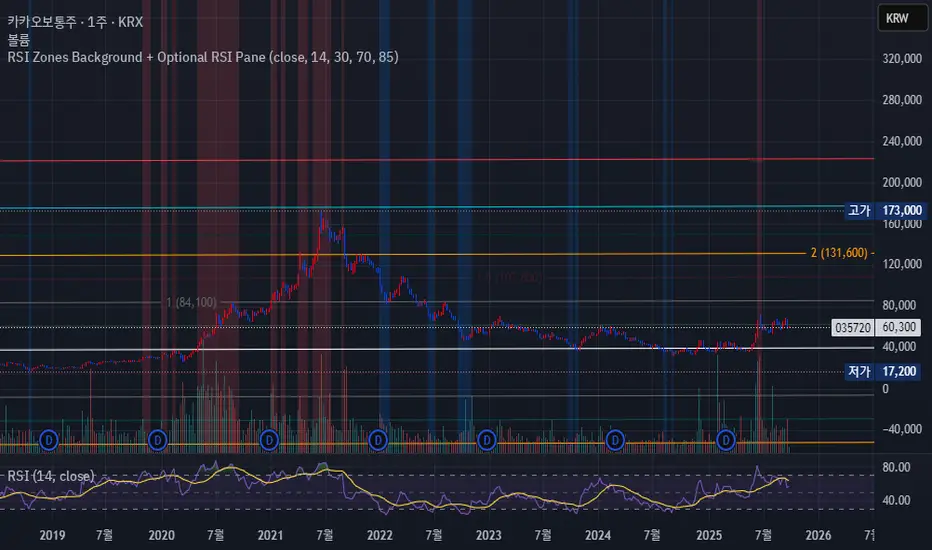
RSI Zones Background + Optional RSI PaneOverview
This Pine Script indicator does two things at once:
Colors the background of the main price chart whenever the RSI value is below a lower threshold (default 30) or above an upper threshold (default 70). This highlights oversold and overbought zones directly on the price chart itself.
Optionally displays a separate RSI panel with the RSI line and shaded region between the two threshold levels for reference.
The indicator is fully customizable through the settings panel—color choices, transparency, and whether to show the separate RSI pane can all be adjusted.
Key Parts of the Code
1. Inputs
src: The source price series for RSI calculation.
len: RSI lookback length (default 14).
lowerThr and upperThr: The lower and upper thresholds (defaults: 30 and 70).
lowColor and highColor: Colors for the background when RSI is below or above the thresholds.
bgTrans: Transparency level for the background shading.
showRSI: Boolean to toggle the optional RSI pane on or off.
2. RSI Calculation
rsi = ta.rsi(src, len)
This computes the RSI from the chosen price source.
3. Background Coloring on the Price Chart
bgCol = rsi <= lowerThr ? color.new(lowColor,bgTrans) :
rsi >= upperThr ? color.new(highColor,bgTrans) :
na
bgcolor(bgCol)
If RSI ≤ lower threshold: background turns lowColor (oversold zone).
If RSI ≥ upper threshold: background turns highColor (overbought zone).
Otherwise, no background color.
4. Optional RSI Pane
plot(showRSI ? rsi : na, display=display.pane)
Plots the RSI line in a separate pane when showRSI is true; otherwise hides it.
5. Horizontal Lines for Thresholds
hLower = hline(lowerThr, ...)
hUpper = hline(upperThr, ...)
Two horizontal lines at the lower and upper thresholds.
Because hline() can’t be wrapped inside if blocks, the script always creates them but makes them transparent (using na color) when the pane is hidden.
6. Filling Between Threshold Lines
fill(hLower, hUpper, color=showRSI ? color.new(color.gray,95) : na)
When the RSI pane is visible, the area between the two threshold lines is shaded in gray to create a “mid-zone” effect. This fill also switches off (becomes na) if the pane is hidden.
7. Alerts
The script also includes two alert conditions:
When RSI crosses below the lower threshold.
When RSI crosses above the upper threshold.
How It Works in Practice
On the price chart, you’ll see the background turn blue (or your chosen color) when RSI is ≤30, and red when RSI is ≥70.
If you enable “Show RSI” in the settings, a separate RSI pane will appear below the price chart, plotting the RSI line with two threshold lines and a shaded region in between.
You can fully adjust transparency and colors to suit your chart style.
Benefits
Quickly visualize overbought and oversold conditions without opening a separate RSI window.
Optional RSI pane provides context when needed.
Customizable colors and transparency make it easy to integrate with any chart theme.
Alerts give you automatic notifications when RSI crosses key levels.
------------------------------------------------------------------------------------------------------------------
개요
이 지표는 두 가지 기능을 동시에 수행합니다.
가격 차트 뒤 배경에 색상 표시
RSI 값이 설정한 하단 임계값(기본 30) 이하이거나 상단 임계값(기본 70) 이상일 때, 가격 차트 뒤쪽에 과매도·과매수 구간을 색으로 표시해줍니다.
선택적으로 RSI 보조창 표시
옵션을 켜면 별도의 RSI 패널이 나타나서 RSI 라인과 두 임계값(30, 70)을 연결한 구간을 음영 처리하여 보여줍니다.
설정 창에서 색상·투명도·보조창 표시 여부를 전부 조정할 수 있습니다.
코드 핵심 설명
1. 입력값
src: RSI 계산에 사용할 가격 소스(기본 종가).
len: RSI 기간(기본 14).
lowerThr / upperThr: RSI 하단·상단 임계값(기본 30, 70).
lowColor / highColor: RSI가 각각 하단 이하·상단 이상일 때 배경 색상.
bgTrans: 배경 투명도(0=불투명, 100=투명).
showRSI: RSI 보조창을 켜고 끌 수 있는 스위치.
2. RSI 계산
rsi = ta.rsi(src, len)
지정한 가격 소스를 기반으로 RSI를 계산합니다.
3. 가격 차트 배경 색칠
bgCol = rsi <= lowerThr ? color.new(lowColor,bgTrans) :
rsi >= upperThr ? color.new(highColor,bgTrans) :
na
bgcolor(bgCol)
RSI ≤ 하단 임계값 → lowColor(과매도 색)
RSI ≥ 상단 임계값 → highColor(과매수 색)
나머지 구간은 색상 없음.
4. 선택적 RSI 보조창
plot(showRSI ? rsi : na, display=display.pane)
showRSI가 켜져 있으면 RSI 라인을 보조창에 표시하고, 꺼져 있으면 숨깁니다.
5. 임계값 가로선
hLower = hline(lowerThr, ...)
hUpper = hline(upperThr, ...)
하단·상단 임계값을 가로선으로 표시합니다.
hline은 if 블록 안에서 쓸 수 없기 때문에 항상 그려지지만, 보조창이 꺼지면 색을 na로 처리해 안 보이게 합니다.
6. 임계값 사이 영역 음영 처리
fill(hLower, hUpper, color=showRSI ? color.new(color.gray,95) : na)
보조창이 켜져 있을 때만 두 가로선 사이를 회색으로 채워 “중립 구간”을 강조합니다.
7. 알림 조건
RSI가 하단 임계값을 아래로 돌파할 때 알림.
RSI가 상단 임계값을 위로 돌파할 때 알림.
실제 작동 모습
가격 차트 뒤쪽에 RSI ≤30이면 파란색, RSI ≥70이면 빨간색 배경이 나타납니다(색상은 설정에서 변경 가능).
RSI 보조창을 켜면, RSI 라인과 임계값 가로선, 그리고 그 사이 음영 영역이 함께 나타납니다.
투명도를 높이거나 낮추어 강조 정도를 조절할 수 있습니다.
장점
별도의 RSI창을 열지 않고도 가격 차트 배경만으로 과매수·과매도 상태를 직관적으로 확인 가능.
필요하면 보조창으로 RSI를 직접 확인하면서 임계값 가이드와 음영 영역을 함께 볼 수 있음.
색상·투명도를 자유롭게 조절할 수 있어 차트 스타일에 맞게 커스터마이징 가능.
RSI가 임계값을 돌파할 때 자동 알림을 받을 수 있음.
Opening Candle Zone with ATR Bands by nkChartsThis indicator highlights the opening range of each trading session and projects dynamic ATR-based zones around it.
Key Features
Plots high and low levels of the opening candle for each new daily session.
Extends these levels across the session, providing clear intraday support and resistance zones.
Adds ATR-based offset bands above and below the opening range for volatility-adjusted levels.
Customizable colors, ATR length, and multiplier for flexible use across markets and timeframes.
Adjustable session history limit to control how many past levels remain on the chart.
How to Use:
The opening range high/low often acts as strong intraday support or resistance.
The ATR bands give an adaptive volatility buffer, useful for breakout or mean-reversion strategies.
Works on any market with clear session opens.
This tool is designed for traders who want to combine session-based price action with volatility insights, helping identify potential breakouts, reversals, or consolidation areas throughout the day.
⚠️ Disclaimer: This indicator is for educational purposes only. It does not provide financial advice or guarantee profits. Always perform your own analysis before making trading decisions.

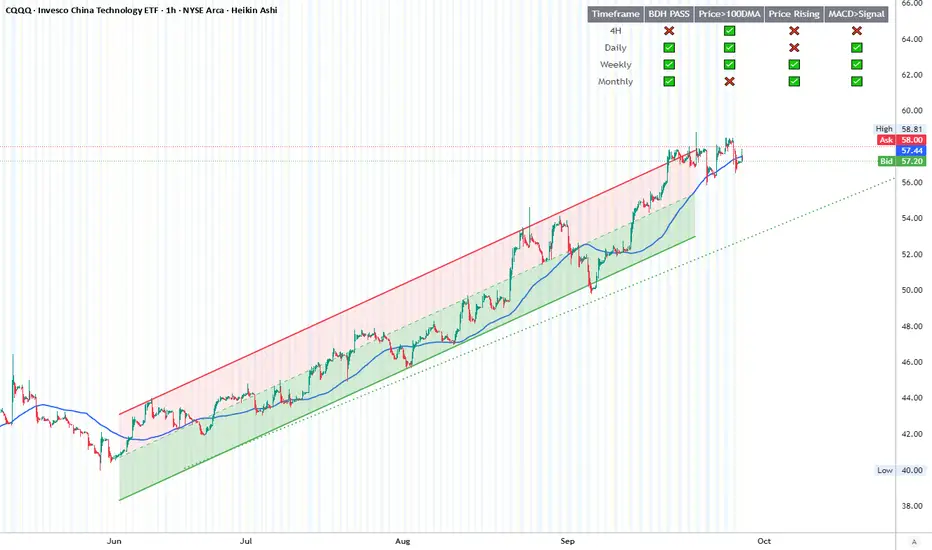
BDH Multi‑Timeframe Dashboard 📊 BDH Multi-Timeframe Dashboard (4H, D, W, M)
The Buy Don’t Hold (BDH) Screener is inspired by the book Buy—Don’t Hold by Leslie N. Masonson. It is designed to rotate into the strongest ETFs during bullish phases while stepping aside in weak markets.
✅ How It Works
The screener evaluates three filters across multiple timeframes (4H, Daily, Weekly, Monthly):
Price > 100-DMA
Price Rising (close > lookback)
MACD > Signal
Each timeframe earns a PASS if at least 2 out of 3 conditions are met.
🖥️ Features
Multi-timeframe dashboard table with green/red checks
🚀 Strategy Application
Scan for ETFs with multi-timeframe PASS signals
Buy the strongest performers
Rotate out when an ETF falls out of strength ranking
This rotation method is designed to historically outperform passive SPY holding by maintaining exposure only to strong, trending ETFs
📌 ETFs Watchlist (copy-paste ready)
Use this watch list for screening :
ARKF, ARKG, ARKK, ARKQ, ARKW, ASHR, BATT, BLCN, BLOK, CLOU, CQQQ, EEM, EMQQ, ESPO, HACK, IBUY, ICVT, IWM, IZRL, KWEB, MDY, OGIG, PBW, PRNT, QCLN, QQQ, REMX, SMH, SOCL, SPY, TAN, TLT, URA, VB, XBI, XHB, XLC, XLE, XLF, XLY, XOP, XRT
✨ With this dashboard, traders can quickly identify ETFs that meet the BDH conditions across multiple timeframes, helping them follow a disciplined rotation strategy.