McMillan Volatility Bands w/ Buy & Sell Signals [optstrategist]BACKGROUND
McMillan Volatility Bands are an alternative approach to John Bollinger's "Bollinger Band" study and developed by world-renowned options trader and author Lawrence G. McMillan. Given his background in options trading, it was natural for Lawrence to approach any volatility-based study in the same manner options are priced --using Black-Scholes model. This model of pricing assumes a financial asset's volatility should be measured in percentage change rather than absolute value change.
OVERVIEW
The McMillan Volatility Bands indicator for TradingView will plot the 3 and 4-standard deviation bands around a 20-day moving average. This is how Larry has always used this system. The user can, however, change the standard deviation value as well as the moving average length to their preferred setting. This indicator can be used on any asset and on any timeframe.
Furthermore, the indicator will plot buy and sell signals based on a trading system used by Larry in his flagship newsletter publication The Daily Strategist. The system gives a signal when price closes outside the 4-sigma band and then closes back within the 3-sigma band. That 'signal bar' will be colored red or green for a sell or buy signal setup, respectively.
Finally, an arrow will be plotted on the chart where the system would actually enter the trade. This is determined when price trades a little beyond the extreme of the 'signal bar'. The level by which price has to go beyond the 'signal bar' is an input parameter and can be adjusted by the user. We've chosen the default value of 0.34. This means, the indicator will not give a buy or sell entry until the price moves: 1/3 x beyond the extreme signal bar. This is to prevent getting whipsawed by some setups that never really move in your favor. We've found it successfully removes the less-valuable trade setups.
PARAMETERS
ma_length => length of the moving average that the volatility bands work off of
outside_sigma => standard deviation of outer volatility band
inside_sigma => standard deviation of inner volatility band
entry_trigger_cushion => this refers to the percentage of the signal bar's range. The default value is 0.34. This means price will need to move 1/3 (~34%) of the signal bar's range beyond the high (for a buy) or low (for a sell) of the signal bar to trigger a buy/sell entry. This entry plots the arrow on the chart. We have found requiring this extra move in price eliminates many of the less-desirable signals at the expense of entering the better signals a little later.
WANT TO PURCHASE OR NEED MORE INFORMATION ON McMILLAN VOLATILITY BANDS?
Visit the link below to see purchasing options as well as screenshots of the indicator and how we trade it at McMillan Analysis Corp.
布林帶(BB)

Bollinger Channels / EMA and SMAThis is written as a system to replace the BB strategy.
I think it will work well.
It looks pretty stylish.
Description / Usage:
Adjust the length and multiplier based on your location with Bollinger Bands.
The multiplier of 1 provides you with a basic channel with high and low-source EMA (or SMA).
And with the 8-day exponential moving average, you can observe short entries and exits.
I wish good luck to the friends who will use it.
You can support and track new indicators.
Bu, BB stratejisinin yerini alacak bir sistem olarak yazılmıştır.
Oldukça şık görünüyor.
Kullanım
Bollinger Bantları ile bulunduğunuz yere göre uzunluk ve çarpanı ayarlayın.
1 çarpanı size yüksek ve düşük kaynaklı EMA (veya SMA) içeren temel bir kanal sağlar.
Ve 8 günlük üstel hareketli ortalama ile kısa giriş ve çıkışları gözlemleyebilirsiniz.
Kullanacak arkadaşlara bol kazançlar diliyorum.
Yeni indikatör için destek olabilir ve takip edebilirsiniz.

Mean Reversion w/ Bollinger BandsThis is a more advanced version of my original mean reversion script.
It employs the famous Bollinger Bands.
This robot will buy when price falls below the lower Bollinger Band, and sell when price moves above the upper Bollinger Band.
I've only tested it on the S&P 500, though you could try it out on other assets to see the backtest performance.
During the recent COVID-19 bear market drop, it produced several buy signals on the S&P which I followed, and made some nice gains so far.
I still think this would make a better investing strategy (buy undervalued / sell over-valued), rather than a trading strategy.
I use this robot for my long term portfolio.

Better Bollinger BandsIt is a highly configurable Bollinger Bands implementation.
You can choose different moving averages: EMA, SMA, WMA, VWMA, RMA (Wilder's EMA), ZLEMA, HMA (Hull MA), ALMA
Select between standard or mean deviation
You can use "High" or "Low" for upper and lower bands, which makes them much better for dynamic support-resistance
You can shift (offset) right the bands to use it as support and resistance in the future

Bollinger Bands Fibonacci Ratios (Automatic Timeframe)A Fibonacci Bollinger Bands indicator with automatic timeframe detection.
The timeframe reverts to the value specified in settings when viewing Daily, Monthly or seconds-based charts.
Based on: Bollinger Bands Fibonacci ratios by Shizaru (/script/bCy9urOG-Bollinger-Bands-Fibonacci-ratios/)

PS3X BB CompanionTo be used as a visual tool alongside "Profit Sniper 3.0" Indicator to allow you to identify suitable exit points for trades relating to price crossing Bollinger Bands, example use is on the 30 minute chart to identify bullish or bearish trends to guide lower timeframe trading plays.
Send me a PM to get access.

PS3X BB CompanionPS3X BB Companion indicator to use ideally on higher timeframes (HTF) to alert on trend changes and potential trade exits.
To be used as a visual tool alongside "Profit Sniper 3.0" Indicator to allow you to identify suitable exit points for trades relating to price crossing Bollinger Bands, example use is on the 30 minute chart to identify bullish or bearish trends to guide lower timeframe trading plays.
Send me a PM to get access.

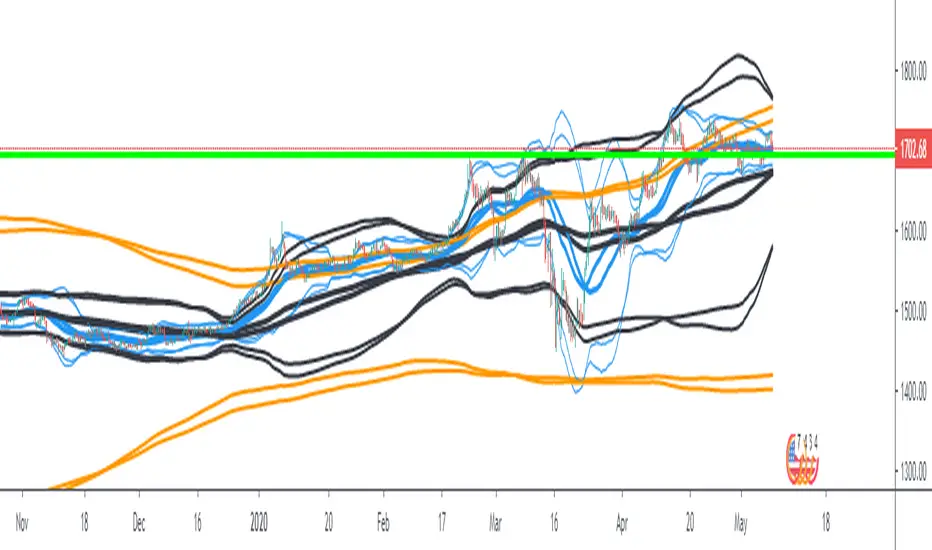
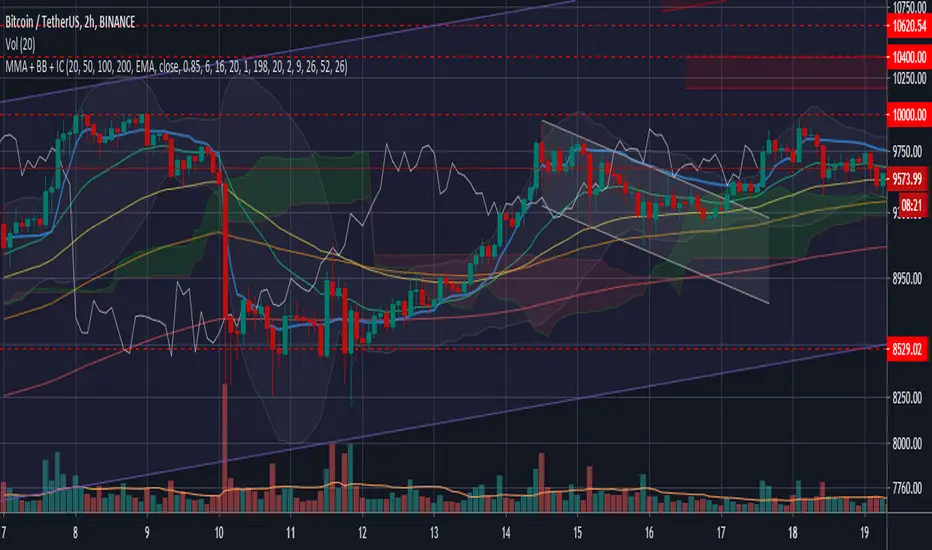
Multiple MA + Bollinger bands + Ichimoku cloudThis is an extension of my previous script 'Multiple MA', now featuring also an Ichimoku Cloud and Bollinger bands.
More, I added more functionality to the integrated Bollinger bands script, that by default use only Standard Moving Average to plot the bands. With this script you can plot Bollinger bands using the MA you prefer from the ones included in the 'Multiple MA' script (SMA, EMA, WMA, VWMA and Hull MA), allowing you to better fit your preferences.
About Ichimoku cloud I choose to enable by default only the cloud and the lagged price, which I consider the most useful components of this indicator, however you can enable each component from the settings.
I tried to make 3 indicators fit well with each other using some graphical customization (It works quite well with dark background). However keep in mind that i made this script as much customizable as possible, letting you enable and disable each one of the components from the plot. So you can take advantage of the whole indicators, and in case, clean the plot when you feel it's too much full of drawings and lines.
Please show me your support if you like the script, and find it useful, thanks!
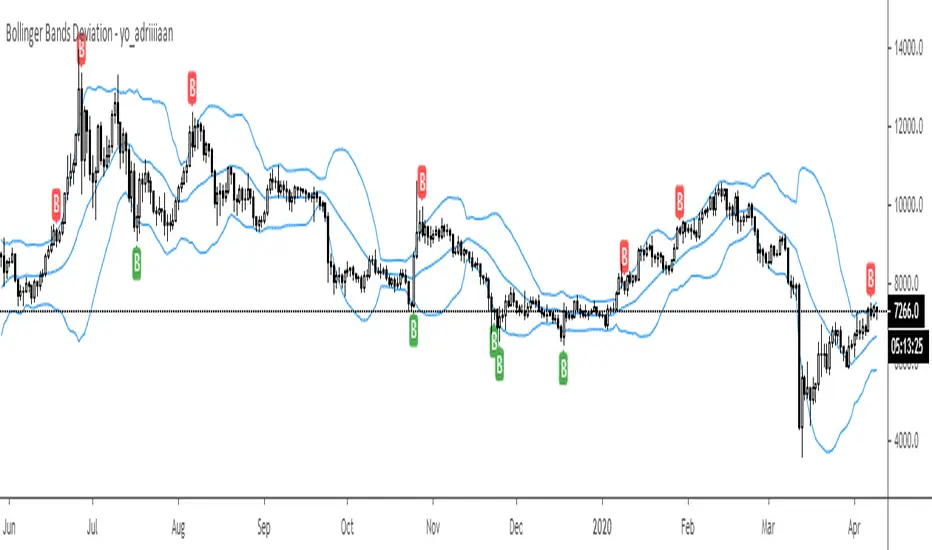
Bollinger Bands Deviation - yo_adriiiiaanBollinger Band Deviations
In theory price trades within 2 standard deviations 95% of the time. This is an attempt to capture that 5% that deviates from the bands.
Useful for taking profit or signaling a reversal.
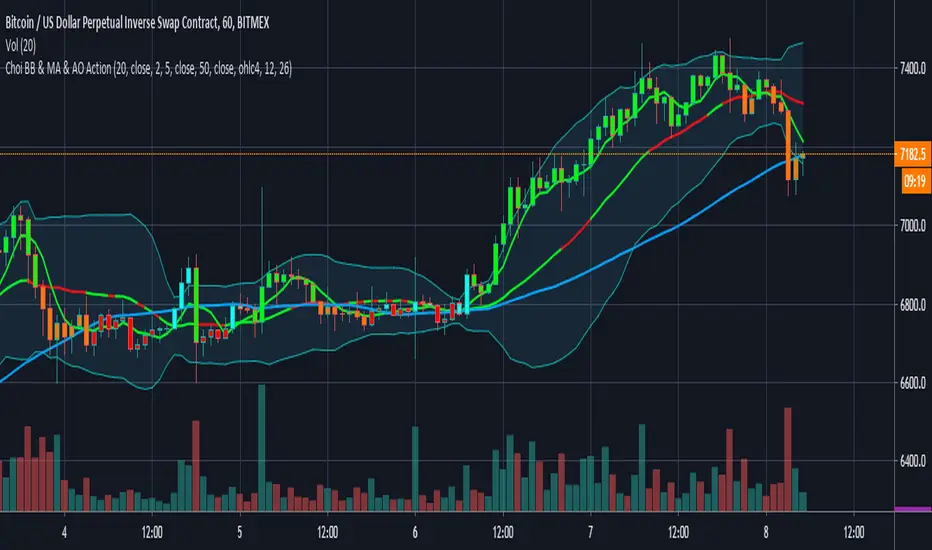
Choi Bollinger Band, Moving average, Awesome Oscillator Action Combine Bollinger Band signal with Awesome Oscillator signal by changing the baseline of signal Bollinger Band as well to show trading status.
This also includes 5-day and 50-day Moving average signals and the color change of candles To show trading status.
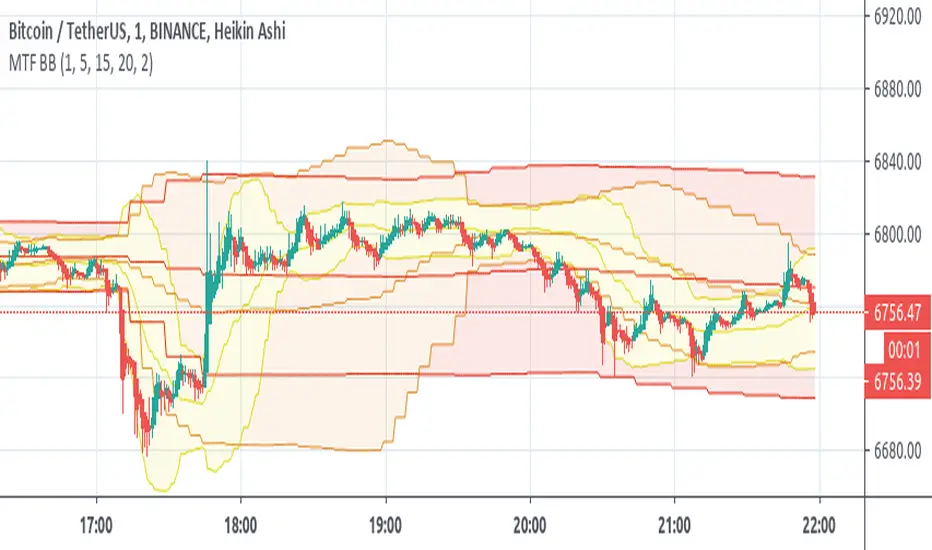
Multi-TimeFrame Bollinger BandsScript which plot multi-timeframe bollinger bands, up to 3 different timeframes. It is intended to show higher timeframe bands on a smaller timeframe. Default options are 1m, 5m and 15m and used on a 1m chart for crypto-currencies.
It can be used to get a better overview of the current trend.
Bollinger Bands Plus [xdecow]Bollinger bands with the option to use different types of moving averages.
-SMA
-EMA
-RMA
-WMA
-VWMA
-SWMA
-DEMA
-HMA
-SMMA
-T3
-TEMA

Mean Absolute Deviation BandsThe other way to build bands around price that uses Mean Absolute Deviation instead of Standard Deviation.
MAD is also a measure of variability, but less frequently used. MAD is better for use with distributions other than the Gaussian.
MAD is always less than or equal to Standard Deviation and the resulting bands are more tighter for the same parameters if we compare it to Bollinger Bands.
If you use band stops this can be useful.

(JS) Squeeze Pro OverlaysSo this was something I planned on doing in the future, I knew it would take some time to put together but here it is, the Squeeze Pro 2 Overlays.
On my original Squeeze Pro, I had made several overlay indicators to go along with it, this time my goal was to combine all that stuff into a single indicator and allow the user to turn on and off the specific features they'd prefer to use. The version illustrated in the preview has everything turned on. What is "everything"? Here's the breakdown...
First of all - the color schemes in the Squeeze Pro match the color schemes in the Overlays indicator, so you can match them up (Color Scheme 3 in example). There are 6 schemes, option 1 is the original Squeeze colors.
There's also an option to make the light squeeze black, rather than white. This is for people who aren't using Dark Mode. It will flip all white to black, to make your charts better to read!
So there are 4 main overlays that can be switched on and off with this indicator, they include;
1. Early Signal Candles
2. BBMA Basis Line
3. Bollinger Bands/Keltner Channel Breaches
4. Signal Arrows
Early Signal Candles
The Early Signal Candles have two parameters, the entry smoothing period and the exit smoothing period.
There is a different type of early entry signal for each type of squeeze.
Low Squeeze generates white dots on the highs of the candles.
Mid Squeeze generates a lime green candle (or purple candle in color scheme 3).
High Squeeze generates a bigger purple circle on the high of the candle.
These three signals are made to mimic the original Early In/Out Candles from John Carter and represent the same thing (they work the same way).
As for the early exit, that would be determined by the color of the candle vs the color of the squeeze, works the same way as the original as well.
BBMA Basis Line
The BBMA (Bollinger Bands Momentum Average) was a moving average I had made to use with the squeeze on the previous version.
It is the basis line of the BB and KC used to make up the Squeeze (a 20 SMA). There are 4 different colors to it on this version.
1. Orange - This means no squeeze.
2. White/Black - Low Squeeze
3. Red - Mid Squeeze
4. Yellow - High Squeeze
You'll also notice these colors are light and dark in different spots - this is a representation of whether the Bollinger Bands are expanding or contracting. Dark means expanding, light means contracting.
Bollinger Bands/Keltner Channel Breaches
This is a pretty simple feature. If there is an ongoing squeeze, and a candle closes above or below the Bollinger Bands or Keltner Channels, a circle appears at the top or the bottom of the chart telling you which way the channel has been breached.
Signal Arrows
This is what makes up most of the overlay indicator. If you turn it on, the default is set to work just like the original. There are lots of options with this though.
First, you can turn each type of Squeeze Arrow on or off by checking/unchecking the boxes for them.
Now allow me to explain the "Signal Length", as there are several options.
The default is "6 Dots", this generates a signal when a particular type of Squeeze reaches the 6th dot ("12 Dots" works the same way).
"End of Squeeze" generates a signal once a type of Squeeze has concluded.
"End of Early Signal" generates a signal when the early dots (or candle) finishes.
"Custom" allows you to select your own dot duration to produce a signal, you select that number in the field below.
The other portion of this is the "Signal Type", this is where you select how each signal is generated once the selected amount of time takes place.
The default is the same as the original "+/-", this generates a signal based on whether Squeeze momentum is positive or negative.
"Rising/Falling" will only generate a signal if the Squeeze momentum maintains consistently over the last 6 bars.
"Crossed Zero" only generates a signal if the Squeeze momentum crosses above or below the zero line.
"Basis Line Momentum" is based on the BBMA. A signal is generated based on whether the current candle closes above or below the basis line.
"Divergence" only generates a signal if there is a divergence signal present at the time of the signal.
"Current Momentum" generates a signal based simply on the current direction of Squeeze momentum.
"Sum of Change" generates a signal based on the sum of the change in the Squeeze momentum being positive (long) or negative (short) over the length of time you select in the "Sum of Change Length" field.
Then "Combo" tries to take a look at everything and generates a score based on these parameters. Positive score = long, negative = short.
I hope I gave a detailed enough explanation on how everything works, let me know if you have any questions! Hope you like it!

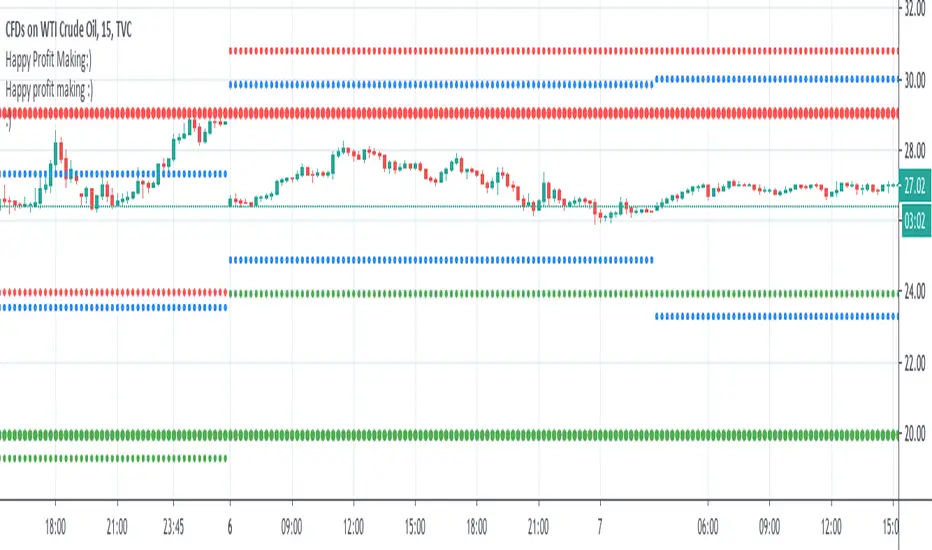
mtf b zonesThese zones helps to do intraday, short term & long term. The blue lines are for intraday. The small green and red dotted lines are for weekly. The large green and red dotted lines are for monthly. use this along with price action trading. Best wishes. Thank you....
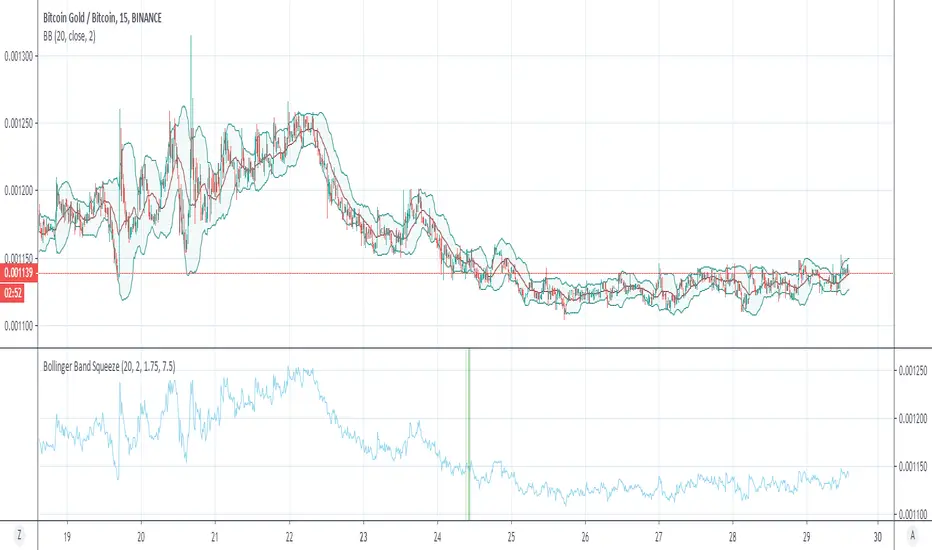
Bollinger Band SqueezeThe Bollinger Band Squeeze is calculated according to the ATR. With the default settings. If the BB width is smaller than the ATR * 2 the background is painted green. If the BB width is larger than the ATR * 5 the background is painted red
Day Trading Alert 01 by silenThunderrWorks on 1m TF or Tick Data
// Alert Condition for the Script are as follow :-
// EMA 10 crosses EMA 20 from bottom
// Close Price above VWAP
// Close price above Supertrend & +ve
// RSI > 60
For going LONG on Stocks when ALL conditions satisfy
Have to manually activate on each stocks on which Alerts is required.

Keltner | Bollinger | SqueezePercent B (%B), it's derivation Percent K (%K) and squeeze indicator combined in one.
blue line = bollinger %
orange line = keltner %
red background = squeeze*
squeeze = bollinger bands are inside (encapsulated by) keltner channel

Stochastic %BIt's a Stochastic indicator combined with Bollinger %B. This way you just need to check if it is above 1.0 or below 0.0 (Outside Bollinger Bands).

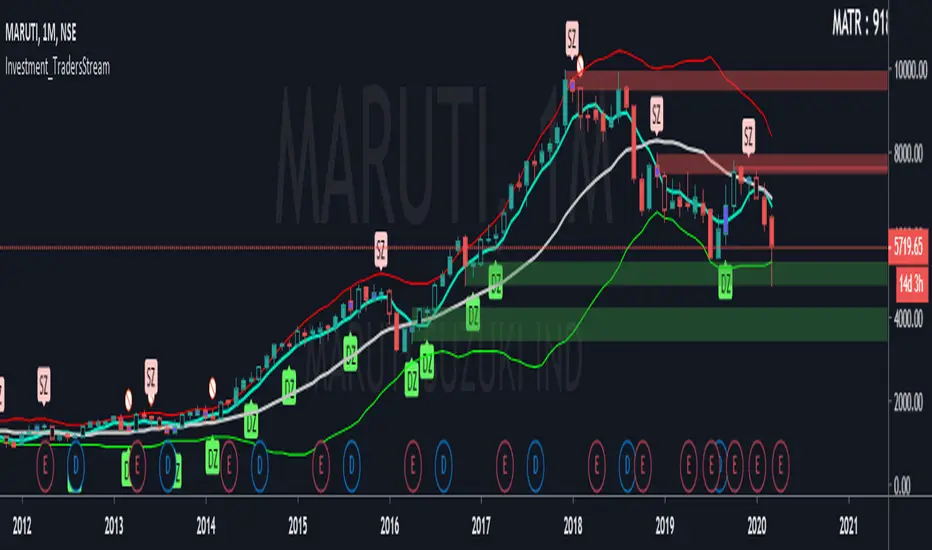
Investment_TradersStreamHello Guys here we are introducing another important tool, in that you can anticipate when to enter Market for Long term Investment and when to Exit you Positions from Long term Investments. We introduced some of uniq indicators that helps to calculate the Risk. Those are Exhaust Candle, Time or Price correction of stock after a strong movement special Moving average to calculate monthly Trend and one of the popular indicator to know that how much movement happened in a stock from a mean line (Bollinger Band). Please comment below for any information.......
Rsi, Ema , Ma and Bollinger Bands for 1 min BtcusdtThis is for 1 min Btcusdt pair.
I am tring to find a way to catch %1 ups and downs.
Basicly it buys when rsi low and minute candle closes under ema,ma and lower bollinger band,
it sells when candle goes over upper bb,low ma, when rsi high.
It sells when rsi high ,candle closes over upper bb,over low ma and does the opposite when buying.
I know it's crowded but still tring to learn what to do ^^
I welcome any suggestions to improve.
It works better with shorts for now.
Don't buy with this !! You might lose big !

Full Candle Outside BB [Bishnu103]Bollinger band defines volatility range based on the current market condition. If a full candle is created outside BB then it is highly volatile and it may reverse to the mean, i.e. middle BB.
Buy - when a green candle is created below lower BB (alert candle) and price goes above high of it.
Buy SL - low of alert candle
Target 1 - middle band
Target 2- upper band
Sell - when a red candle is cerated above upper BB (alert candle) and price goes below low of it
Sell SL - high of alert candle
Target 1 - middle band
Target 2 - lower band
************************************************************************************************************************************************************************************
Disclaimer: This is in-progress strategy. I plan to work further and improve this. So please use this in the live market very carefully and based on your own risk factors.
************************************************************************************************************************************************************************************

Bollinger Bands Ema 50,200,800EMAs converted to Bollinger Bands The bands are 50, 200 and 800 period, forming a strategy and having clear trends and stronger supports and resistances (when the lines converge the area is stronger).