RSI - 5UP Overview
The "RSI - 5UP" indicator is a versatile tool that enhances the traditional Relative Strength Index (RSI) by adding smoothing options, Bollinger Bands, and divergence detection. It provides a clear visual representation of RSI levels with customizable bands and optional moving averages, helping traders identify overbought/oversold conditions and potential trend reversals through divergence signals.
Features
Customizable RSI: Adjust the RSI length and source to fit your trading style.
Overbought/Oversold Bands: Visualizes RSI levels with intuitive color-coded bands (red for overbought at 70, white for neutral at 50, green for oversold at 30).
Smoothing Options: Apply various types of moving averages (SMA, EMA, SMMA, WMA, VWMA) to the RSI, with optional Bollinger Bands for volatility analysis.
Divergence Detection: Identifies regular bullish and bearish divergences, with visual labels ("Bull" for bullish, "Bear" for bearish) and alerts.
G radient Fills: Highlights overbought and oversold zones with gradient fills (green for overbought, red for oversold).
How to Use
1. Add to Chart: Apply the "RSI - 5UP" indicator to any chart. It works well on timeframes from 5 minutes to daily.
2. Configure Settings:
RSI Settings:
RSI Length: Adjust the period for RSI calculation (default: 14).
Source: Choose the price source for RSI (default: close).
Calculate Divergence: Enable to detect bullish/bearish divergences (default: disabled).
Smoothing:
Type: Select the type of moving average to smooth the RSI ("None", "SMA", "SMA + Bollinger Bands", "EMA", "SMMA (RMA)", "WMA", "VWMA"; default: "SMA").
Length: Set the period for the moving average (default: 14).
BB StdDev: If "SMA + Bollinger Bands" is selected, adjust the standard deviation multiplier for the bands (default: 2.0).
3.Interpret the Indicator:
RSI Levels: The RSI line (purple) oscillates between 0 and 100. Levels above 70 (red band) indicate overbought conditions, while levels below 30 (green band) indicate oversold conditions. The 50 level (white band) is neutral.
Gradient Fills: The background gradients (green above 70, red below 30) highlight overbought and oversold zones for quick reference.
Moving Average (MA): If enabled, a yellow MA line smooths the RSI. If "SMA + Bollinger Bands" is selected, green bands appear around the MA to show volatility.
Divergences: If "Calculate Divergence" is enabled, look for "Bull" (green label) and "Bear" (red label) signals:
Bullish Divergence: Indicates a potential upward reversal when the price makes a lower low, but the RSI makes a higher low.
Bearish Divergence: Indicates a potential downward reversal when the price makes a higher high, but the RSI makes a lower high.
4. Set Alerts:
Use the "Regular Bullish Divergence" and "Regular Bearish Divergence" alert conditions to be notified when a divergence is detected.
Notes
The indicator does not provide direct buy/sell signals. Use the RSI levels, moving averages, and divergence signals as part of a broader trading strategy.
Divergence detection requires the "Calculate Divergence" option to be enabled and may not work on all timeframes or assets due to market noise.
The Bollinger Bands are only visible when "SMA + Bollinger Bands" is selected as the smoothing type.
Credits
Developed by Marrulk. Enjoy trading with RSI - 5UP! 🚀
布林帶(BB)

NexAlgo AI with Dynamic TP/SLThe NexAlgo Indicator combines a Gaussian kernel regression engine with adaptive volatility thresholds to generate clear, data‑driven trade signals and built‑in risk levels. It predicts the next bar’s price relative to a simple moving average, then measures the average deviation between actual and forecasted values to form dynamic bands. Breakouts beyond these bands, aligned with the prediction’s direction, produce buy or sell signals directly on your chart.
How It Works & What You’ll See
Kernel Regression Forecast: A rolling “lookback” window builds a Gaussian similarity matrix of recent prices. This matrix is used to project the next price, smoothing around a moving average.
Adaptive Volatility Bands: The indicator computes the mean absolute error between actual and predicted prices, multiplies it by your chosen volatility factor, and plots upper and lower bands.
Signal Triggers: When price closes above the upper band while the prediction is rising, a green “BUY” label appears; when price closes below the lower band as the forecast falls, a red “SELL” label is shown.
Automatic SL/TP Levels: After each signal, the script scans recent swing highs/lows and applies an ATR buffer. Stop‑loss is set conservatively at the more protective of these levels, while take‑profit is calculated by your reward‑to‑risk ratio and capped near the opposite swing extreme.
Customizable Inputs
Lookback Period & Smoothing: Adjust how many bars the regression and volatility calculations use, and tune the noise regularization to suit fast or slow markets.
Volatility Multiplier: Widen or tighten the adaptive bands to control signal frequency and confidence.
Swing Lookback & ATR Options: Define how far back the indicator searches for swing points, and choose between ATR calculation methods.
Reward‑to‑Risk Ratio: Set your preferred multiple of stop‑loss distance for take‑profit targets.
What Makes NexAlgo Different
Hybrid Statistical Approach: Unlike fixed‑period moving averages or standard regression, the Gaussian kernel adapts locally to evolving price patterns and regimes.
Self‑Adjusting Thresholds: Volatility bands derive from prediction errors—so they expand in choppy markets and contract in trending conditions.
Integrated Risk Controls: Automatically calculated stop‑loss and take‑profit levels remove manual guesswork, yet remain grounded in both ATR and price structure.
Trader‑Driven Flexibility: Every parameter—from lookback length to risk ratio—can be dialed in for scalping, swing trading, or longer‑term strategies.
Getting Started
• Apply NexAlgo to your preferred timeframe (5–15 min for intraday scalps, 1 h–4 h for swings, daily for position plays).
• Begin with default settings and gradually adjust lookback and smoothing to balance responsiveness versus noise.
• Experiment with volatility multipliers: tighten in strong trends, widen when markets churn.
• Backtest different ATR buffers and reward ratios to discover your ideal risk‑reward profile.

Visualisation tendancesThis script allows you to visualize the current trend of a financial asset.
It has two colors:
- Green for bullish phases
- Red for bearish phases
This allows you to instantly position yourself in the direction of the trend.
It also integrates Bollinger Bands, a volatility indicator.
This allows you to display two different indicators in a single indicator.

Pino Trend Pack (SMA/EMA + Bollinger)🔹 Pino Trend Pack is a compact trend-following and volatility indicator that includes:
📈 Moving Averages:
- SMA 10, SMA 30
- EMA 21, EMA 55, EMA 89
(All configured for short-term to mid-term trend analysis by default, but fully adjustable for user preference.)
📊 Bollinger Bands:
- Period: 20
- Standard Deviation: 2.0
- Includes Upper Band, Lower Band, and Basis (SMA 20)
This pack is designed for traders who want a clean visual of price dynamics across multiple short-term trend layers, combined with volatility tracking. It helps you identify compression, expansion, and trend shifts at a glance.
🧠 Ideal for swing trading, short- to mid-term setups, or as a supporting tool in any confluence-based strategy.

Daily Bollinger Band StrategyOverview of the Daily Bollinger Band Strategy
1. Strategy Overview and Features
This strategy is a tool for backtesting a trading method that uses Bollinger Bands. It is *not* a tool for automated trading.
1-1. Main Display Items
The main chart displays the Bollinger Bands and the 200-day moving average.
It also shows the entry and exit points along with the position size (in units of 100 shares).
1-2. Summary of Trading Rules
For long (buy) strategies, the trade enters when the price crosses above the +1σ line of the Bollinger Bands, aiming to ride an upward trend. The position is exited when the price crosses below the middle band.
For short (sell) strategies, the trade enters when the price crosses below the -1σ line of the Bollinger Bands, aiming to ride a downward trend. The position is exited when the price crosses above the middle band.
1-3. Strategic Enhancements
The strategy uses the slope of the 200-day moving average to determine the trend direction and enter trades accordingly. This improves the win rate and payoff ratio.
Additionally, to reduce the probability of ruin, the risk per trade is limited to 1.0% of capital, and position sizing is adjusted using ATR (a volatility indicator).
2. Trading Rules
2-1. Chart Type
Only daily charts are used.
2-2. Indicators Used
(1) Bollinger Bands** (used for entry and exit signals)
- Period: Fixed at 80 days
- Upper and lower bands: Fixed at ±1σ
(2) Moving Average** (used to determine trend direction)
- Period: Fixed at 200 days
- Trend direction is judged based on whether the difference from the previous day is positive (upward) or negative (downward)
2-3. Buy Rules
Setup:
- Price crosses above the +1σ line from below
- Both the middle band and 200-day moving average are upward sloping
Entry:
- Buy at the next day’s market open using a market order
Exit:
- If the price crosses below the middle band, sell at the next day’s open using a market order
2-4. Sell Rules
Setup:
- Price crosses below the -1σ line from above
- Both the middle band and 200-day moving average are downward sloping
Entry:
- Sell at the next day’s market open using a market order
Exit:
- If the price crosses above the middle band, buy back at the next day’s open using a market order
2-5. Risk Management Rules
- Risk per trade: 1.0% of total capital (acceptable loss = capital × 1.0%)
- Position size: Acceptable loss ÷ 2ATR (rounded down to the nearest unit of 100 shares)
2-6. Other Notes
- No brokerage fees
- No pyramiding
- No partial exits
- No reverse positions (no “stop-and-reverse” trades)
3. Strategy Parameters
The following settings can be specified:
3-1. Period Settings
- Start date: Set the start date for the backtest period
- Stop date: Set the end date for the backtest period
3-2. Display of Trend and Signals
- Show trend: When checked, the background color of the bars is light red for an uptrend and light blue for a downtrend
- Show signal: When checked, entry and exit signals are displayed (note: signals are executed at the next day’s open, so there is a one-day lag in the display)
3-3. Capital Management Settings
- Funds: Capital available for trading (in JPY)
- Risk rate: Specify what percentage of the capital to risk per trade
Settings in the “Properties” tab are not used in this strategy.
4. Backtest Results (Example)
Here are the backtest results conducted by the author:
- Target Stocks: All components of the Nikkei 225
- Test Period: January 4, 2000 – December 30, 2024
- Data Points: 12,886
- Win Rate: 33.45%
- Net Profit: ¥82,132,380
- Payoff Ratio: 2.450
- Expected Value: ¥6,373.8
- Risk Rate: 1.0%
- Probability of Ruin: 0.00%
---
デイリー・ボリンジャーバンド・ストラテジーの概要
1. ストラテジーの概要と特徴
このストラテジーは、ボリンジャーバンドを使ったトレード手法のバックテストを行うツールです。自動売買を行うツールではありません。
1-1. 主な表示項目
メインチャートにボリンジャーバンドと 200日移動平均線を表示します。
また、エントリーと手仕舞いのタイミングと数量(100株単位)も表示されます。
1-2. トレードルールの概要
買い戦略の場合、ボリンジャーバンドの +1σ 超えでエントリーして上昇トレンドに乗り、ミドルバンドを割ったら決済します。
売り戦略の場合、ボリンジャーバンドの -1σ 割りでエントリーして下降トレンドに乗り、ミドルバンドを上抜けたら決済します。
1-3. ストラテジーの工夫点
200日移動平均線の傾きを見てトレンド方向にエントリーをしています。こうして勝率とペイオフレシオの成績を向上しています。
また、破産確率を抑えるために、リスク資金比率を 1.0% にして、ATR(ボラティリティ指標) を使って注文数を調整しています。
2. 売買ルール
2-1. 使用するチャート
日足チャートに限定します
2-2. 使用する指標
(1) ボリンジャーバンド(仕掛けと手仕舞いのシグナルに使用)
期間は80日に固定
上下バンドは ±1σ に固定
(2) 移動平均線(トレンドの方向を見るために使用)
期間は200日に固定
移動平均の値の前日との差がプラスのとき上向き、マイナスのとき下向きと判断
2-3. 買いのルール
セットアップ:ボリンジャーバンドの +1σ を価格が下から上に交差 かつ ミドルバンドと 200日移動平均線が上向き
仕掛け:翌日の寄り付きに成行で買う
手仕舞い:ボリンジャーバンドのミドルバンドを価格が上から下に交差したら、翌日の寄り付きに成行で売る
2-4. 売りのルール
セットアップ:ボリンジャーバンドの -1σ を価格が上から下に交差 かつ ミドルバンドと 200日移動平均線が下向き
仕掛け:翌日の寄り付きに成行で売る
手仕舞い:ボリンジャーバンドのミドルバンドを価格が下から上に交差したら、翌日の寄り付きに成行で買い戻す
2-5. 資金管理のルール
リスク資金比率:資産の 1.0%(許容損失 = 資産 × 1.0%)
注文数:許容損失 ÷ 2ATR(単元株数未満は切り捨て)
2-6. その他
仲介手数料:なし
ピラミッディング:なし
分割決済:なし
ドテン:しない
3. ストラテジーのパラメーター
次の項目が指定できます。
3-1. 期間の設定
Staer date : バックテストの検証期間の開始日を指定します
Stop date : バックテストの検証期間の終了日を指定します
3-2. トレンドとシグナルの表示
Show trend : チェックを入れると、バーの背景色が、トレンドが上昇のときは薄い赤で、下落のときは薄い青で表示されます
Show signal : チェックを入れると、エントリーと手仕舞いのシグナルを表示します(シグナルの出た翌日の寄り付きに売買をするので表示に1日のずれがあります)
3-3. 資金管理用の設定
Funds : トレード用の資金(円)
Risk rate : 許容損失を資金の何%にするかで指定します
「プロパティタブ」で設定する値は、このストラテジーでは有効ではありません。
4. バックテストの結果(例)
作者がバックテストを実施した結果をお知らせします。
対象銘柄:日経225構成銘柄すべて
対象期間:2000年1月4日~2024年12月30日
データ件数:12,886
勝率:33.45%
純利益:82,132,380
ペイオフレシオ:2.450
期待値:6,373.8
リスク資金比率:1.0%
破産確率:0.00%

ATLAS Reversion Bands v2 [EMA % Spread]🧠 About the ATLAS Reversion Bands v2
I created this indicator to answer a simple question:
"When is price extended too far from trend, and likely to revert?"
The ATLAS Reversion Bands measure the percentage spread between a fast and slow EMA (default 25/200) and track how far that spread moves from its historical average using z-score and standard deviation bands—essentially building a Bollinger Band system on top of EMA distance.
Instead of relying on traditional oscillators like RSI or MACD, this tool is purely math-driven and tailored for spotting overextensions across any asset.
🔍 What It Does
Tracks the normalized spread between EMA 25 and EMA 200
Highlights statistically rare zones using ±2 and ±3 standard deviation bands
Plots BUY/SELL triangle markers only on first entry into extreme zones
Helps identify mean reversion opportunities (deep pullbacks or FOMO tops)
📈 How to Use It
Wait for the spread to hit or exceed ±2.5 or ±3 standard deviations
Look for confirmation via price structure, candles, or volume
Best used on spot or perp markets with healthy liquidity
Ideal for swing trading or narrative-based rotational setups
🕐 Recommended Timeframes
1H, 4H, and 1D are optimal
Use MTF mode to apply daily logic on lower timeframes (e.g., see 1D exhaustion while trading 4H)
Works across:
✅ BTC, ETH, Majors
✅ Meme coins (better on 1H/4H)
✅ Market indexes (TOTAL2, BTC.D, etc.)
📌 Pro Tips
Raise the Z-score alert threshold for stricter signals (e.g., 3.0 for only the wildest extensions)
Use with other confluence tools (like S/R, candles, or RSI)
Not designed for chasing trends — this is a fade-the-hype, buy-the-blood kind of tool

BB Breakout + Momentum Squeeze [Strategy]This Strategy is Based on 3 free indicators
- Bollinger Bands Breakout Oscillator: Link
- TTM Squeeze Pro: Link
- Rolling ATR Bands: Link
Bollinger Bands Breakout Oscillator - This tool shows how strong a market trend is by measuring how often prices move outside their normal Bollinger bands range. It helps you see whether prices are strongly moving in one direction or just moving sideways. By looking at how much and how frequently prices push beyond their typical boundaries, you can identify which direction the market is heading over your selected time period.
TM Squeeze Pro - This is a custom version of the TTM Squeeze indicator.
It's designed to help traders spot consolidation phases in the market (when price is coiling or "squeezing") and to catch breakouts early when volatility returns. The logic is based on the relationship between Bollinger Bands and Keltner Channels, combined with a momentum oscillator to show direction and strength.
Rolling ATR Bands - This indicator combines volatility bands (ATR) with momentum and trend signals to show where the market might be breaking out, retesting, or trending. It's highly visual and helpful for traders looking to time entries/exits during trending or volatile moves.
Logic Of the Strategy:
We are going to use the Bollinger Bands Breakout to determine the direction of the market. Than check the Volatility of the price by looking at the TTM Squeeze indicator. And use the ATR Bands to determine dynamic Stop Losses and based on the calculate the Take Profit targets and quantity for each position dynamically.
For the Long Setup:
1. We need to see the that Bull Power (Green line of the Bollinger Bands Breakout Oscilator) is crossing the level of 50.
2. Check the presence of volatility (Green dot based on the TTM Squeeze indicator)
For the Short Setup:
1. We need to see the that Bear Power (Red line of the Bollinger Bands Breakout Oscilator) is crossing the level of 50.
2. Check the presence of volatility (Green dot based on the TTM Squeeze indicator)
Stop Loss is determined by the Lower ATR Band (for the Long entry) and Upper ATR Band (For the Short entry)
Take Profit is 1:1.5 risk reward ration, which means if the Stop loss is 1% the TP target will be 1.5%
Move stop Loss to Breakeven: If the price will go in the direction of the trade for at least half of the Risk Reward target then the stop will automatically be adjusted to the entry price. For Example: the Stop Loss is 1%, the price has move at least 0.5% in the direction of your trade and that will move the Stop Loss level to the Entry point.
You can Adjust the parameters for each indicator used in that script and also adjust the Risk and Money management block to see how the PnL will change.

Reversal Trading Bot Strategy[BullByte]Overview :
The indicator Reversal Trading Bot Strategy is crafted to capture potential market reversal points by combining momentum, volatility, and trend alignment filters. It uses a blend of technical indicators to identify both bullish and bearish reversal setups, ensuring that multiple market conditions are met before entering a trade.
Core Components :
Technical Indicators Used :
RSI (Relative Strength Index) :
Purpose : Detects divergence conditions by comparing recent lows/highs in price with the RSI.
Parameter : Length of 8.
Bollinger Bands (BB) :
Purpose : Measures volatility and identifies price levels that are statistically extreme.
Parameter : Length of 20 and a 2-standard deviation multiplier.
ADX (Average Directional Index) & DMI (Directional Movement Index) :
Purpose : Quantifies the strength of the trend. The ADX threshold is set at 20, and additional filters check for the alignment of the directional indicators (DI+ and DI–).
ATR (Average True Range) :
Purpose : Provides a volatility measure used to set stop levels and determine risk through trailing stops.
Volume SMA (Simple Moving Average of Volume ):
Purpose : Helps confirm strength by comparing the current volume against a 20-period average, with an optional filter to ensure volume is at least twice the SMA.
User-Defined Toggle Filters :
Volume Filter : Confirms that the volume is above average (or twice the SMA) before taking trades.
ADX Trend Alignment Filter : Checks that the ADX’s directional indicators support the trade direction.
BB Close Confirmation : Optionally refines the entry by requiring price to be beyond the upper or lower Bollinger Band rather than just above or below.
RSI Divergence Exit : Allows the script to close positions if RSI divergence is detected.
BB Mean Reversion Exit : Closes positions if the price reverts to the Bollinger Bands’ middle line.
Risk/Reward Filter : Ensures that the potential reward is at least twice the risk by comparing the distance to the Bollinger Band with the ATR.
Candle Movement Filter : Optional filter to require a minimum percentage move in the candle to confirm momentum.
ADX Trend Exit : Closes positions if the ADX falls below the threshold and the directional indicators reverse.
Entry Conditions :
Bullish Entry :
RSI Divergence : Checks if the current close is lower than a previous low while the RSI is above the previous low, suggesting bullish divergence.
Bollinger Confirmation : Requires that the price is above the lower (or upper if confirmation is toggled) Bollinger Band.
Volume & Trend Filters : Combines volume condition, ADX strength, and an optional candle momentum condition.
Risk/Reward Check : Validates that the trade meets a favorable risk-to-reward ratio.
Bearish Entry :
Uses a mirror logic of the bullish entry by checking for bearish divergence, ensuring the price is below the appropriate Bollinger level, and confirming volume, trend strength, candle pattern, and risk/reward criteria.
Trade Execution and Exit Strateg y:
Trade Execution :
Upon meeting the entry conditions, the strategy initiates a long or short position.
Stop Loss & Trailing Stops :
A stop-loss is dynamically set using the ATR value, and trailing stops are implemented as a percentage of the close price.
Exit Conditions :
Additional exit filters can trigger early closures based on RSI divergence, mean reversion (via the middle Bollinger Band), or a weakening trend as signaled by ADX falling below its threshold.
This multi-layered exit strategy is designed to lock in gains or minimize losses if the market begins to reverse unexpectedly.
How the Strategy Works in Different Market Conditions :
Trending Markets :
The ADX filter ensures that trades are only taken when the trend is strong. When the market is trending, the directional movement indicators help confirm the momentum, making the reversal signal more reliable.
Ranging Markets :
In choppy markets, the Bollinger Bands expand and contract, while the RSI divergence can highlight potential turning points. The optional filters can be adjusted to avoid false signals in low-volume or low-volatility conditions.
Volatility Management :
With ATR-based stop-losses and a risk/reward filter, the strategy adapts to current market volatility, ensuring that risk is managed consistently.
Recommendation on using this Strategy with a Trading Bot :
This strategy is well-suited for high-frequency trading (HFT) due to its ability to quickly identify reversal setups and execute trades dynamically with automated stop-loss and trailing exits. By integrating this script with a TradingView webhook-based bot or an API-driven execution system, traders can automate trade entries and exits in real-time, reducing manual execution delays and capitalizing on fast market movements.
Disclaimer :
This script is provided for educational and informational purposes only. It is not intended as investment advice. Trading involves significant risk, and you should always conduct your own research and analysis before making any trading decisions. The author is not responsible for any losses incurred while using this script.

Smart Mean Reversion DashboardThis indicator is designed to help traders identify potential mean reversion opportunities using a combination of Bollinger Bands, RSI, and deviation from the moving average. It provides a clean, visually appealing dashboard that displays key metrics and signals in real-time.
How to Read and Use:
Deviation from Mean:
Displays the percentage deviation of the current price from the moving average.
A high positive or negative deviation may indicate overextension and a potential mean reversion opportunity.
Bollinger Band Status:
Indicates whether the price is inside or outside the Bollinger Bands.
"Outside Upper" suggests overbought conditions, while "Outside Lower" suggests oversold conditions.
RSI Status:
Shows whether the RSI is in overbought (>70), oversold (<30), or neutral conditions.
Overbought and oversold levels can confirm potential reversal zones.
Signal:
BUY: Triggered when the price is outside the lower Bollinger Band and RSI is in the oversold zone.
SELL: Triggered when the price is outside the upper Bollinger Band and RSI is in the overbought zone.
WAIT: No clear signal; wait for better conditions.
Important Notes:
This is NOT a buy or sell recommendation. This indicator is a tool to assist in identifying potential trading opportunities. Always use it in conjunction with your own analysis and risk management.
The signals generated by this indicator are based on historical data and do not guarantee future performance.
It is recommended to use this indicator alongside other technical analysis tools and confirm signals with price action or other strategies.
Features:
Dashboard: Displays deviation, Bollinger Band status, RSI status, and signals in a clean, movable interface.
Customizable Settings: Adjust Bollinger Band length, RSI length, and moving average length to suit your trading style.
Visual Enhancements: Color-coded signals and metrics for easy interpretation in both light and dark modes.
Disclaimer:
Trading involves significant risk, and past performance is not indicative of future results. This indicator is for educational purposes only and should not be considered financial advice. Always consult with a financial advisor before making trading decisions.

Profit Trailing BBandsProfit Trailing Trend BBands v4.7.5 with Double Trailing SL
A TradingView Pine Script Strategy
Created by Kevin Bourn and refined with the help of Grok 3 (xAI)
Overview
Welcome to Profit Trailing Trend BBands v4.7.5, a dynamic trading strategy designed to ride trends and lock in profits with a unique double trailing stop-loss mechanism. Built for TradingView’s Pine Script v6, this strategy combines Bollinger Bands for trend detection with a smart trailing system that doubles down on profit protection. Whether you’re trading XRP or any other asset, this tool aims to maximize gains while keeping risk in check—all with a clean, visual interface.
What It Does
Identifies Trends: Uses Bollinger Bands to spot uptrends (price crossing above the upper band) and downtrends (price crossing below the lower band).
Enters Positions: Opens long or short trades based on trend signals, with customizable position sizing and leverage.
Trails Profits: Employs a two-stage trailing stop-loss:
Initial Trailing SL: Acts as a take-profit level, set as a percentage (%) or dollar ($) distance from the entry price.
Tightened Trailing SL: Once the initial profit target is hit, the stop-loss tightens to half the initial distance, locking in gains as the trend continues.
Manages Risk: Includes a margin call feature to exit losing positions before they blow up your account.
Visualizes Everything: Plots Bollinger Bands (blue upper, orange lower) and a red stepped trailing stop-loss line for easy tracking.
Why Built It?
Captures Trends: Bollinger Bands are a proven way to catch momentum, and we tuned them for responsiveness (short length, moderate multiplier).
Secures Profits: Traditional trailing stops often leave money on the table or exit too early. The double trailing SL first takes a chunk of profit, then tightens up to ride the rest of the move.
Stays Flexible: Traders can tweak price sources, stop-loss types (% or $), and position sizing to fit their style.
Looks Good: Clear visuals help you see the strategy in action without cluttering your chart.
Originally refined for XRP, it’s versatile enough for most markets — crypto, forex, stocks, you name it.
How It Works
Core Components
Bollinger Bands:
Calculated using a simple moving average (SMA) and standard deviation.
Default settings: 6-period length, 1.66 multiplier.
Upper Band (blue): SMA + (1.66 × StdDev).
Lower Band (orange): SMA - (1.66 × StdDev).
Trend signals: Price crossing above the upper band triggers a long, below the lower band triggers a short.
Double Trailing Stop-Loss:
Initial SL: Set via "Trailing Stop-Loss Value" (default 6% or $6). Trails the price at this distance and doubles as the first profit target.
Tightened SL: Once price hits the initial SL distance in profit (e.g., +6%), the SL tightens to half (e.g., 3%) and continues trailing, locking in gains.
Visualized as a red stepped line, only visible during active positions.
Position Sizing:
Choose "% of Equity" (default 30%) or "Amount in $" to set trade size.
Leverage (default 10x) amplifies positions, capped by available equity to avoid overexposure.
Margin Call:
Exits positions if drawdown exceeds the "Margin %" (default 10%) to protect your account.
Backtesting Filter:
Starts trading after a user-defined date (default: Jan 1, 2020) for focused historical analysis.
Trade Logic
Long Entry: Price crosses above the upper Bollinger Band → Closes any short position, opens a long.
Short Entry: Price crosses below the lower Bollinger Band → Closes any long position, opens a short.
Exit: Position closes when price hits the trailing stop-loss or triggers a margin call.
How to Use It
Setup
Add to TradingView:
Open TradingView, go to the Pine Editor, paste the script, and click "Add to Chart."
Ensure you’re using Pine Script v6 (the script includes @version=6).
Configure Inputs:
Start Date for Backtesting: Set the date to begin historical testing (default: Jan 1, 2020).
BB Length & Mult: Adjust Bollinger Band sensitivity (default: 6, 1.66).
BB Price Source: Choose the price for BBands (default: Close).
Trend Price Source: Choose the price for trend detection (default: Close).
Trailing Stop-Loss Type: Pick "%" or "$" (default: Trailing SL %).
Trailing Stop-Loss Value: Set the initial SL distance (default: 6).
Margin %: Define the max drawdown before exit (default: 10%).
Order Size Type & Value: Set position size as % of equity (default: 30%) or $ amount.
Leverage: Adjust leverage (default: 10x).
Run It:
Use the Strategy Tester tab to backtest on your chosen asset and timeframe.
Watch the chart for blue/orange Bollinger Bands and the red trailing SL line.
Tips for Traders
Timeframes: Works on any timeframe, but test 1H or 4H for XRP—great balance of signals and noise.
Assets: Optimized for XRP, but tweak slValue and mult for other markets (e.g., tighter SL for low-volatility pairs).
Risk Management: Keep marginPercent low (5-10%) for volatile assets; adjust leverage based on your risk tolerance.
Visuals: The red stepped SL line shows only during trades—zoom in to see its tightening in action.
Visuals on the Chart
Blue Line: Upper Bollinger Band (trend entry for longs).
Orange Line: Lower Bollinger Band (trend entry for shorts).
Red Stepped Line: Trailing Stop-Loss (shifts tighter after the first profit target).
Order Labels: Short tags like "OL" (Open Long), "CS" (Close Short), "LSL" (Long Stop-Loss), etc., mark trades.
Disclaimer
Trading involves risk. This strategy is for educational and experimental use—backtest thoroughly and use at your own risk. Past performance doesn’t guarantee future results. Not financial advice—just a tool from traders, for traders.

02 SMC + BB Breakout (Improved)This strategy combines Smart Money Concepts (SMC) with Bollinger Band breakouts to identify potential trading opportunities. SMC focuses on identifying key price levels and market structure shifts, while Bollinger Bands help pinpoint overbought/oversold conditions and potential breakout points. The strategy also incorporates higher timeframe trend confirmation to filter out trades that go against the prevailing trend.
Key Components:
Bollinger Bands:
Calculated using a Simple Moving Average (SMA) of the closing price and a standard deviation multiplier.
The strategy uses the upper and lower bands to identify potential breakout points.
The SMA (basis) acts as a centerline and potential support/resistance level.
The fill between the upper and lower bands can be toggled by the user.
Higher Timeframe Trend Confirmation:
The strategy allows for optional confirmation of the current trend using a higher timeframe (e.g., daily).
It calculates the SMA of the higher timeframe's closing prices.
A bullish trend is confirmed if the higher timeframe's closing price is above its SMA.
This helps filter out trades that go against the prevailing long-term trend.
Smart Money Concepts (SMC):
Order Blocks:
Simplified as recent price clusters, identified by the highest high and lowest low over a specified lookback period.
These levels are considered potential areas of support or resistance.
Liquidity Zones (Swing Highs/Lows):
Identified by recent swing highs and lows, indicating areas where liquidity may be present.
The Swing highs and lows are calculated based on user defined lookback periods.
Market Structure Shift (MSS):
Identifies potential changes in market structure.
A bullish MSS occurs when the closing price breaks above a previous swing high.
A bearish MSS occurs when the closing price breaks below a previous swing low.
The swing high and low values used for the MSS are calculated based on the user defined swing length.
Entry Conditions:
Long Entry:
The closing price crosses above the upper Bollinger Band.
If higher timeframe confirmation is enabled, the higher timeframe trend must be bullish.
A bullish MSS must have occurred.
Short Entry:
The closing price crosses below the lower Bollinger Band.
If higher timeframe confirmation is enabled, the higher timeframe trend must be bearish.
A bearish MSS must have occurred.
Exit Conditions:
Long Exit:
The closing price crosses below the Bollinger Band basis.
Or the Closing price falls below 99% of the order block low.
Short Exit:
The closing price crosses above the Bollinger Band basis.
Or the closing price rises above 101% of the order block high.
Position Sizing:
The strategy calculates the position size based on a fixed percentage (5%) of the strategy's equity.
This helps manage risk by limiting the potential loss per trade.
Visualizations:
Bollinger Bands (upper, lower, and basis) are plotted on the chart.
SMC elements (order blocks, swing highs/lows) are plotted as lines, with user-adjustable visibility.
Entry and exit signals are plotted as shapes on the chart.
The Bollinger band fill opacity is adjustable by the user.
Trading Logic:
The strategy aims to capitalize on Bollinger Band breakouts that are confirmed by SMC signals and higher timeframe trend. It looks for breakouts that align with potential market structure shifts and key price levels (order blocks, swing highs/lows). The higher timeframe filter helps avoid trades that go against the overall trend.
In essence, the strategy attempts to identify high-probability breakout trades by combining momentum (Bollinger Bands) with structural analysis (SMC) and trend confirmation.
Key User-Adjustable Parameters:
Bollinger Bands Length
Standard Deviation Multiplier
Higher Timeframe
Higher Timeframe Confirmation (on/off)
SMC Elements Visibility (on/off)
Order block lookback length.
Swing lookback length.
Bollinger band fill opacity.
This detailed description should provide a comprehensive understanding of the strategy's logic and components.
***DISCLAIMER: This strategy is for educational purposes only. It is not financial advice. Past performance is not indicative of future results. Use at your own risk. Always perform thorough backtesting and forward testing before using any strategy in live trading.***

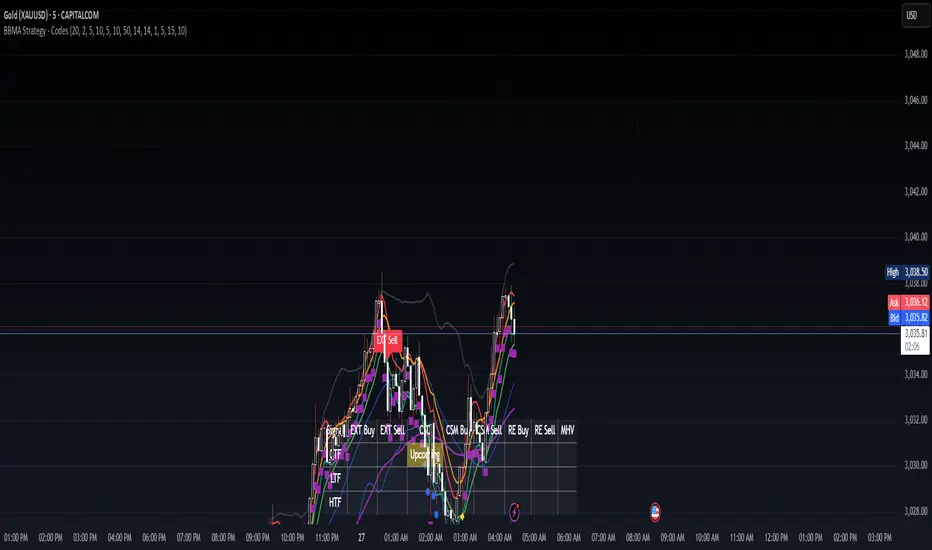
BBMA Strategy - EXT CSD CSM MHV RE CodesBINANCE:BTCUSD
Below is a detailed guide for using and interpreting the "BBMA Strategy - Enhanced EXT CSD CSM with Subplot" indicator. This guide is designed to be added to the description of the indicator when publishing it on TradingView. It provides clear instructions for users on how to apply the indicator, interpret its signals, and understand its features, including the multi-timeframe analysis and subplot table.
BBMA Strategy - Enhanced EXT CSD CSM with Subplot: User Guide
Overview
The "BBMA Strategy - Enhanced EXT CSD CSM with Subplot" is a comprehensive trading indicator built on the Bollinger Bands Moving Average (BBMA) framework. It combines multiple technical analysis tools—Bollinger Bands, Moving Averages (MAHI and MALO), EMA, ATR, volume analysis, RSI, MACD, market structure, and candlestick patterns—to identify high-probability trading setups. The indicator supports five key BBMA setups: EXT (Extreme), CSD (Consolidation), CSM (Continuation Setup Movement), RE (Re-Entry), and MHV (Market High Volatility).
This enhanced version includes:
Multi-Timeframe (MTF) Analysis: Confirms signals across a Lower Timeframe (LTF) and Higher Timeframe (HTF) for stronger trade validation.
Subplot Table: Displays signal status ("Active" or "Upcoming") and MTF confirmations in a clear table format.
Market Structure and Volume Filters: Incorporates Break of Structure (BOS), RSI divergence, and volume conditions to filter out low-probability trades.
Customizable Settings: Adjust Bollinger Bands, MA periods, timeframes, and more to suit your trading style.
This indicator is suitable for traders of all levels and can be used across various markets (e.g., forex, crypto, stocks) and timeframes (1M to 1D).
How to Use the Indicator
1. Add the Indicator to Your Chart
Open TradingView and load the chart of your chosen asset (e.g., BTCUSD, EURUSD, XAUUSD).
Go to the Pine Editor, paste the indicator code, and click "Add to Chart."
The indicator will overlay on your chart, displaying Bollinger Bands, Moving Averages, EMA, and signal labels. A subplot table will appear at the bottom of the chart.
2. Configure the Settings
The indicator provides customizable inputs to tailor it to your trading preferences. Access the settings by clicking the gear icon next to the indicator name on your chart:
Bollinger Bands Settings:
BB Period: Default is 20. Adjust the lookback period for Bollinger Bands.
BB Deviations: Default is 2. Adjust the standard deviation for the bands.
MAHI Settings (Moving Averages on High):
MAHI 5 Period: Default is 5. Period for the shorter MA on highs.
MAHI 10 Period: Default is 10. Period for the longer MA on highs.
MALO Settings (Moving Averages on Low):
MALO 5 Period: Default is 5. Period for the shorter MA on lows.
MALO 10 Period: Default is 10. Period for the longer MA on lows.
EMA Settings:
EMA Period: Default is 50. Adjust the period for the Exponential Moving Average.
ATR Settings:
ATR Period: Default is 14. Period for the Average True Range.
ATR SMA Period: Default is 14. Period for the ATR smoothing.
Timeframe Settings:
Minor HTF: Default is 1h. Select the minor higher timeframe for trend confirmation.
Major HTF: Default is 4h. Select the major higher timeframe for trend confirmation.
Lower TF for Confirmation: Default is 5m. Select the lower timeframe for signal confirmation.
Market Structure Settings:
Market Structure Lookback: Default is 10. Adjust the lookback period for swing highs/lows in market structure analysis.
3. Select Your Chart Timeframe
The indicator works on any timeframe from 1 minute (1M) to 1 day (1D).
For best results, align your chart timeframe (Current Timeframe, CTF) with the LTF and HTF settings:
Example: If CTF is 15m, set LTF to 5m and HTF to 1h or 4h.
This ensures proper multi-timeframe alignment for signal confirmation.
Indicator Components
Main Chart Elements
Bollinger Bands (BB): Plotted as three lines (upper, middle, lower) to identify volatility and potential reversal zones.
Upper Band: Blue line.
Middle Band: Black line (basis).
Lower Band: Blue line.
MAHI (Moving Averages on High): Two weighted moving averages on highs to detect trend direction.
MAHI 5: Green line.
MAHI 10: Lime line.
MALO (Moving Averages on Low): Two weighted moving averages on lows to confirm trend direction.
MALO 5: Red line.
MALO 10: Orange line.
EMA (50-period): Purple line to identify the overall trend.
Signal Labels: Appear on the chart when a setup is confirmed:
EXT Buy: Green upward arrow (reversal buy at BB lower band).
EXT Sell: Red downward arrow (reversal sell at BB upper band).
CSM Buy: Teal upward arrow (continuation buy above BB middle).
CSM Sell: Maroon downward arrow (continuation sell below BB middle).
RE Buy: Aqua upward arrow (re-entry buy between BB lower and middle).
RE Sell: Fuchsia downward arrow (re-entry sell between BB upper and middle).
MHV: Orange label (high volatility breakout after consolidation).
CSD: Yellow diamond (consolidation signal).
Subplot Table
Located at the bottom of the chart, the table summarizes signal status across three timeframes:
CTF (Current Timeframe): Shows "Active" (signal confirmed) or "Upcoming" (signal forming) for each setup.
LTF (Lower Timeframe): Displays a checkmark (✔) if the signal is confirmed on the LTF.
HTF (Higher Timeframe): Displays a checkmark (✔) if the signal is confirmed on the HTF.
Columns represent the five BBMA setups: EXT Buy, EXT Sell, CSD, CSM Buy, CSM Sell, RE Buy, RE Sell, and MHV.
Interpreting the Signals
1. EXT (Extreme) Setup
EXT Buy (Green Arrow):
Condition: Price touches or breaks below the BB lower band, closes above it, with high ATR volatility, strong volume, and additional confirmations (e.g., hammer candle, RSI oversold, MACD bullish, MAHI/MALO crossover, or bullish divergence).
Interpretation: A potential reversal buy signal. Look for confirmation in the subplot table (LTF and HTF rows).
Action: Consider a long position if LTF and HTF confirm (✔ in both rows). Use the BB middle or upper band as a target.
EXT Sell (Red Arrow):
Condition: Price touches or breaks above the BB upper band, closes below it, with high ATR volatility, strong volume, and additional confirmations (e.g., shooting star candle, RSI overbought, MACD bearish, MAHI/MALO crossunder, or bearish divergence).
Interpretation: A potential reversal sell signal.
Action: Consider a short position if LTF and HTF confirm. Use the BB middle or lower band as a target.
2. CSD (Consolidation) Setup
CSD (Yellow Diamond):
Condition: BB width is narrow (below its SMA), low ATR volatility, small candles, and no MAHI/MALO crossovers.
Interpretation: The market is consolidating, often preceding a breakout (e.g., MHV).
Action: Avoid trading during CSD unless preparing for an MHV breakout. Monitor the subplot for "Upcoming" MHV signals.
3. CSM (Continuation Setup Movement)
CSM Buy (Teal Arrow):
Condition: Price is above the BB middle, MAHI crossover, MALO crossover or MACD bullish, price above EMA 50, with additional confirmations (e.g., bullish engulfing or MACD bullish).
Interpretation: A continuation buy signal in an uptrend.
Action: Enter a long position if LTF and HTF confirm. Target the BB upper band or recent swing highs.
CSM Sell (Maroon Arrow):
Condition: Price is below the BB middle, MAHI crossunder, MALO crossunder or MACD bearish, price below EMA 50, with additional confirmations (e.g., bearish engulfing or MACD bearish).
Interpretation: A continuation sell signal in a downtrend.
Action: Enter a short position if LTF and HTF confirm. Target the BB lower band or recent swing lows.
4. RE (Re-Entry) Setup
RE Buy (Aqua Arrow):
Condition: Price is between the BB lower and middle bands, MAHI crossover, MALO crossover or MACD bullish, price above EMA 50, with additional confirmations (e.g., bullish engulfing or MACD bullish).
Interpretation: A re-entry buy signal after a pullback in an uptrend.
Action: Enter a long position if LTF and HTF confirm. Target the BB middle or upper band.
RE Sell (Fuchsia Arrow):
Condition: Price is between the BB upper and middle bands, MAHI crossunder, MALO crossunder or MACD bearish, price below EMA 50, with additional confirmations (e.g., bearish engulfing or MACD bearish).
Interpretation: A re-entry sell signal after a pullback in a downtrend.
Action: Enter a short position if LTF and HTF confirm. Target the BB middle or lower band.
5. MHV (Market High Volatility) Setup
MHV (Orange Label):
Condition: Follows a CSD signal, with expanding BB width, high ATR volatility, strong volume, and MAHI/MALO crossover or crossunder.
Interpretation: A breakout signal after consolidation, indicating high volatility and potential for a strong move.
Action: Trade in the direction of the breakout (e.g., buy if MAHI crossover, sell if MAHI crossunder). Confirm with LTF and HTF. Target significant levels like recent swing highs/lows.
6. Multi-Timeframe Confirmation
LTF Confirmation: A checkmark (✔) in the LTF row indicates the signal is also present on the lower timeframe (e.g., 5m). This adds confidence to the trade.
HTF Confirmation: A checkmark (✔) in the HTF row indicates alignment with the higher timeframe trend (e.g., 4h). This confirms the signal's strength.
Strongest Signals: Look for signals with both LTF and HTF confirmations (✔ in both rows). These have the highest probability of success.
7. Upcoming Signals
The CTF row in the subplot table may show "Upcoming" for a setup (e.g., EXT Buy: Upcoming). This indicates the setup is forming but not yet confirmed.
Action: Monitor these setups closely. They may turn "Active" on the next candle if conditions are met.
Trading Tips
Trend Alignment: Use the EMA 50 and market structure (is_uptrend) to ensure trades align with the overall trend. For example, prioritize CSM Buy signals in an uptrend.
Risk Management:
Set stop-losses below recent swing lows (for buys) or above recent swing highs (for sells).
Use the BB middle or opposite band as a target for most setups.
Avoid Overtrading: Focus on signals with LTF and HTF confirmations to filter out noise.
Timeframe Selection:
Scalping: Use 1m or 5m CTF with 1m LTF and 15m HTF.
Day Trading: Use 15m or 1h CTF with 5m LTF and 4h HTF.
Swing Trading: Use 4h or 1D CTF with 1h LTF and 1D HTF.
Backtesting: Test the indicator on historical data for your chosen asset and timeframe to understand its performance.
Alerts
The indicator includes built-in alerts for each setup:
EXT Buy/Sell: Triggers when an EXT signal is confirmed.
CSD: Triggers during consolidation.
CSM Buy/Sell: Triggers for continuation signals.
RE Buy/Sell: Triggers for re-entry signals.
MHV: Triggers for high volatility breakouts. To set up alerts:
Right-click on the chart and select "Add Alert."
Choose the condition (e.g., "BBMA EXT Buy").
Set your preferred notification method (e.g., email, SMS).
Limitations
Lagging Indicators: The indicator uses moving averages and other lagging tools, which may delay signals in fast-moving markets.
False Signals: Like all indicators, it can produce false signals, especially in choppy markets. Use LTF/HTF confirmations to filter trades.
Timeframe Dependency: Ensure your CTF, LTF, and HTF are properly aligned to avoid conflicting signals.
Fib BB on VWMA*ATRThis TradingView Pine Script is designed to plot Fibonacci Bollinger Bands on a Volume Weighted Moving Average (VWMA) using the Average True Range (ATR). The script takes a higher timeframe (HTF) approach, allowing traders to analyze price action and volatility from a broader market perspective.
🔹 How It Works
Higher Timeframe Data Integration
Users can select a specific timeframe to calculate the VWMA and ATR.
This allows for a more macro perspective, avoiding the noise of lower timeframes.
Volume Weighted Moving Average (VWMA)
Unlike the Simple Moving Average (SMA), VWMA gives higher weight to price movements with larger volume.
Calculation Formula:
𝑉𝑊𝑀𝐴=∑(𝐶𝑙𝑜𝑠𝑒×𝑉𝑜𝑙𝑢𝑚𝑒) / ∑𝑉𝑜𝑙𝑢𝑚𝑒
Since VWMA accounts for volume, it is more reactive to price zones with high buying or selling activity, making it useful for identifying liquidity zones.
ATR-Based Fibonacci Bollinger Bands
The Average True Range (ATR) is used to measure market volatility.
Instead of standard deviation-based Bollinger Bands, Fibonacci multipliers (2.618, 3.0, 3.414) are applied to ATR.
These bands adjust dynamically with market volatility.
🔹 Key Findings from Exploration
Through testing and analysis, this indicator seems to effectively detect supply and demand zones, particularly at the Fibonacci levels of 2.618 to 3.414.
Price frequently reacts at these bands, indicating that they capture key liquidity zones.
Potential Order Block Detection:
The ends of the Fibonacci Bollinger Bands (especially at 2.618, 3.0, and 3.414) tend to align with order blocks—areas where institutional traders previously accumulated or distributed positions.
This is particularly useful for order flow traders who focus on unfilled institutional orders.
🔹 How to Use This Indicator?
Identifying Order Blocks
When price reaches the upper or lower bands, check if there was a strong reaction (rejection or consolidation).
If price rapidly moves away from a band, that level might be an order block.
Spotting Liquidity Pools
VWMA’s nature enhances liquidity detection since it emphasizes high-volume price action.
If a price level repeatedly touches the band without breaking through, it suggests institutional orders may be absorbing liquidity there.
Trend Confirmation
If VWMA is trending upwards and price keeps rejecting the lower bands, it confirms a strong bullish trend.
Conversely, constant rejection from the upper bands suggests a bearish market.
This script is designed for open-source publication and offers traders a refined approach to detecting order blocks and liquidity zones using Fibonacci-based volatility bands.
📌 한글 설명 (상세 설명)
이 트레이딩뷰 파인스크립트는 거래량 가중 이동평균(VWMA)과 평균 실제 범위(ATR)를 활용하여 피보나치 볼린저 밴드를 표시하는 지표입니다.
또한, 고차 타임프레임(HTF) 데이터를 활용하여 시장의 큰 흐름을 분석할 수 있도록 설계되었습니다.
🔹 지표 작동 방식
고차 타임프레임(HTF) 데이터 적용
사용자가 원하는 타임프레임을 선택하여 VWMA와 ATR을 계산할 수 있습니다.
이를 통해 더 큰 시장 흐름을 분석할 수 있으며, 저타임프레임의 노이즈를 줄일 수 있습니다.
거래량 가중 이동평균(VWMA) 적용
VWMA는 단순 이동평균(SMA)보다 거래량이 많은 가격 움직임에 더 큰 가중치를 부여합니다.
계산 공식:
𝑉𝑊𝑀𝐴=∑(𝐶𝑙𝑜𝑠𝑒×𝑉𝑜𝑙𝑢𝑚𝑒) / ∑𝑉𝑜𝑙𝑢𝑚𝑒
거래량이 많이 발생한 가격 구간을 강조하는 특성이 있어, 시장의 유동성 구간을 더 정확히 포착할 수 있습니다.
ATR 기반 피보나치 볼린저 밴드 생성
ATR(Average True Range)를 활용하여 변동성을 측정합니다.
기존의 표준편차 기반 볼린저 밴드 대신, 피보나치 계수(2.618, 3.0, 3.414)를 ATR에 곱하여 밴드를 생성합니다.
이 밴드는 시장 변동성에 따라 유동적으로 조정됩니다.
🔹 탐구 결과: 매물대 및 오더블록 감지
테스트를 통해 Fibonacci 2.618 ~ 3.414 구간에서 매물대 및 오더블록을 포착하는 경향이 있음을 확인했습니다.
가격이 피보나치 밴드(특히 2.618, 3.0, 3.414)에 닿을 때 반응하는 경우가 많음
VWMA의 특성을 통해 오더블록을 감지할 가능성이 높음
🔹 오더블록(Order Block) 감지 원리
Fibonacci 밴드 끄트머리(2.618 ~ 3.414)에서 가격이 강하게 반응
이 영역에서 가격이 강하게 튀어 오르거나(매수 압력) 급락하는(매도 압력) 경우,
→ 기관들이 포지션을 청산하거나 추가 매집하는 구간일 가능성이 큼.
과거에 대량 주문이 체결된 가격 구간(= 오더블록)일 수 있음.
VWMA를 통한 유동성 감지
VWMA는 거래량이 집중된 가격을 기준으로 이동하기 때문에, 기관 주문이 많이 들어온 가격대를 강조하는 특징이 있음.
따라서 VWMA와 피보나치 밴드가 만나는 지점은 유동성이 높은 핵심 구간이 될 가능성이 큼.
매물대 및 청산 구간 분석
가격이 밴드에 도달했을 때 강한 반등이 나오는지를 확인 → 오더블록 가능성
가격이 밴드를 여러 번 테스트하면서 돌파하지 못한다면, 해당 지점은 강한 매물대일 가능성
🔹 활용 방법
✅ 오더블록 감지:
가격이 밴드(2.618~3.414)에 닿고 강하게 튕긴다면, 오더블록 가능성
해당 지점에서 거래량 증가 및 강한 반등 발생 시 매수 고려
✅ 유동성 풀 확인:
VWMA와 피보나치 밴드가 만나는 구간에서 반복적으로 거래량이 터진다면, 해당 지점은 기관 유동성 구간일 가능성
✅ 추세 확인:
VWMA가 상승하고 가격이 밴드 하단(지지선)에서 튕긴다면 강한 상승 추세
VWMA가 하락하고 가격이 밴드 상단(저항선)에서 거부당하면 하락 추세 지속

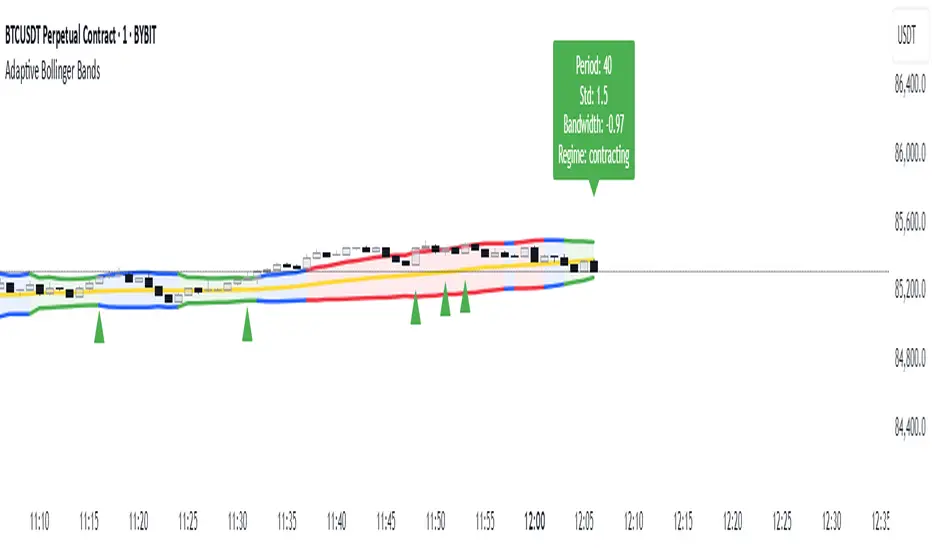
Adaptive Bollinger BandsAdaptive Bollinger Bands
This indicator displays Bollinger Bands with parameters that dynamically adjust based on market volatility. Unlike standard Bollinger Bands with fixed parameters, this version adaptively modifies both the period and standard deviation multiplier in real-time based on measured market conditions.
Key Features
Dynamic adjustment of period and standard deviation based on normalized volatility
Color-coded visualization of current volatility regime (expanding, normal, contracting)
Integration with Keltner Channels for band refinement
Bandwidth analysis for volatility regime identification
Optional on-chart parameter labels showing current settings
Band cross alerts and visual markers
Volatility Visualization
The indicator uses color-coding to display different volatility regimes:
Red: Expanding volatility regime (higher measured volatility)
Blue: Normal volatility regime (average measurements)
Green: Contracting volatility regime (lower measured volatility)
Technical Information
The indicator calculates volatility by analyzing price returns over a configurable lookback period (default 50 bars). The standard deviation of returns is normalized against historical extremes to create an adaptive scaling factor.
Band adaptation occurs through two primary mechanisms:
1. Period adjustment: Higher volatility uses shorter periods (more responsive), while lower volatility uses longer periods (more stable)
2. Standard deviation multiplier adjustment: Higher volatility increases the multiplier (wider bands), while lower volatility decreases it (tighter bands)
The middle band uses a simple moving average with the adaptive period. Additional refinement occurs through Keltner Channel integration, which can tighten bands when contained within Keltner boundaries.
Volatility regimes are determined by analyzing Bollinger Bandwidth relative to its recent history, providing contextual information about the current market state.
Settings Customization
The indicator provides extensive customization options:
- Base parameters (period and standard deviation)
- Adaptive range limits (min/max period and standard deviation)
- Keltner Channel parameters for band refinement
- Bandwidth analysis settings
- Display options for visual elements
Limitations and Considerations
All technical indicators have inherent limitations and should not be used in isolation
Past performance does not guarantee future results
The indicator requires sufficient historical data for proper volatility normalization
Smaller timeframes may produce more noise in the adaptive calculations
Parameters may require adjustment for different markets and trading styles
Band crosses are not trading signals on their own and should be evaluated with other factors
This indicator is designed to provide objective information about market volatility conditions and potential support/resistance zones. Always combine with other analysis methods within a comprehensive trading approach.
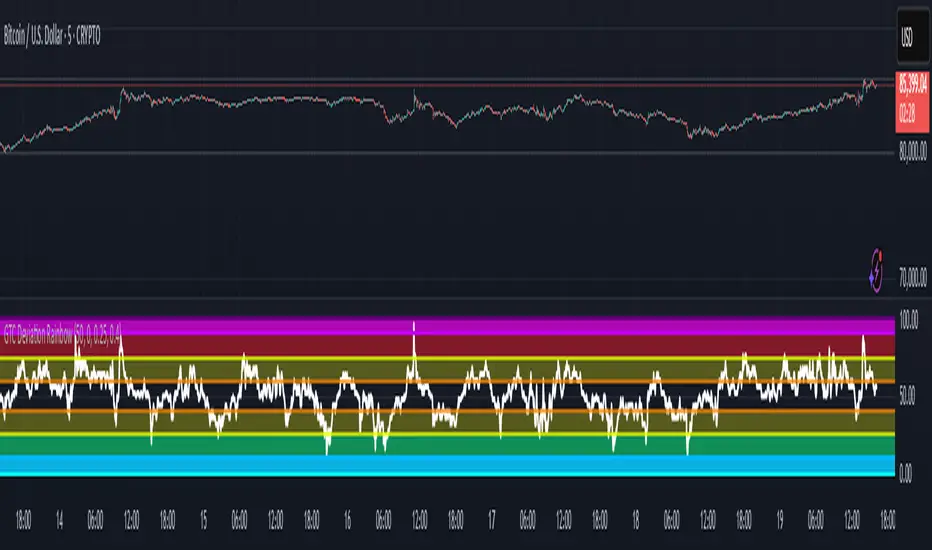
GTC Deviation Rainbow🚀 Introducing the GTC Deviation Rainbow: Your Ultimate Market Precision Tool
The GTC Deviation Rainbow is a powerful, all-in-one tool designed to pinpoint market extremes, detect mean reversion opportunities, and clarify trends with stunning accuracy. By visualizing multiple deviation bands, it reveals overbought and oversold conditions across all timeframes, giving you the insight you need to make confident, high-probability trades. The GTC Deviation Rainbow combines volatility analysis, mean reversion detection, and market trend clarity—all in one cutting-edge package.
🌈 What Makes the GTC Deviation Rainbow Revolutionary:
Unlike any other indicator available on the market, the GTC Deviation Rainbow offers a groundbreaking approach to market analysis. While most indicators focus on single metrics or basic oscillations, this tool visualizes layered deviation bands that provide a comprehensive view of market conditions. Its ability to simultaneously identify overbought and oversold states across multiple timeframes makes it an unparalleled resource for precision trading.
💡 Why This Indicator Stands Out:
The GTC Deviation Rainbow isn't just a tool—it's a strategy enhancer. Its unique ability to detect both micro and macro deviations offers powerful insights for scalpers, swing traders, and long-term investors alike. When the bands stretch too far from the mean, you know it's time to pay attention.
📈 Why You Need This Indicator:
✅ Comprehensive Market Analysis: Instantly identify when prices have deviated too far from their historical norms, signaling prime entry and exit points.
✅ Versatile Usage: Whether you’re looking for intraday reversals, swing trades, or long-term setups, the GTC Deviation Rainbow adapts to your trading style.
✅ Works Across Markets: From crypto and stocks to forex and commodities, this tool delivers clarity and precision everywhere.
✅ Visual Simplicity: Color-coded deviation bands eliminate guesswork, giving you straightforward, actionable insights.
🔥 How To Use It Effectively:
Spot Deviation Extremes: Watch for price interactions with outer deviation bands to find high-probability reversal zones.
Confirm Trends: Use the indicator to assess whether a price movement is a genuine trend or a temporary spike.
Align With Your Strategy: Combine the GTC Deviation Rainbow with your preferred methods to amplify your trading edge.
📌 Elevate Your Trading Game.
The GTC Deviation Rainbow Indicator isn't just another indicator—it's a powerful ally designed to keep you ahead of the market. Whether you’re hunting for short-term reversals or planning long-term moves, this tool will sharpen your edge like never before.
⚠️ Disclaimer:
The GTC Deviation Rainbow is a powerful tool designed to enhance your market analysis by providing unique insights. However, it is not a replacement for comprehensive market analysis or prudent risk management. Always combine our tools with thorough research, technical analysis, and a well-structured trading plan. Past performance is not indicative of future results. Trade responsibly.
BBVOL SwiftEdgeBBVOL SwiftEdge – Precision Scalping with Volume and Trend Filtering
Optimized for scalping and short-term trading on fast-moving markets (e.g., 1-minute charts), BBVOL SwiftEdge combines Bollinger Bands, Heikin Ashi smoothing, volume momentum, and EMA trend alignment to deliver actionable buy/sell signals with visual trend cues. Ideal for forex, crypto, and stocks.
What Makes BBVOL SwiftEdge Unique?
Unlike traditional Bollinger Bands scripts that focus solely on price volatility, BBVOL SwiftEdge enhances signal precision by:
Using Heikin Ashi to filter out noise and confirm trend direction, reducing false signals in choppy markets.
Incorporating volume analysis to ensure signals align with significant buying or selling pressure (customizable thresholds).
Adding an EMA overlay to keep trades in sync with the short-term trend.
Coloring candlesticks (green for bullish, red for bearish, purple for consolidation) to visually highlight market conditions at a glance.
How Does It Work?
Buy Signal: Triggers when price crosses above the lower Bollinger Band, Heikin Ashi shows bullish momentum (close > open), buy volume exceeds your set threshold (default 30%), and price is above the EMA. A green triangle appears below the candle.
Sell Signal: Triggers when price crosses below the upper Bollinger Band, Heikin Ashi turns bearish (close < open), sell volume exceeds the threshold (default 30%), and price is below the EMA. A red triangle appears above the candle.
Trend Visualization: Candles turn green when price is significantly above the Bollinger Bands’ basis (indicating a bullish trend), red when below (bearish trend), or purple when near the basis (consolidation), based on a customizable threshold (default 10% of BB width).
Risk Management: Each signal calculates a stop-loss (10% beyond the opposite band) and take-profit (opposite band), plotted for reference.
How to Use It
Timeframe: Best on 1-minute to 5-minute charts for scalping; test higher timeframes for swing trading.
Markets: Works well in volatile markets like forex pairs (e.g., EUR/USD), crypto (e.g., BTC/USD), or liquid stocks.
Customization: Adjust Bollinger Bands length (default 10), multiplier (default 1.2), volume thresholds (default 30%), EMA length (default 3), and consolidation threshold (default 0.1%) to match your strategy.
Interpretation: Look for green/red triangles as entry signals, confirmed by candle colors. Purple candles suggest caution—wait for a breakout. Use stop-loss/take-profit levels for trade management.
Underlying Concepts
Bollinger Bands: Measures volatility and identifies overbought/oversold zones.
Heikin Ashi: Smooths price action to emphasize trend direction.
Volume Momentum: Calculates cumulative buy/sell volume percentages to confirm market strength (e.g., buyVolPercent = buyVolume / totalVolume * 100).
EMA: A fast-moving average (default length 3) ensures signals align with the immediate trend.
Chart Setup
The chart displays Bollinger Bands (orange), Heikin Ashi close (green circles), EMA (purple), and volume-scaled lines (lime/red). Signals are marked with triangles, and candle colors reflect trend state. Keep the chart clean by focusing on these outputs for clarity.

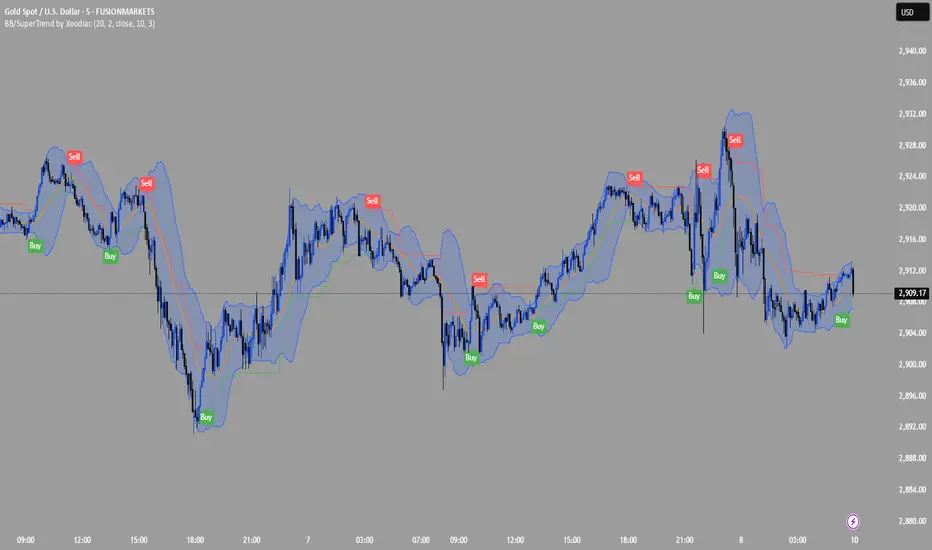
Bollinger Bands + Supertrend by XoediacBollinger Bands with Supertrend Indicator by Xeodiac
This script combines two powerful technical analysis tools — Bollinger Bands and the Supertrend Indicator — to provide traders with a comprehensive view of market volatility and trend direction.
Bollinger Bands: These bands consist of a middle band (the simple moving average, or SMA) and two outer bands (calculated as standard deviations away from the middle). The upper and lower bands act as dynamic support and resistance levels, expanding during high volatility and contracting during low volatility.
Supertrend Indicator: The Supertrend is a trend-following indicator that uses the Average True Range (ATR) to calculate an adaptive threshold, indicating whether the market is in an uptrend or downtrend. The indicator changes color based on the trend direction, providing clear buy and sell signals.
Features of the Script:
Volatility-based Signals : By incorporating the Bollinger Bands, the script adjusts to market volatility. Traders can identify periods of high and low volatility, helping to gauge potential price breakouts or reversals.
Trend Confirmation: The Supertrend helps confirm the trend direction, ensuring that trades are aligned with the overall market trend. Green Supertrend signals indicate an uptrend, while red signals indicate a downtrend.
Enhanced Decision-making: By using both indicators together, traders can make more informed decisions. For instance, buying opportunities are validated when the price is near the lower Bollinger Band, and the Supertrend is in a bullish phase, and vice versa for selling.
Customizable Parameters: The script allows users to customize the settings for both the Bollinger Bands and the Supertrend, enabling fine-tuning based on trading preferences or market conditions.
Ideal Use Cases:
Identifying trend reversals or continuation patterns in trending markets.
Monitoring price action during periods of low volatility for breakout opportunities.
Filtering out false signals by combining volatility with trend strength.
Bollinger Bands MTF & Kalman Filter | Flux Charts📈 Multi-Timeframe Kalman Filtered Bollinger Bands Indicator
Introducing our MTF Kalman Filtered Bollinger Bands – a powerful multi-timeframe Bollinger Bands (BB) indicator enhanced with Kalman filtering for superior smoothing and trend analysis. This indicator dynamically adapts Bollinger Bands across multiple timeframes while incorporating volume-based gradient transparency to highlight significant price movements. This indicator is better optimized for lower timeframes.
❓ How to Interpret the Bands & Volume Gradient:
Our indicator combines Lower Timeframe (LTF) and Higher Timeframe (HTF) Bollinger Bands to provide a comprehensive trend analysis. It applies Kalman filtering to the LTF bands, ensuring smoother, noise-reduced signals. The color gradient and relative volume-based transparency offer deeper insights into price strength.
🔹 LTF Bollinger Bands: Shorter-period bands filtered with a Kalman smoothing algorithm, reducing lag and noise.
🔹 HTF Bollinger Bands: Traditional Bollinger Bands plotted on a higher timeframe, offering macro trend analysis.
🔹 Volume Gradient Transparency: The bands adjust their opacity based on relative buy/sell volume, allowing traders to assess momentum strength.
📌 How Does It Work?
1️⃣ Multi-Timeframe Bollinger Bands Calculation
The LTF BB uses Kalman filtering for a smoother price representation, helping to reduce false signals.
The HTF BB is EMA-smoothed for improved trend clarity.
2️⃣ Adaptive Gradient Transparency
The opacity of the fill color between the bands is determined by relative buy/sell volume.
Higher buy volume = stronger bullish signal (greener bands).
Higher sell volume = stronger bearish signal (redder bands).
3️⃣ Dynamic Trend Signals & Breakouts
Buy Signal: When price breaks below the HTF lower band and LTF bands start rising.
Sell Signal: When price breaks above the HTF upper band and LTF bands start falling.
⚙️ Settings & Customization:
🛠 LTF and HTF Bollinger Bands Settings:
Multiplier: The multiplier applied to the BB to determine the upper and lower bands
Length: Define the number of bars determines the BB calculations.
Custom Timeframe Selection: Choose from predefined options (e.g., 5m, 15m, 1H, 4H, etc).
🎨 Gradient & Transparency Settings:
Bullish/Bearish Color Options: Customize colors for uptrend and downtrend conditions.
Max & Min Opacity: Adjust the transparency levels based on volume intensity.
Solid vs. Gradient Mode: Choose between a gradient fill or a solid color mode for clarity.
📌 Recommended Settings for Optimal Use:
1️⃣ Timeframe Selection (LTF -> HTF):
1 min -> 5 min
2 min -> 5 min
3 min -> 15 min
5 min -> 15 min
15 min -> 1 hr
1 hr -> 4 hr
4 hr -> 1 day
2️⃣ Multiplier: Use 2.0 for LTF and 2.25 for HTF
3️⃣Length: Use a length of 20 - 30 bars
🚀 Why Use This Indicator?
✅ Multi-Timeframe Bollinger Bands with Kalman Filtering – Ideal for traders looking for reduced lag and clearer trend signals.
✅ Volume-Based Transparency – See momentum shifts instantly with adaptive opacity.
✅ Dynamic Buy & Sell Signals – Alerts based on price action + volume trends.
✅ Customizable for Any Strategy – Adjust colors, timeframes, and filtering options for personalized trading.

Bollinger Bands by Abu ElyasBollinger Bands with Adjustable Stop Loss (Long-Only)
This strategy uses a Bollinger Band breakout approach to enter long positions and incorporates an adjustable stop loss for risk management.
Below is an overview of the logic, parameters, and usage instructions.
1. Bollinger Bands Logic
Basis (Middle Band): A moving average (type selectable by the user) of the chosen source, typically the closing price.
Upper Band: The basis plus a specified number of standard deviations (user-defined multiplier).
Lower Band: The basis minus the same number of standard deviations.
2. Entry Triggers
The strategy enters a long position when the close price rises above the upper Bollinger Band , suggesting a potential bullish breakout.
This logic is only applied within a user-specified date range (adjustable in the strategy’s inputs).
3. Exit Triggers
1. Bollinger Band Exit:
If the close price drops below the lower Bollinger Band , the strategy closes the position, indicating a loss of bullish momentum.
2. Stop Loss Exit:
A default 8% stop loss is set, which automatically exits the trade if the close falls 8% below the entry price.
This stop-loss percentage is adjustable from the strategy’s settings, allowing users to tailor risk based on their preferences.
3. Date Range:
If the current bar is outside of the specified start/end dates, the strategy will also exit any open positions.
4. Position Sizing & Other Settings
1- Position Size:
By default, the script uses 100% of account equity for each trade.
2- Commissions & Slippage:
Commission is set to 0%, and slippage is set to 3 ticks.
3- Timeframe Handling:
You can select a custom timeframe or leave it blank to use the chart’s timeframe.
5. Customization
1. Bollinger Bands Parameters:
Length of the moving average, type of moving average (SMA, EMA, etc.), and the standard deviation multiplier can be adjusted.
2. Stop Loss (%)
The default stop loss of 8% can be changed in the script’s input settings to any percentage you prefer.
3. Date Filter:
Modify the start/end dates to control the historical period over which the strategy executes trades.
6. Notes & Best Practices
1- No Short Trades:
This is a long‐only strategy. It will either be in a long position or flat (no open position).
2- Risk Management:
An 8% stop loss may or may not align with your personal risk tolerance. Always adjust according to market conditions and your own trading style.
3- Market Gaps & Volatility:
In highly volatile markets, slippage or gaps can cause the actual exit price to be worse than the intended stop-loss level.
4- Test Thoroughly:
Backtest on different timeframes and market conditions. No single strategy works in all scenarios.
7. Disclaimer
Educational Use Only: This script is for informational and illustrative purposes and should not be considered financial advice.
No Guarantee of Profit: Past performance does not guarantee future results. Trading involves substantial risk, and it is possible to lose more than your initial investment.
Consult a Professional: Always consult a qualified financial advisor before making investment decisions.
Use this script as a foundation and personalize it based on your trading style, tolerance for drawdowns, and market conditions.

Enhanced BarUpDn StrategyEnhanced BarUpDn Strategy
The Enhanced BarUpDn Strategy is a refined price action-based trading approach that identifies market trends and reversals using bar formations. It focuses on detecting bullish and bearish momentum by analyzing consecutive price bars and key support/resistance levels.
Key Features:
✅ Trend Confirmation – Uses a combination of bar patterns and indicators (e.g., moving averages, RSI) to confirm momentum shifts.
✅ Entry Signals – A buy signal is triggered when an "Up Bar" (higher high, higher low) follows a bullish setup; a sell signal when a "Down Bar" (lower high, lower low) confirms bearish momentum.
✅ Enhanced Filters – Incorporates volume analysis and additional conditions to reduce false signals.
✅ Stop-Loss & Risk Management – Uses recent swing highs/lows for stop placement and dynamic trailing stops for maximizing gains.

Smart Buy/Sell Signal IndicatorOverview
The Smart Buy/Sell Signal Indicator is a multi-factor trading tool that i ntegrates Supertrend, Bollinger Bands, RSI, ADX, and Moving Averages to generate high-probability buy and sell signals. Unlike simple crossover-based strategies, this indicator leverages multiple layers of confirmation to reduce false signals and improve trade execution accuracy.
This indicator is designed for trend-following traders, scalpers, and swing traders, helping them identify key reversal points and momentum shifts with precise breakout conditions.
How It Works
The Smart Buy/Sell Signal Indicator filters out weak trade signals by combining trend, volatility, momentum, and strength indicators in the following manner:
✅ Supertrend-Based Trend Filtering:
• The script checks if the price is above or below the Supertrend level before confirming a buy or sell signal.
• Buy signals occur below the Supertrend Down level, confirming support.
• Sell signals occur above the Supertrend Up level, confirming resistance.
✅ Bollinger Bands for Overbought & Oversold Conditions:
• Buy signals are confirmed when price touches the Bollinger Lower Band (suggesting oversold conditions).
• Sell signals are confirmed when price touches the Bollinger Upper Band (suggesting overbought conditions).
• This ensures that trades occur at high-probability reversal zones, rather than random price action.
✅ RSI Momentum Confirmation:
• Buy trades trigger when RSI is below 50 (indicating strength building from an oversold region).
• Sell trades trigger when RSI is above 50 (indicating weakness forming in an overbought region).
• This ensures signals are momentum-backed and not counter-trend moves.
✅ ADX Strength Confirmation:
• The script filters signals using the ADX (Average Directional Index) to ensure that only trades with sufficient market strength are executed.
• If the ADX value is below a threshold (default: 15), the signal is ignored to prevent false breakouts in choppy markets.
✅ Confirmation Moving Average (MA) for Trend Validation:
• The script applies an additional confirmation filter using a Moving Average (SMA/EMA).
• Buy signals trigger only when the price is above the MA, aligning with trend direction.
• Sell signals trigger only when the price is below the MA, ensuring alignment with the broader market structure.
✅ Trade Cooldown Mechanism (Minimum Bars Between Signals):
• To avoid frequent signals in sideways markets, a cooldown period is implemented.
• Default: 5 bars between signals (adjustable).
• Prevents rapid consecutive trades, reducing false entries.
Key Features
✔️ Supertrend & Moving Average Confirmation – Ensures trades are taken only in the correct trend direction.
✔️ Bollinger Bands Integration – Helps identify high-probability reversal zones.
✔️ ADX Strength Filtering – Ensures trades are only executed when the market has enough strength.
✔️ Momentum-Based RSI Filtering – Avoids counter-trend trades and confirms directional strength.
✔️ Trade Cooldown Mechanism – Reduces overtrading and noise in sideways markets.
✔️ Webhook Alerts for Automation – Auto-execute trades or receive real-time notifications.
✔️ Customizable Inputs – Adjustable thresholds, EMA/SMA length, ADX filter, cooldown period for flexibility.
✔️ Works Across Multiple Timeframes – Suitable for scalping (5m, 15m), swing trading (1H, 4H), and position trading (Daily).
How to Use
📌 Scalping & Intraday Trading:
• Use on 5m, 15m, or 30m timeframes.
• Look for Bollinger Band touch + RSI confirmation + Supertrend support/resistance validation before entering trades.
📌 Swing Trading:
• Use on 1H or 4H timeframes.
• Enter only when ADX is strong and price aligns with Supertrend direction.
📌 Webhook Automation:
• Set up TradingView Alerts to auto-execute trades via Webhook-compatible platforms.
Why This Combination?
This indicator is not just a simple moving average crossover tool.
It is designed to filter out weak breakouts and only execute trades that have:
✅ Trend confirmation (Supertrend + Moving Average)
✅ Volatility filtering (Bollinger Bands for overbought/oversold confirmation)
✅ Momentum validation (RSI threshold filtering)
✅ Market strength requirement (ADX ensures sufficient momentum)
This multi-layered approach ensures that only the highest-quality setups are executed, improving both win rate and reliability.
Why It’s Worth Using?
🚀 Reduces False Breakouts – Avoids weak breakouts by requiring ADX confirmation.
🚀 Works in All Market Conditions – Trend-following logic for trending markets, volatility-based entries for reversals.
🚀 Customizable to Any Trading Style – Adjustable parameters for trend, momentum, and strength filtering.
🚀 Seamless Webhook Automation – Execute trades automatically with TradingView alerts.
🚀 Ready to trade smarter?
✅ Add the Smart Buy/Sell Signal Indicator to your TradingView chart today! 🎯🔥

Red & Green Zone ReversalOverview
The “Red & Green Zone Reversal” indicator is designed to visually highlight potential reversal zones on your chart by using a combination of Bollinger Bands and the Relative Strength Index (RSI).
It overlays on the chart and provides background color cues—red for oversold conditions and green for overbought conditions—along with corresponding alert triggers.
Key Components
Overlay: The indicator is set to overlay the chart, meaning its visual cues (colored backgrounds) are drawn directly on the price chart.
Bollinger Bands Calculation
Period: A 20-period simple moving average (SMA) is calculated from the closing prices.
Standard Deviation Multiplier: A multiplier of 2.0 is applied.
Bands Defined:
Basis: The 20-period SMA.
Deviation: Calculated as 2 times the standard deviation over the same period.
Upper Band: Basis plus the deviation.
Lower Band: Basis minus the deviation.
RSI Calculation
Period: The RSI is computed over a 14-period span using the closing prices.
Thresholds:
Oversold Threshold: 30 (used for the red zone condition).
Overbought Threshold: 70 (used for the green zone condition).
Zone Conditions
Red Zone (Oversold):
Criteria: The price is below the lower Bollinger Band and the RSI is below 30.
Purpose: Highlights a situation where the asset may be deeply oversold, signaling a potential reversal to the upside.
Green Zone (Overbought):
Criteria: The price is above the upper Bollinger Band and the RSI is above 70.
Purpose: Indicates that the asset may be overbought, potentially signaling a reversal to the downside.
Visual and Alert Components
Background Coloring:
Red Background: Applied when the red zone condition is met (using a semi-transparent red).
Green Background: Applied when the green zone condition is met (using a semi-transparent green).
Alerts:
Red Alert: An alert condition titled “Deep Oversold Alert” is triggered with the message “Deep Oversold Signal triggered!” when the red zone criteria are satisfied.
Green Alert: Similarly, an alert condition titled “Deep Overbought Alert” is triggered with the message “Deep Overbought Signal triggered!” when the green zone criteria are met.
Important Disclaimers
Not Financial Advice:
This indicator is provided for informational and analytical purposes only. It does not constitute trading advice or a recommendation to buy or sell any asset. Traders should use it as one of several tools in their analysis and should perform their own due diligence.
Risk Management:
Trading inherently involves risk. Past performance is not indicative of future results. Always implement appropriate risk management and use stop losses where necessary.
Summary
In summary, the “Red & Green Zone Reversal” indicator uses Bollinger Bands and RSI to detect extreme market conditions. It visually marks oversold (red) and overbought (green) conditions directly on the chart and offers alert conditions to help traders monitor these potential reversal points.
Enjoy!!

RSI with Bollinger Bands and Buy/Sell SignalsPurpose:
This indicator combines the Relative Strength Index (RSI) with Bollinger Bands to identify overbought and oversold conditions in the market. It also generates buy and sell signals based on the interaction between the RSI and the Bollinger Bands. It is particularly useful for traders looking for opportunities in volatile or trending markets.
How It Works:
RSI (Relative Strength Index):
The RSI measures the magnitude of recent price changes to evaluate whether an asset is overbought (values > 70) or oversold (values < 30).
In this indicator, horizontal lines at levels 70 (overbought) and 30 (oversold) are used as reference points.
Bollinger Bands:
Bollinger Bands are calculated around a smoothed moving average of the RSI. The upper band represents dynamic overbought levels, while the lower band indicates dynamic oversold levels.
These bands automatically adjust their width based on the volatility of the RSI, allowing them to adapt to different market conditions.
Buy and Sell Signals:
Buy Signal: A buy signal is generated when the RSI exceeds both the upper Bollinger Band and the overbought level (70). This suggests that the asset is in an extreme bullish phase.
Sell Signal: A sell signal is generated when the RSI falls below both the lower Bollinger Band and the oversold level (30). This suggests that the asset is in an extreme bearish phase.
Alerts:
The indicator includes automatic alerts to notify you when buy or sell signals are generated. This allows traders to act quickly on new opportunities.
Best Practices:
Confirmation in Lower Timeframes:
Although this indicator is powerful, it is recommended to confirm signals in lower timeframes before making trading decisions. For example:
If you receive a buy signal on a 4-hour chart, check if the RSI and Bollinger Bands on lower timeframes (such as 1 hour or 15 minutes) also show bullish signals.
This reduces the risk of false positives and increases the accuracy of your entries.
Use in Trends:
This indicator works best in markets with clear trends. In sideways or low-volatility markets, signals may be less reliable due to the lack of directional momentum.
Risk Management:
Always use stop-loss and take-profit to protect your positions. Buy and sell signals are just one tool for analysis; they do not guarantee results.
Combination with Other Indicators:
To improve accuracy, consider combining this indicator with others, such as MACD, Stochastic Oscillator, or Japanese candlestick patterns. This can provide additional confirmation before opening a position.
Summary:
The RSI + Bollinger Bands with Buy/Sell Signals indicator is an advanced tool designed to identify entry and exit points in the market based on extreme overbought and oversold conditions. However, to maximize its effectiveness, it is crucial to confirm signals in lower timeframes and use it in combination with other technical analysis tools. With proper risk management and careful interpretation of signals, this indicator can be a valuable ally in your trading strategy.
