RSI Bollinger %BIt's an RSI indicator combined with Bollinger %B. This way you just need to check if it is above 1.0 or below 0.0 (Outside Bollinger Bands). You can choose the moving average method used by RSI.
布林帶(BB)

WIM-[WorldIsMine]An entry index that adds VWMA as an essence to be aware of trading volume in addition to SMA and BB which are valid in all investment markets.
With alert.

OBV w/BB+EMAOBV plotted with Bollinger Bands to show whether the volume is breaking out from its normal deviation (both up or down). The OBV changes color depending on the macro trend which is set using a 100 EMA.

MTF Nested BB w/ Reversal SignalsNested BB with 1 Dev line and 2/3 Dev Cloud
Threshold signal indicating strong / extended move in direction ..
Reversal signal indicating potential reversal ..
Color / direction coated based on band that is extended .. band that price is reversing towards ..
Commander IndicatorCommander Multi Indicator
included:
Pioneer EMA
Commander 3MA with MAs cross signal
Double Ichimoku - Kijun Base-Line (26) and Kijun Commander Moving (103)
Parabolic Sar
Bollinger Band
3-Stroke Movings

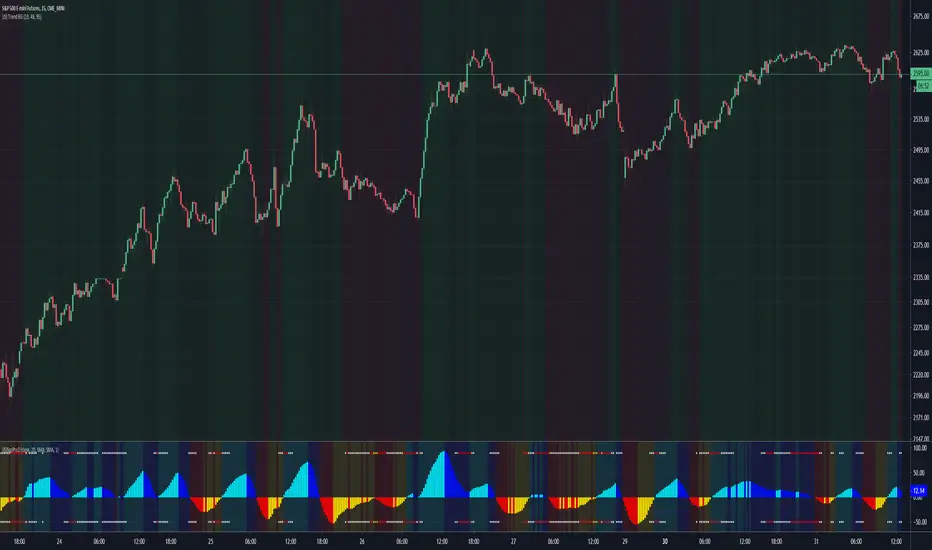
(JS) Squeeze Pro 2This is my version of the updated classic indicator created by John Carter. I plan on adding a Squeeze Overlay script in the future that will pair with this one as well for additional signals.
So to break down the Squeeze, what it is, how it works, etc - you have to look at the components that make it up.
1. Bollinger Bands
2. Keltner Channels
3. Momentum
The momentum in this indicator is smoothed out using linear regression (shout out to Lazy Bear, it's a much simpler way to do it, imo).
The momentum is what is displayed on the indicator as a histogram, its purpose is obvious (to show momentum).
Now what is a Squeeze? A squeeze occurs when Bollinger Bands tighten up enough to slip inside of Keltner Channels.
This is interpreted as price is compressing and building up energy before releasing it and making a big move.
Traditionally, John Carter's version uses 20 period SMAs as the basis lines on both the BB and the KC.
In my version, I've given the freedom to change this and try out different types of moving averages.
His original squeeze indicator had one Squeeze setting, though this new one has three .
The white dot Squeeze , call it a "low squeeze", an "early squeeze", whatever you'd like - this is the easiest Squeeze to form based on its settings.
The red dot Squeeze is the original from the first Squeeze indicator.
And finally, the yellow dot squeeze , call it a "high squeeze", "power squeeze", once again whatever you want - is the most difficult to form and suggests price is under extreme levels of compression.
From what I've witnessed John Carter say in the past, the squeeze is meant to be used for continuation.
Now to explain the parameters:
Squeeze Input - This is just the source for the Squeeze to use, default value is closing price.
Length - This is the length of time used to calculate the Bollinger Bands and Keltner Channels.
Bollinger Bands Calculation Type - Selects the type of moving average used to create the Bollinger Bands.
Keltner Channel Calculation Type - Selects the type of moving average used to create the Keltner Channel.
Color Format - I have created 5 different color schemes, this allows you to choose one.
Draw Divergence - Self explanatory here, this will auto-draw divergence on the indicator.
Gray Background for Dark Mode - This is something I put on all my indicators to make them more visually appealing.
Moving on to the alerts, I have made some basic alerts to notify certain indicator conditions (I had to revise it back from the prior version, as V4 of PineScript limits outputs).
6th Dot Alerts - This will inform you when a certain Squeeze makes it 6 dots in. Why 6 dots? That is what John Carter said to be his preference.
12th Dot Alerts - Think of this as a "prolonged Squeeze" alert. I feel like if they do run this long you likely need to go up in resolution, but some traders prefer certain time increments so this is for them.
End of Squeeze Alerts - Self explanatory again - once a Squeeze has concluded this will provide you with a notification.
Start of Squeeze Alerts - Opposite of the alert above, notifications come when a Squeeze begins.
Zero Line Alerts - This will inform you of when the momentum makes a bullish or bearish move across the zero line.
I hope that I've done well enough explaining the indicator and how it works, for any further information on it I suggest you check out Simpler Trading and get linked up with John Carter over there.
He does lots of videos, webinars, and of course you can always get the official indicator and his signals there too.
[fikira] Bollinger Bands + Higher Time FramesHere is my take on BB and MTF, based on the most excellent work of
"PineCoders" (MTF Selection Framework functions)!
The big advantage is that on 1 image you can easily see where
price is compared to 5 or less BB Bands (each of different Time Frames).
This gives a lot of Support and Resistance area's!
Includes:
- 1 Bollinger Bands (can be enabled/disabled - "Bollinger Bands"
- 4 Bollinger Bands (each can be enabled/disabled - "HTF Selection 1-4")
Each BB has its colour (can be changed)
- Labels (Timeframe and price) can be enabled/disabled
- Labels position and size can be changed
...

Pivot Boss 4 EMA + BB + Parabolic SAR + IchimokuA combination of a few of my favorite indicators.
1) Pivot Boss 4 EMA
2) Bollinger Bands
3) Parabolic SAR
4) Ichimoku Cloud
All credit to original authors.

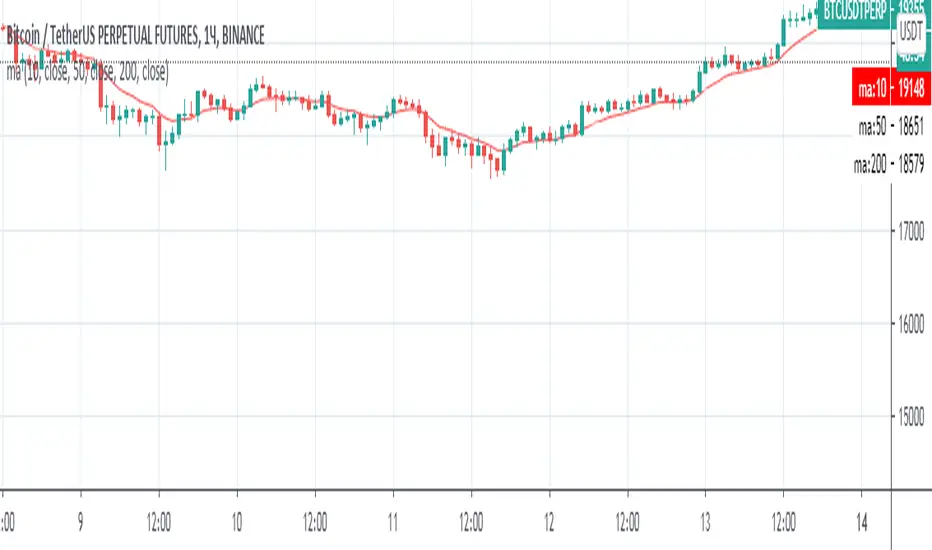
unRekt - The MachineThis is a combined script of Welcome to the Machine and Kiss Cross. A moving average crossover was added with the golden cross '50 n 200' being most noticeable.
Up to 5 editable moving averages can be selected on their own or all displayed with varying type of your choice SMA, EMA, WMA, VWMA and LSMA.
Bollinger bands can be disabled to just show the moving average.
Image of bollinger bands off:

N.White_For_H4_TESTI use this Test version to determine price movement for a longer period, in the next versions Long / short signals will be added. Includes drawing support and resistance lines, Bollinger bands.
Borjas Tarh Explosive PivotsBorjas Tarh Explosive Pivots
This indicator includes:
1. Historical Volatility Percentile ( HVP ) +SMA+EMA
Core Idea (balipour) :
HVP Code Help (semiotic) : www.tradingview.com
For the Detailed Description read the Core (HVP) Idea indicator by "balipour" above.
2. Bollinger Bands Width ( BBW )
It's an Oscillation of BBW So it's trapped between 0 to 100. (And Lightly Smoothed)
3. Volume Oscillator
The Volume is oscillated so it's trapped between 0 and -30. (And Lightly Smoothed)
Below 10 Means the Volume in the context of the Candle Volume is pretty low.
4. The Shapes
These Shapes are based of all factors above.
D ( Blue ) : HVP is pretty Low. An Explosive Move is Coming.
A ( Yellow ) : An Explosive Move is Building Up.
B ( Orange ) : An Explosive Move is Near.
C ( Purple ) : An Explosive Move Will Happen Very Soon.
There is an Alternative Set:
On = Annual HVP and Default BBW .
Off = Fibonacci HVP and BBW .
© mrhashem
© Borjas Tarh Company
Bollinger Band - Keltner Squeeze - Failed Volatility BreakoutThis simple script provides Bollinger Band and Keltner Channel indicators, and will highlight areas where the Bollinger Bands enter into the Keltner Channel.
This script is based on the Failed Volatility Breakout (FVBO) System used by professional trader ChrisD_Macro. The default plot styles for the indicators in this script are based on Chris's setup, but visual styles as well as BB and Kelt settings (length, standard deviation, etc...) can all be easily customized with the user interface in the indicator settings.
You can also choose whether you want the condition to be triggered by just one Bollinger Band entering the Keltner Channel, or if it has to be both bands entering the channel.
This script is very useful when manually back testing the FVBO strategy, as it clearly highlights the BB-Kelt squeezes instead of having to constantly scroll in and out looking for them.
It can also be useful live as it has the ability to trigger TradingView alerts using the condition "BB-Kelt Squeeze".
Hope it's helpful
- JDC
Side Notes:
With Forex / Currencies this indicator I usually use this indicator on the 1 Day time frame.
Keep in mind that the script includes the Bollinger Bands and Keltner Channels, so if you already have your own version of these indicators on your chart, it will get really messy. (Just hide the other indicators while you get to know this one).


N.White_ScalpM15TestThis test version of the strategy is designed for scalping on the timeframe M15. It includes drawing support and resistance lines, a bollinger band.

N.White_ScalpM5TESTThis test version of the strategy is designed for scalping on the timeframe M5. It includes drawing support and resistance lines, a bollinger band.
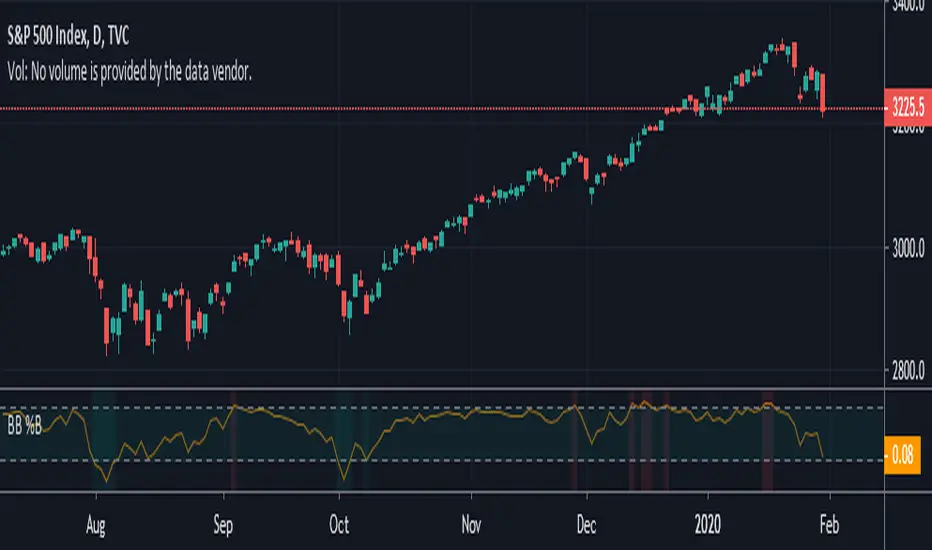
Bollinger Bands %B with HighlightsThis script highlights the indicator background when the Bollinger Bands are breached making it easier to spot them.
Good for strategies that rely on Bollinger Band breaches
Note: Clean version
NoScoobies Bollinger BandsBollinger Bands strategy that I am trying out, however I can't get my strategy.close to work. Looking for help.
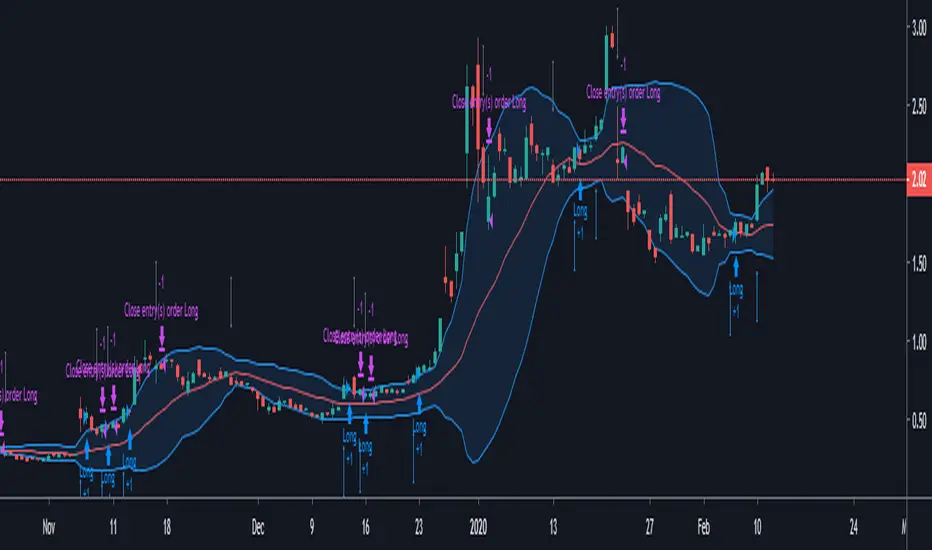
inwCoin BB Break + BBWidth% StrategyEnglish
=======
Alternated version of my old Bollinger Bands strategy.
In this version, I'm using BB Squeeze option to determine the entry condition.
Entry Logic
--------------
1) BB must squeeze less than BB Width Percent parameter.
2) Price close above upper band.
Then strategy will enter trade with stop loss at low of 9 previous candles.
Exit Logic
------------
You can choose which option to exit trade
1) Exit if price close below basis line ( MA 20 )
2) Exit if price close below lower BB
You can choose additional option like;
- Limit max position size = 100%
* If unchecked, if your stop loss distant % is less than Risk Percent parameter, you can get bigger position size more than your available capital ( like leverage )

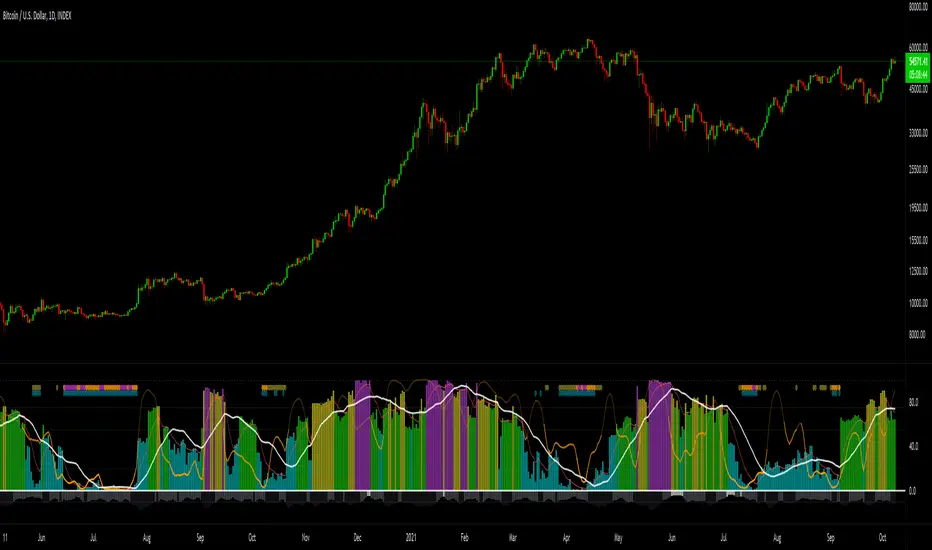
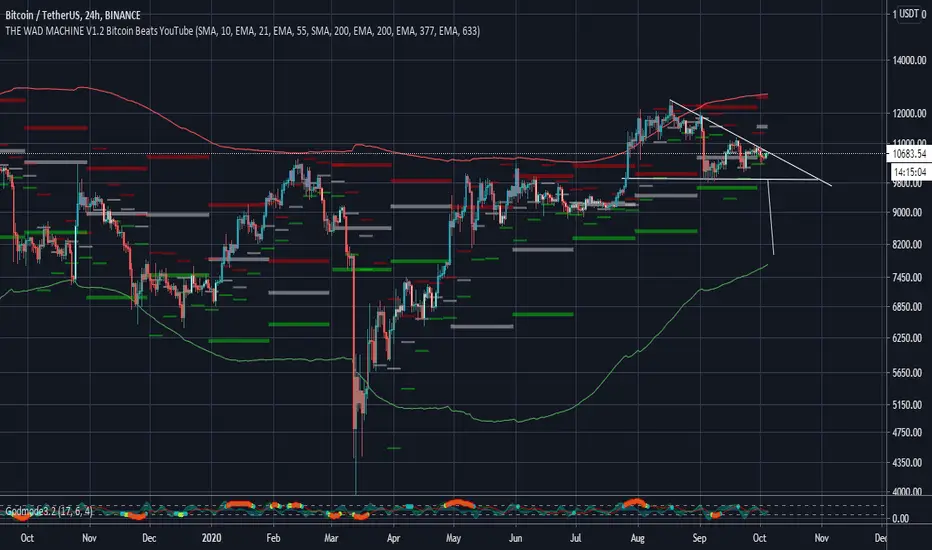
The WAD Machine - Bitcoin BeatsHello Hello Hello, and welcome back to Bitcoin Beats!
This is a Conglomeration of different scripts into 1 indicator that shows a bunch of different things.
This is not all my own work but also a mixture of features taken from other useful scripts.
I will say in terms of originality, it takes a certain level of skill to put this together and get it working so I'll take the credit for that.
This script does all that is said below:
- Plots fibonacci zones with adjustable days, weeks, months ect.
- Shows lower highs, higher lows, lower lows, lower highs after recognizing candle patterns(note that this is not predictive, just shows what has already happened).
- Plots a Price Action Channel(PAC).
The candles automatically adjust to the PAC to give Buy and Sell signals on most timeframes.
If the candles are blue, it means buy.
If the candles are red, it means sell.
If the candles are grey, you shouldn't be in a trade.
I will not state the profitability of this method but for this section of the indicator, it's designed for entries.
Exits require a more manual approach using your own trading initiative.
Beginner traders should exit when the channel is hit and the candle turns grey again.
However, more advanced traders can try to use the Fibonacci zones and other features to manage their positions.
- Plots general trendlines automatically with customization of the lines and the length they go for.
- Plots major sloping supports and resistances automatically.
PLEASE TRADE AT YOUR OWN RISK.
Cheers, and good bye, from Bitcoin Beats.
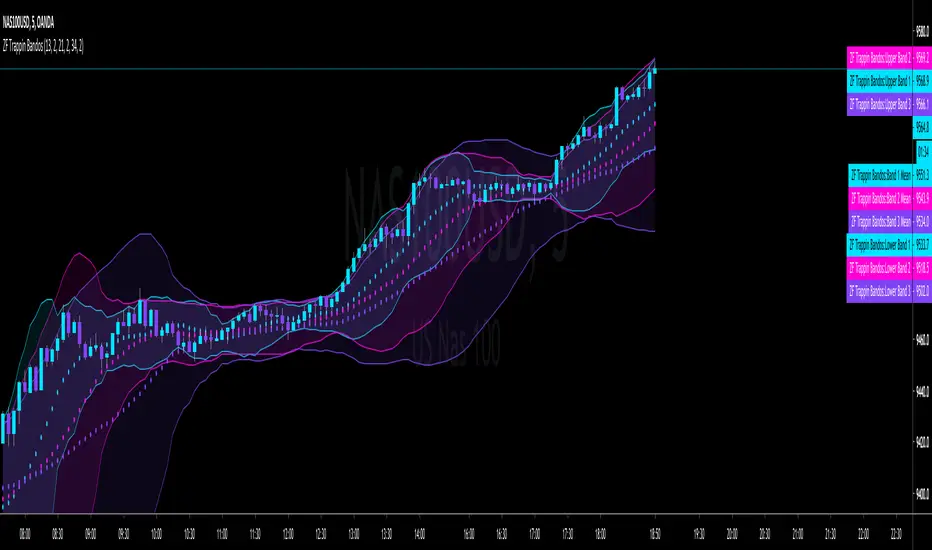
Trap Out The Bandos by ZFelds3 Deviation Bollinger Bands w/ Lookback Periods based on the Fibonacci sequence.
Median plot based on standard 2 deviation Bollinger Bands.
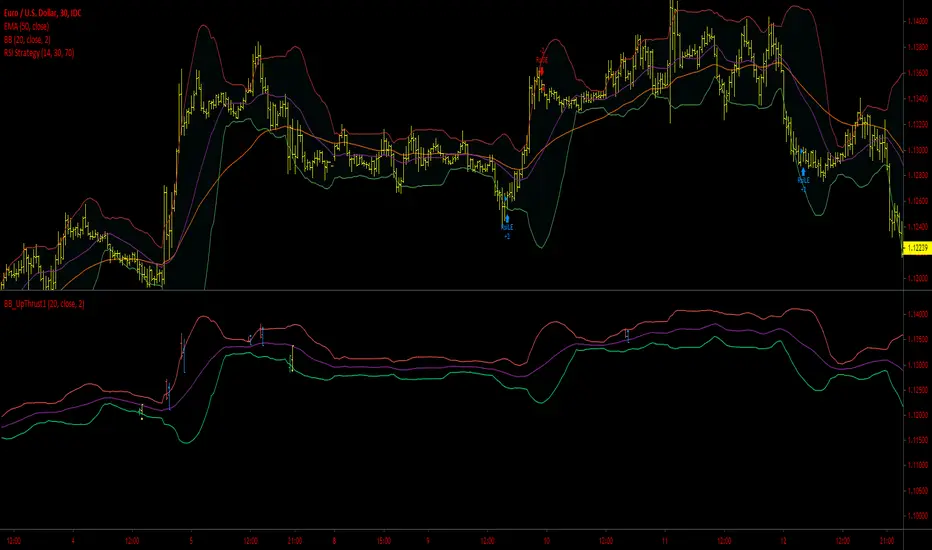
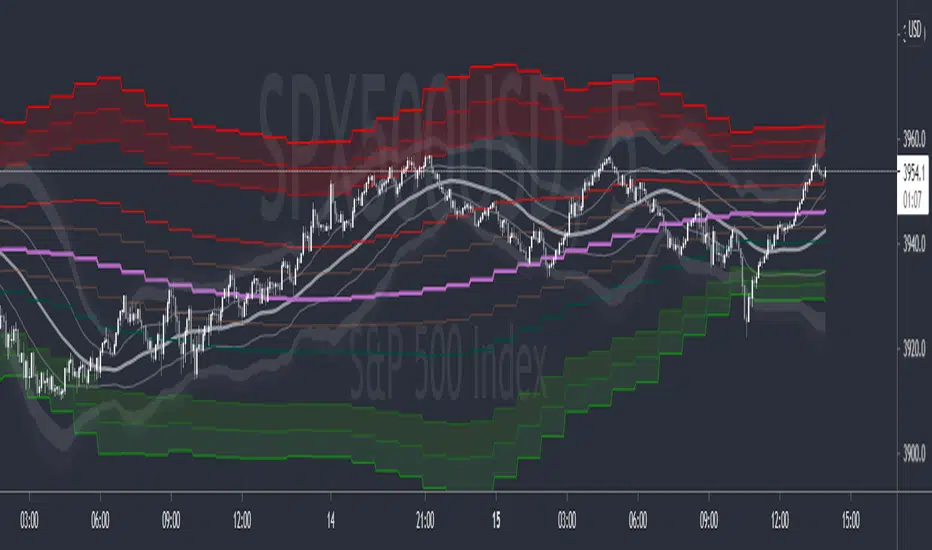
ORTI Bollinger Bands V3 (Static Timeframe Multi-Period)The "ORTI Bollinger Bands V3 (Static Timeframe Multi-Period MA)" is public scrypt, based in a previous study, but with some better functions (“ORTI Bollinger Bands V2 (Static Timeframe Multi-Period MA”).
This is a redesigned and recalculated set of the common plotted lines with the typical two "Standard Deviations" (positively and negatively) away from the original calculation of a "Simple Moving Average" of the security's price.
But now, with the option to convert the "Simple Moving Average" to adapt into 9 different kinds of "Moving Averages", to have a much more robust indicator which in turn would serve both as "Bollinger Bands" and by any of the most used "Moving Averages", a hybrid basically.
The following options to convert the "Simple Moving Average" ( SMA ) to:
• Exponential Moving Average ( EMA )
• Weighted Moving Average ( WMA )
• Arnaud Legoux Moving Average ( ALMA )
• Hull Moving Average ( HMA )
• Volume-weighted Moving Average ( VWMA )
• Least Square Moving Average ( LSMA )
• Smoothed Moving Average ( SMMA )
• Double Exponential Moving Average ( DEMA )
The cherry on the top , for this private version: is when you want to get a predetermined count in "natural temporalities" as minutes, hours or days, in any graph you could get a static average, and this count will be automatically respected. For example, a "Moving Average" could be configurated to know a trend per day, week or month... or whatever comes to mind, and at every single chart that you move through (5m, 15m, 1h, 4h, etc), you will see the same average to make your own "trend analysis" into a micro/macro market view.
As in traditional "Bollinger Bands", the "Standard Deviations" are still a measure of volatility , when markets become more volatile, bands widen, during the less volatile periods, the bands contract.
A common fact in trading is that, prices vary most of the time and there is a lot of truth in this assertion, since the markets consolidate mainly as bullish andbearish . Market trends are sometimes very rare, so trading them may not be as easy as you might think. If we look at prices in this way, we can define the trend as a deviation from the norm (rank).
Usually, most Traders use “Moving Averages” to identify commercial areas and analyze markets. A “Moving Average” helps the Trader isolate the trend a lot and can also indicate when a trend may be receding.
The importance of using any of the “Moving Averages” in the “Bollinger Bands”, becomes a reality and reveals the average price of a marketable instrument in a given period of time. However, there are different ways to calculate the averages, and that is why there are different types of “Moving Averages”. They are called "in motion" because, as the price moves, new data is added to the calculation, thus changing the average.
The base of the “Bollinger Bands” measures and represents the deviation or volatility of the price and this is the reason why they can be very useful to identify a trend. Even the use of two sets of “Bollinger Bands”, one generated with the parameter "one Standard Deviation" and the other with the typical configuration of "two Standard Deviations", can help us to see the price in a different way.
Another great advantage of “Bollinger Bands” is that, they adjust dynamically as volatility increases and decreases. As a result, the “Bollinger Bands” automatically expand and contract in synchronization with the price action, creating an envelope of precise trends.
Note: The previous calculation example is not the default, the parameters can be adjusted according to the criteria of the merchant.
As everyone knows, and as you can find on the internet, the "Moving Averages" are one of the most commonly used technical indicators in Stock, Futures , Forex and Crypto trading. Market analysts and traders, use "Moving Averages" to help identify trends in price fluctuations, smoothing out the noise and short-lived spikes (from news and earnings announcements, for example) for individual securities or indexes.
They are calculated by adding recent closing prices and then dividing that by the number of time periods in the calculation average. A simple, or arithmetic, a "Moving Average" that is calculated by adding the closing price of the security for several time periods and then dividing this total by that same number of periods. Short-term averages respond quickly to changes in the price of the underlying, while long-term averages are slow to react.
There are different types of "Moving Averages", calculated in different ways and over different time periods, which reveal different information for traders. The type of "Moving Average" and measurement period used determine the strategies a trader implements. So, many traders watch for short-term averages to cross above longer-term averages to signal the beginning of an uptrend. Short-term averages can act as levels of support when the price experiences a pullback.
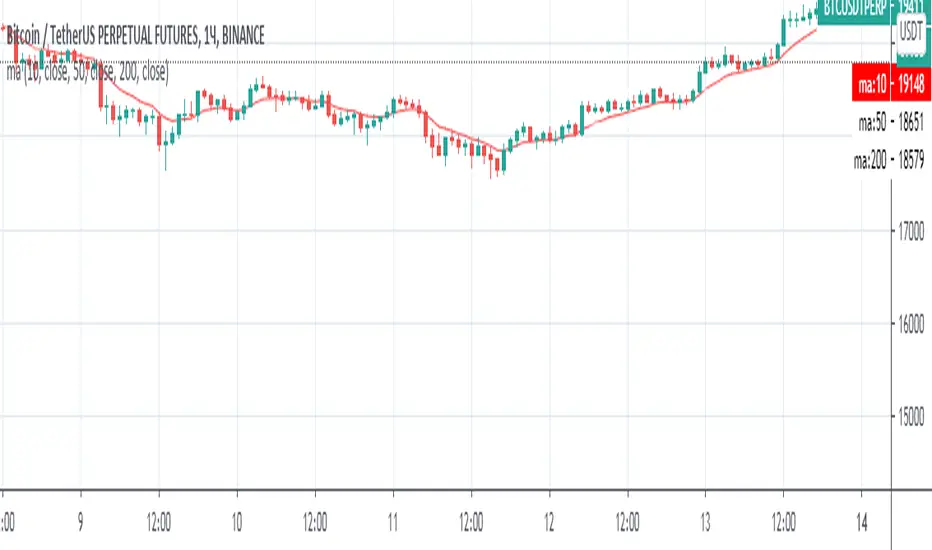
As is usual, traders and market analysts commonly use several periods in creating "Moving Averages" to plot on their charts. For identifying significant, long-term support and resistance levels and overall trends, but they only consider the 50-day, 100-day and 200-day moving averages as the most common. Based on historical statistics, these longer-term moving averages are considered more reliable trend indicators and less susceptible to temporary fluctuations in price.
There is such popular trading patterns that use "Simple Moving Averages" include the “death cross” and a “golden cross”. A “death cross” occurs when the short period "Moving Average" crosses below the long period "Moving Average" and this is considered abearish signal that further losses are in store; the “golden cross” occurs when a short-term "Moving Average" breaks above a long-term moving average, this can signal further gains are in store, that is interpreted as bearish .
The 5-, 10-, 20-, and 50-day moving averages are often used to spot near-term trend changes. Changes in direction by any of these shorter-term "Moving Averages" are watched as possible early clues to longer-term trend changes. Crossovers of the 50-day moving average by either the 10-day or 20-day "Moving Averages" are regarded as significant. The 10-day "Moving Average", plotted on an hourly chart, is frequently used to guide traders in intraday trading.
For more technical information: Investopedia
But why we have to use in our TECHNICAL ANALYSISthe same Moving Averages (10, 20, 30, 50, 100 and 200) for all time frame OHLC charts (1m, 5m, 15m, 1h, 4h, 1d, 1w and 1m)? That does not make any sense.
This is when you must go back to (statistic) basics: reliability and validity are a very important aspects of selecting a survey instrument. Reliability refers to the extent that the instrument yields the same results over multiple trials. Validity refers to the extent that the instrument measures what it was designed to measure.
Content validity measures the extent to which the items that comprise the scale accurately represent or measure the information that is being assessed. Are the real traders answering this question, that are asked representative of the possible data that they are trying to read? Well, I think maybe not.
Such as correlations, to verify the relevance of the “timeframe” questions, we could start at… Operation hours, the first data that has you should find may be is correlated with questions from: Does your trend indicator has a straight relationship of time under your time-analisys examination to determine if validity is present? If the scores are highly correlated, it is called convergent validity, then if convergent validity exists and validity is supported.
Criterion-related validity has to do with how well works the counting from the instrument, as a known outcome they are expected in a real, natural and measurable lapse time. Such as correlations are used to determine if criterion-related validity your counting data, would must be at: minutes, days, weeks, months, etc.
That is when we start with the rhythm, as in music. If your trading day in operation at Forex is made up of 24-hours, during 5-days of the week, there you have your first clue. Now, what did you want and have to measure? Well, first of all you need a daily, weekly and monthly count to begin with all your indicators.
For some reason, there are a lot of questions about time and calendars which all are answered by reference to astrology, because the original purpose of astrology was to create a reliable method of measuring the passage of time, the clock by which we live our lives: 12 Hours. It is very interesting!
Even though there are really 24 hours in a day, but therefore you would think we should have 12-time units in our day, not 24, each of which is twice as long as our current hour. But the only reason we would think like this is because we have forgotten about the way ancient astrology divides the time lapses into smaller units.
And now, the next step is when you should refresh your elementary school classes, those mathematics that I'm pretty sure you so hated: relation of prime numbers, compound numbers, divisible numbers and multiples.
You may think about the relationship that exists between the time period and the operative session, as well as the chart that you are consulting; so then, you must find the ideal configuration of those numbers that are only divisible between themselves and 1, or the numbers that besides being divisible by themselves and the unit and are also divisible by other numbers.
For example: for an hourly chart, if a day is divided into 24-hours in base of the number 12, is because it has a larger number of integer factors: 12/6=2, 12/4=3, 12/3=4, 12/2=6. Son then, all of your other indicators should find this relation.
This is when you must start questioning yourself, if you are really working with an adequate configuration of Moving Averages and Oscillators?
Another example:
• Relative Strength Index (14)
• Stochastic %K (14, 3, 3)
• Commodity Channel Index (20)
• Average Directional Index (14)
• Momentum (10)
• MACD Level (12, 26, 9)
• Stochastic RSI Fast (3, 3, 14, 14)
• Williams Percent Range (14)
• Ultimate Oscillator (7, 14, 28)
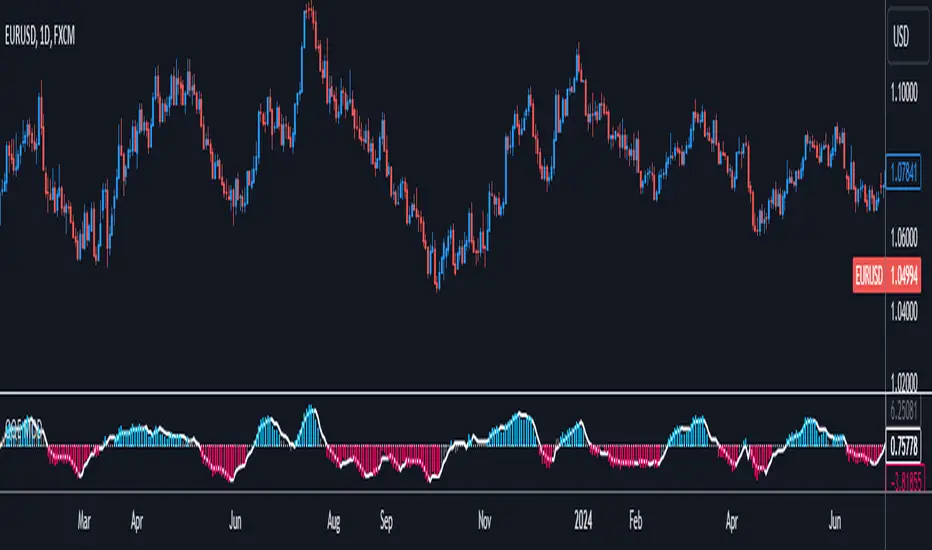
QQE MODSince there has been some demand for the QQE (Qualitative Quantitative Estimation ) figured I should upload my modified version of it as well.
The Orginal script is from Glaz, this is not my original idea - all I did was pretty much smash two QQEs together.
So there are Two QQEs in one script, right? One that is shown on the chart as columns, and the other "hidden" in the background which also has a 50 MA bollinger band acting as a zero line.
When both of them agree - you get a blue or a red bar.