CipherMatrix Dashboard (MarketCipher B)Pre-compute MarketCipher-B values for each fixed timeframe (5 m, 15 m, 30 m, 60 m, 4 H, Daily).
Pass those values into plotRow() instead of calling request.security() inside the helper—removes the style warning.
Added explicit range parameters to table.clear(dash, 0, 0, 2, 6) to satisfy v6’s argument requirement.
This version should compile without the previous warnings/errors. Swap in your real MarketCipher-B histogram when you’re ready, and the dashboard is good to go!
Candlestick analysis

CipherMatrix Dashboard (MarketCipher B)does it work. A lightweight, multi-time-frame overlay that turns MarketCipher B data into an at-a-glance dashboard:
Time-frames shown: current chart TF first, then 5 m, 15 m, 30 m, 1 H, 4 H, Daily.
Bias icons:
🌙 = bullish (MCB > 0)
🩸 = bearish (MCB < 0)
Signal icons:
⬆️ = histogram crosses above 0 (potential long)
⬇️ = histogram crosses below 0 (potential short)
Table location: bottom-right of chart; updates on every confirmed bar.

15min intervalsindicator displays 4 15 minute intervals within the hour. this simple indicator can be used for effective scalping.

9 EMA Angle + Price % Filter//@version=5
indicator("9 EMA Angle + Price % Filter", overlay=true)
length = 9
emaLine = ta.ema(close, length)
// === INPUTS ===
angleThreshold = input.float(20, "EMA Angle Threshold (°)")
pricePercentThreshold = input.float(80, "Price % Above/Below EMA")
// === PRICE DISTANCE FROM EMA IN % ===
percentAbove = close >= emaLine ? ((close - emaLine) / emaLine) * 100 : 0
percentBelow = close < emaLine ? ((emaLine - close) / emaLine) * 100 : 0
// === ANGLE CALCULATION ===
lookbackBars = input.int(5, "Bars for Angle Calculation")
p1 = emaLine
p2 = emaLine
deltaY = p1 - p2
deltaX = lookbackBars
angleRadians = math.atan(deltaY / deltaX)
angleDegrees = angleRadians * 180 / math.pi
// === CONDITIONS ===
isFlat = percentAbove < pricePercentThreshold and percentBelow < pricePercentThreshold and angleDegrees > -angleThreshold and angleDegrees < angleThreshold
isPriceAbove = percentAbove >= pricePercentThreshold
isPriceBelow = percentBelow >= pricePercentThreshold
isAngleUp = angleDegrees >= angleThreshold
isAngleDown = angleDegrees <= -angleThreshold
// === EMA COLOR LOGIC ===
emaColor = isFlat ? color.black :
isAngleUp or isPriceAbove ? color.green :
isAngleDown or isPriceBelow ? color.red : color.gray
// === PLOT EMA ===
plot(emaLine, "9 EMA", color=emaColor, linewidth=2)

9 EMA Angle Color Indicator//@version=5
indicator("9 EMA Angle Color Indicator", overlay=true)
// === INPUTS ===
emaLength = input.int(9, title="EMA Length")
angleThreshold = input.float(20.0, title="Angle Threshold (Degrees)", minval=0.1)
lookbackBars = input.int(5, title="Bars to Calculate Angle", minval=1)
// === EMA CALCULATION ===
emaValue = ta.ema(close, emaLength)
// === ANGLE CALCULATION (in degrees) ===
// Use simple slope * 100 and arc tangent conversion to degrees
slope = (emaValue - emaValue ) / lookbackBars
angle = math.atan(slope) * (180 / math.pi)
// === COLOR LOGIC ===
var color emaColor = color.black
// Initial color: black when angle is within range
emaColor := color.black
// Price and angle-based color change
if angle > angleThreshold and close > emaValue
emaColor := color.green
else if angle < -angleThreshold and close < emaValue
emaColor := color.red
else
emaColor := color.black
// === PLOT EMA ===
plot(emaValue, color=emaColor, linewidth=2, title="9 EMA Colored")

ITM 2x15// © 2025 Intraday Trading Machine
// This script is open-source. You may use and modify it, but please give credit.
// Colors the current 15-minute candle body green or red if the two previous candles were both bullish or bearish.
This script is designed for traders using the Scalping Intraday Trading Machine technique. It highlights when two consecutive 15-minute candles close in the same direction — either both bullish or both bearish.
For example, if you see two consecutive bearish candles, you might look for a long entry on a break above the high of the first bearish candle. This tool helps you visually identify these setups with clean, directional candle coloring — no clutter.
Supports & Resistances with MomentumSupports & Resistances with Momentum is an advanced indicator for scalping and intraday trading It shows dynamic support and resistance levels, clear BUY/SELL signals with TP targets and stop-loss lines, plus optional RSI and volume plots Fully customizable and designed for quick, precise trade decisions.

Last xHL📈 Last xHL – Visualize Key Highs and Lows
This script highlights the most recent significant highs and lows over a user-defined period, helping traders quickly identify key support and resistance zones.
🔍 Features:
Highest High (HH) and Highest Close/Open (HC) lines
Lowest Low (LL) and Lowest Close/Open (LC) lines
Dynamic updates with each new bar
Gradient-filled zones between HH–HC and LL–LC for visual clarity
⚙️ Customization:
Adjustable lookback period (_length) to suit your trading style
Color-coded lines and fills for quick interpretation
🧠 Use Case:
This tool is ideal for traders who want to:
Spot potential breakout or reversal zones
Identify price compression or expansion areas
Enhance their technical analysis with visual cues
This script is for educational and informational purposes only. It does not constitute financial advice. Always do your own research before making trading decisions.

FVG + RSI Sweep M15FVG + RSI Sweep M15 – Smart Liquidity Trading Indicator
This indicator is designed for high-probability intraday trading, optimized for the 15-minute timeframe (M15). It combines:
Fair Value Gap (FVG) detection – reveals price imbalance zones
RSI reversal signals – identifies overbought/oversold exhaustion
Liquidity sweep logic – confirms fakeouts beyond recent highs/lows
Time filter – focuses only on high-volume London & New York sessions
When all conditions align, it generates clean Buy/Sell signals, with automatic TP and SL levels based on risk–reward logic. Ideal for traders seeking 1–2 precise trades per day with minimal noise.

Unicorn Trade Indicator - EnhancedThis script displays breaker blocks and if the correct conditions are met it will indicate a unicorn entry with a yellow diamond.
Users need to experiment with setting the swing length option, I found 2 or 3 to work best.
I decided to build this indicator as I could not find an open source one that worked adequately
Enjoy

Frankfurt Front DoorOh meine bruider, hoffe ich dass du jetzt diese sehen kannst und dass wir machen ganz viel hak

Engulfing Swing Low Strategy Indicatorcisd with fvg entry model on the 1min this will help with finding the swing low and helping those struggling.

Second Pullback Finderlion pull back rocks, by using a familiar trend trading strategy, i have enhance a little more to this. correct positioning of market structure will help make these signals come alive

Breakout LabelsThis script labels the highest price of the lowest candle over a period of time. It then labels any bullish breakouts where the close price is higher than the high of the lowest candle.

Top 3 Largest RTH CandlesThis simply marks the top three sized candles to show potential momentum changes or swings.

Bullish & Bearish Wick MarkerMarks bullish and bearish engulfing candles
Bullish engulfing candle:
when the low is lower than the previous candle low and the body close is higher than the previous candle body
Bearish engulfing cande:
when the high is higher than the previous candle high and the body close is lower than the previous candle body


SMMA Cross Strategy stopsuzThey were formed by the intersections of 2 SMMA moving averages. You can adjust the parameter and make profit.

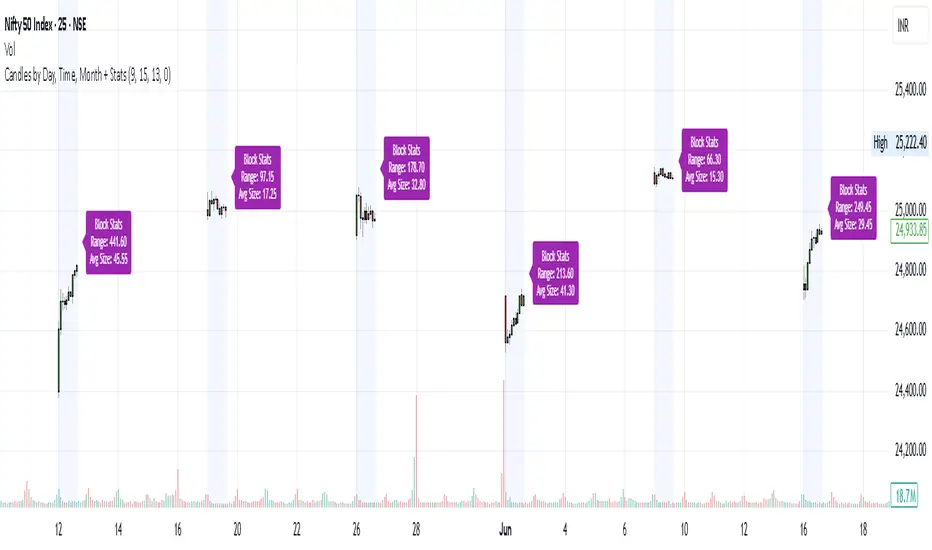
Candles by Day, Time, Month + StatsThis Pine Script allows you to filter and display candles based on:
📅 Specific days of the week
🕒 Custom intraday time ranges (e.g., 9:15 to 10:30)
📆 Selected months
📊 Shows stats for each filtered block:
🔼 Range (High – Low)
📏 Average candle body size
⚙️ Key Features:
✅ Filter by day, time, and month
🎛 Toggle to show/hide the stats label
🟩 Candles are drawn only for selected conditions
📍 Stats label is positioned above session high (adjustable)
⚠️ Important Setup Instructions:
✅ 1. Use it on a blank chart
To avoid overlaying with default candles:
Open the chart of your preferred symbol
Click on the chart type (top toolbar: "Candles", "Bars", etc.)
Select "Blank" from the dropdown (this will hide all native candles)
Apply this indicator
This ensures only the filtered candles from the script are visible.
Adjust for your local timezone
This script uses a hardcoded timezone: "Asia/Kolkata"
If you are in a different timezone, change it to your own (e.g. "America/New_York", "Europe/London", etc.) in all instances of:
time(timeframe.period, "Asia/Kolkata")
timestamp("Asia/Kolkata", ...)
Use Cases:
Opening range behavior on specific weekdays/months
Detecting market anomalies during exact windows
Building visual logs of preferred trade hours
TVI-3 Z-Score: MA + VWAP + BB Composite🔧 Overview:
It combines:
Z-score of price relative to the 200-period simple moving average (MA)
Z-score of price relative to the 200-period VWAP (volume-weighted average price)
Z-score of Bollinger Band width
The result is an average of these three Z-scores, plotted as a composite indicator for identifying overvalued and undervalued conditions.

Normalized Reserve Risk (Proxy Z-Score)normalised version of the reserve risk indicator on btc magazine because the btc magazine one is poo .

minchang volume tradingCondition
Point color
Volume ≥ 3× MA(24)
Violet
Volume ≥ 1.5× MA(24)
Red
Volume < 1.5× MA(24) & bullish
White
Volume < 1.5× MA(24) & bearish
Black

Nến Tô Màu Theo Volume / MA(21)Condition
Point color
Volume ≥ 3× MA(24)
Violet
Volume ≥ 1.5× MA(24)
Red
Volume < 1.5× MA(24) & bullish
White
Volume < 1.5× MA(24) & bearish
Black
