Candlestick analysis

Relative Volume Candle Shaderthis indicator is based on the work of M0rty's "candle color by volume z-score"
I've taken M0rty's indicator a few steps further to yield a wider range of outputs, showing both extreme high and extreme lows of volume in 2 gradients.
the brightness of the candle is based on the z-score. brighter candles have unusually high volume, and dimmer candles have unusually low volume.

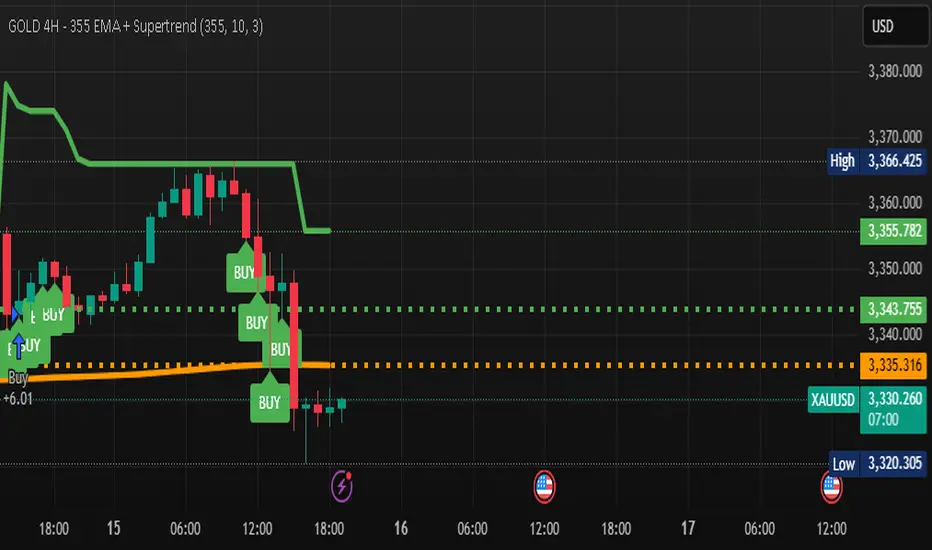
GOLD 4H - 355 EMA + Supertrendwhen using this strategy any time the Current price of the asset you are trading crosses ABOVE THE 355 EMA you BUY and when it crosses BELLOW THE 355 EMA YOU SELL

GOLD 4H - 355 EMA + Supertrendwhen trading this strategy you only BUY when the current Market Price is Above the 355 EMA and only short or SELL the the current Market Price is Bellow the 355 EMA as we fellow the Super tend direction as well
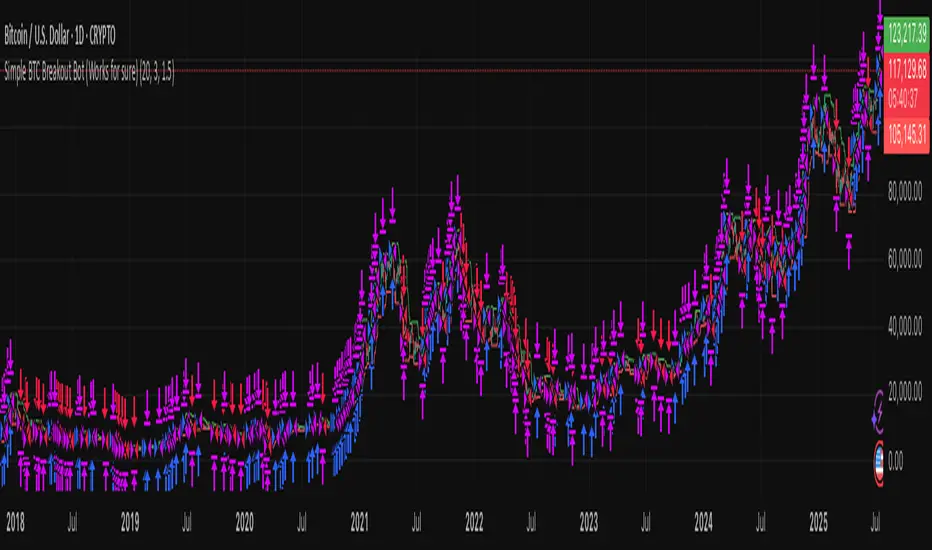
Simple BTC Breakout Bot (Works for sure)🚀 Simple BTC Breakout Bot (Works for sure)
This strategy is designed for BTC/USDT breakout trading using recent highs and lows. It automatically detects breakout signals and manages trades with Take Profit and Stop Loss to help manage risk and lock in profits.
Key Features:
🔍 Breakout Detection:
Enters a long position when price crosses above the highest high of the last N candles (default 20).
Enters a short position when price crosses below the lowest low of the last N candles.
💰 Risk Management:
Automatically sets a Take Profit (default 3%) and Stop Loss (default 1.5%) for every trade.
📊 Visuals:
Plots breakout levels (highest high in green, lowest low in red) on the chart.
🔔 Alerts:
Sends alerts on every breakout trade for long and short entries, compatible with TradingView’s alert system.
Parameters:
⏳ Breakout Lookback Period: Number of candles to check for breakouts (default: 20)
🎯 Take Profit (%): Profit target as a percentage from entry price (default: 3%)
🚫 Stop Loss (%): Maximum loss allowed as a percentage from entry price (default: 1.5%)
⚠️ Disclaimer:
This strategy is based on historical data and does not guarantee future profits. Always backtest and trade with proper risk management.
1H & 2H Candle Panel + Daily Grid v1.2Indicator: "1H & 2H Candle Panel + Daily Grid v1.2"
This powerful indicator combines two key features into one tool:
Daily Grid anchored to the previous day’s close
Multi-Timeframe Candle Panel for comprehensive market analysis
1. Daily Grid Logic
Input:
Grid Distance (Points): Adjustable spacing between grid lines (default: 5.0 pts).
How It Works:
Detects the start of a new trading day using ta.change(time("D")).
Fetches the prior day’s close via request.security().
Draws the following elements at each new session:
Thick Red Line: Previous day’s closing price (key reference level).
8-Point Grid:
4 blue lines above the close (+1x to +4x the grid distance).
4 gold lines below the close (-1x to -4x the grid distance).
Info Label: Displays the exact prior close value.
Automatically clears and redraws all elements daily to avoid clutter.
2. Multi-Timeframe Candle Panel
Timeframes Analyzed:
Current chart TF, 30M, 1H, 2H, 3H, 4H, 6H, 12H, and Daily (1D).
Data Displayed per TF:
Open, Close, High, Low
Price Difference (Close − Open)
Candle Type (Bullish/Bearish)
Time remaining until candle close (hh:mm:ss format)
Visual Output:
A right-aligned table with conditional coloring:
Bullish candles: Green background
Bearish candles: Red background
Current timeframe highlighted in purple.
Optimized Updates:
Uses request.security() for efficient cross-TF data fetching.
Tracks candle closing times via TradingView’s native time_close.
Updates only on the last bar or in real-time (barstate.islast/isrealtime).
3. Confluence Signals
Full Confluence:
Triggers when all timeframes align:
Buy Signal: All candles bullish → Green arrow + alert.
Sell Signal: All candles bearish → Red arrow + alert.
1H Special Confluence:
Activates 30 minutes after the 1H candle opens.
Requires alignment between 1H, 4H, and 6H candles.
Marks entries with price-level arrows (no alerts).
4. Technical Optimizations
Performance:
Dynamically manages graphic objects (no redundant redrawing).
Uses arrays to track grid lines efficiently.
Precision:
Leverages TradingView’s time_close for accurate countdowns.
Formats prices with format.mintick for asset-specific precision.
How to Use
Adjust Grid Distance based on asset volatility.
Monitor the panel for multi-TF trend strength.
Use the daily grid as support/resistance reference.
Confluence signals highlight high-probability setups.
Pro Tip: Combine with volume analysis or RSI for confirmation!

GOLD 4H - 355 EMA + Supertrendwhen the price is above the 355 EMA look for along BUY when the price is bellow 355 you look for a short SELL

Light MA CrossExplanation of the "Light MA Cross" Indicator
Overview:
The "Light MA Cross" is a simple yet powerful trading indicator designed to identify potential buy and sell signals based on the crossover of two moving averages. This tool is optimized for short-term trading, specifically on 1-minute charts, making it ideal for active traders looking to capture quick market moves.

EMA10/14 Crossover + Body Filter (Clean Version)📌 อินดิเคเตอร์นี้ใช้สำหรับจับสัญญาณเข้าออเดอร์ตามระบบ EMA10/EMA14 Crossover พร้อมตัวกรองจากลักษณะ “เนื้อเทียน” (Candle Body) ซึ่งช่วยลดสัญญาณหลอก (Fake Signal) ได้ดี เหมาะสำหรับผู้ที่ดูเทรนด์จาก TF ใหญ่ แล้วใช้ TF เล็กในการเข้าไม้
✅ คุณสมบัติ:
- สัญญาณ Buy เมื่อ EMA10 ตัด EMA14 ขึ้น + เนื้อเทียนอยู่เหนือเส้น
- สัญญาณ Sell เมื่อ EMA10 ตัด EMA14 ลง + เนื้อเทียนอยู่ใต้เส้น
- มีลูกศรแสดงสัญญาณบนกราฟชัดเจน
- ใช้ยืนยันจุดเข้าไม้ได้ดีในระบบเทรนด์หรือ SMC
⚠️ หมายเหตุ:
อินดิเคเตอร์นี้ไม่ได้ใช้เทรดเดี่ยวๆ แต่ควรใช้ร่วมกับการวิเคราะห์ TF ใหญ่ และโซน Demand/Supply ที่คุณวิเคราะห์เอง
— — — — — — — — — — — —
📌 This indicator is designed to capture trading signals based on EMA10/EMA14 crossover with a candle body filter to reduce fake signals. It is ideal for traders who follow higher timeframe trend analysis and use lower timeframes for precise entries.
✅ Features:
- Buy signal when EMA10 crosses above EMA14 and the candle body is above both lines
- Sell signal when EMA10 crosses below EMA14 and the candle body is below both lines
- Clear arrow markers on the chart for visual confirmation
- Excellent for confirming entries in trend-based or SMC-based strategies
⚠️ Note:
This tool is not meant to be used alone. For optimal performance, combine it with higher timeframe structure and manually identified supply/demand zones.

Manipulation Candle SignalsManipulation Candle signal. Good signal to be aware when there is a liquidity sweep from the previous candle high or low, and a continuation in the trend. Most recomended in 30 min and 1HR time frame for day trade

First 15 Min H/L Breakout Signal V3 - Session Aware (Adaptive)this script checks the breakout on 1min time frame as compared to previous breakouts happened on 15min and 5min.

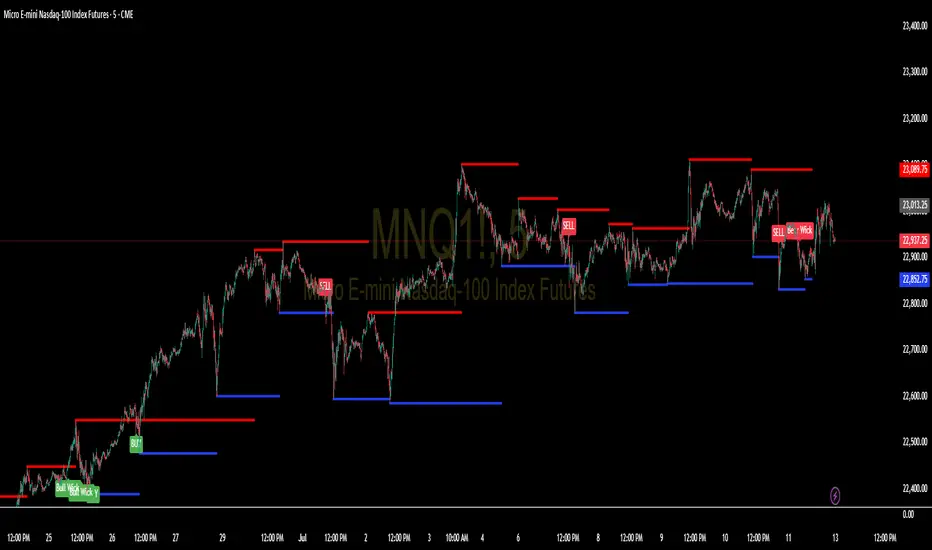
Support and Resistance Levels with BreaksThis indicator identifies dynamic support and resistance levels using pivot point analysis and provides clear trading signals when these levels are broken with volume confirmation. Enhanced version with improved signal clarity for better trading decisions.
## 🔧 Key Features
### Support & Resistance Detection
- Automatically identifies key pivot high and low levels
- Draws clear visual lines (red for resistance, blue for support)
- Configurable sensitivity with left/right bar settings
### Enhanced Trading Signals
- **BUY** signals when resistance is broken with volume confirmation
- **SELL** signals when support is broken with volume confirmation
- **Bull Wick** alerts for potential reversals at resistance
- **Bear Wick** alerts for potential reversals at support
### Volume Confirmation
- Built-in volume oscillator using 5 and 10-period EMAs
- Filters out low-volume false breakouts
- Adjustable volume threshold (default: 20%)
### Complete Alert System
- Support Broken alerts
- Resistance Broken alerts
- Bull Wick reversal alerts
- Bear Wick reversal alerts
## ⚙️ Settings
- **Show Breaks**: Toggle signal display
- **Left Bars**: Pivot detection lookback (default: 15)
- **Right Bars**: Pivot detection lookforward (default: 15)
- **Volume Threshold**: Minimum volume increase for valid signals (default: 20%)
## 📈 Best For
- Swing trading strategies
- Breakout confirmation
- Support/resistance trading
- Volume-based entry signals
## 🔍 How It Works
1. Identifies pivot highs/lows using configurable periods
2. Calculates volume oscillator for confirmation
3. Generates BUY signals on resistance breaks with volume
4. Generates SELL signals on support breaks with volume
5. Detects wick patterns for potential reversals
## 📋 Updates in This Version
- Enhanced BUY/SELL signal clarity (replaced generic "B" labels)
- Added Bull Wick and Bear Wick alert conditions
- Updated to Pine Script v6 compatibility
- Improved signal filtering and accuracy
## ⚠️ Disclaimer
This indicator is for educational and informational purposes only. Always conduct your own analysis and risk management before making trading decisions. Past performance does not guarantee future results.
---
**Original Script**: "Support and Resistance Levels with Breaks" by LuxAlgo
**License**: CC BY-NC-SA 4.0
**Enhanced by**: profitgang
**Version**: Pine Script v6
Daily Price Change (%)Description:
This script displays the percentage change of the last N candles either above each bar or along a shared horizontal line.
You can choose between two calculation methods:
Close vs Previous Close
Open vs Close
Labels are fully customizable:
Adjustable text size
Custom background color
Number of candles to display
Fixed 10% spacing above candles (prevents overlap)
Ideal for visualizing short-term momentum and price action in a clean, non-intrusive format.
Examples:
Disclaimer:
This script is provided for informational and educational purposes only.
The author assumes no liability for any financial losses, software errors, or misinterpretations.
Always do your own research and use trading tools at your own risk.

Essa - Market Structure DetectorA comprehensive tool for identifying real-time market structure patterns using pivot analysis, adaptive volatility filtering, and multi-timeframe confluence. This script highlights higher highs (HH), higher lows (HL), lower highs (LH), and lower lows (LL), while offering intelligent confirmations and optional visual aids.
Key Features:
Dynamic detection of HH, HL, LH, LL based on pivot structures
Adaptive sensitivity using ATR-based volatility filters
Confirmation logic based on breakout alignment
Optional ZigZag line rendering between key pivots
Customisable labels with confluence indicators
Multi-timeframe pattern scanning with auto-scaling timeframes
Info panel showing current pattern, trend bias, mode, and structure across 5 higher timeframes
Built-in alerts for structure shifts and high-confluence setups
This tool is ideal for traders who rely on structure-based entries, multi-timeframe confluence, and precision pattern recognition to anticipate trend reversals or continuations with high confidence.

Essa - Enhanced Fibonacci Confluence ToolkitA precision-engineered trading tool designed to identify high-probability reversal zones using price action alone. This version expands on traditional Fibonacci confluence techniques by integrating a multi-tiered market structure framework and advanced state management.
Key Features:
Fully automated CHoCH (Change of Character) detection
Tiered market structure logic (Short, Intermediate, Long-Term)
Dynamic Area of Interest (AOI) zone rendering
Automatic Fibonacci retracement plotting from swing highs/lows
Customisable Fibonacci levels (0% to 100%, including 23.6%, 61.8%, 65%, 78.6%)
Real-time Fibonacci invalidation logic with on-chart alerts
Bullish and bearish engulfing candle detection with structure-based filtering
Configurable swing labels (◉, △▽, H/L) with size control
Adjustable CHoCH line styles and widths
Optional display of Fibonacci level labels
Modular and efficient codebase with object-oriented architecture
Originally inspired by the LuxAlgo Fibonacci Confluence Toolkit (v5). Credit to LuxAlgo for the foundational concept.

Recent Pullback Percentage//@version=5
indicator("Recent Pullback Percentage", shorttitle="Pullback %", format=format.percent)
// 定義回顧期間
lookbackPeriod = input.int(60, title="Lookback Period")
// 找到近期最高價
highestHigh = ta.highest(high, lookbackPeriod)
// 計算回檔百分比
pullbackPercent = ((close - highestHigh) / highestHigh)
plot(pullbackPercent, title="Pullback Percentage")

Weekend Trap
Weekend Trap Indicator
A comprehensive weekend range analysis tool designed to identify and track low-liquidity weekend price movements with advanced market maker detection.
What is the Weekend Trap?
The Weekend Trap refers to price ranges established during low-liquidity weekend periods (Saturday 5:00 AM to Monday 5:00 AM Perth time) when institutional trading is minimal.
Key Features
📊 Weekend Range Detection
Automatically identifies weekend periods based on Perth timezone
Creates visual rectangles showing weekend high/low ranges
Displays 50% midline for key pivot levels
Configurable range cutoff (default: Sunday 3:00 PM)
🎯 Advanced Market Maker Detection
PVSRA-style volume analysis for institutional activity identification
4-color coding system:
🟢 Lime: 200% Bull volume (Peak volume + bullish candle)
🔴 Red: 200% Bear volume (Peak volume + bearish candle)
🔵 Blue: 150% Bull volume (Rising volume + bullish candle)
🟣 Fuchsia: 150% Bear volume (Rising volume + bearish candle)
Weighted volume calculation for better peak detection
Circles positioned above bars for clear visualization
📈 Range Analytics
Clean range labels showing:
Absolute price range
Percentage movement
Historical analysis with configurable lookback period
Current weekend tracking with real-time updates
Settings Overview
Core Settings
Weeks to Backtest (1-52): Number of completed weekends to display
Show Weekend Trap Rectangles: Toggle rectangle visibility
Use Wicks for Rectangle Height: Include wicks vs. body-only ranges
Sunday Range Cutoff Hour: When to stop updating weekend range
Visual Customization
Rectangle colors and borders
Market maker marker sizes (tiny to large)
PVSRA color scheme for different volume levels
Label display options
Market Maker Detection
Automatic PVSRA analysis during weekend periods
150% threshold: Volume ≥ 150% of 10-period average
200% threshold: Volume ≥ 200% of average OR weighted volume peak
Real-time detection with immediate visual feedback
How to Use
Add to your chart (works on any timeframe, recommended: 1H-4H)
Set your preferred lookback period (default: 4 weeks)
Observe weekend ranges and note market maker activity
Monitor volume spikes indicated by colored circles
Analysis Applications
Weekend Range Analysis
Identify price ranges during low-liquidity periods
Track historical weekend price movements
Analyze range size and frequency patterns
Market Maker Detection
Identify institutional accumulation/distribution
Spot manipulation during low-liquidity periods
Analyze volume patterns and anomalies
Historical Pattern Recognition
Weekend range comparison across multiple periods
Multiple timeframe analysis capability
Volume pattern identification
Technical Details
Timezone: Australia/Perth (GMT+8)
Weekend Period: Saturday 5:00 AM → Monday 5:00 AM
Volume Analysis: 10-period moving average baseline
Weighted Volume: Volume × (High - Low) for peak detection
Object Management: Automatic cleanup based on lookback period
Best Practices
Use on liquid markets (major forex pairs, crypto, indices)
Adjust lookback period based on analysis timeframe
Monitor during Asia-Pacific trading hours for best results
Consider fundamental events that may affect weekend gaps
Credits
Volume analysis inspired by PVSRA (Price Volume Spread Range Analysis) methodology for institutional activity detection.
This indicator is designed for educational and analysis purposes.

SuperPerformance_V1.24SuperPerformance V1.24 - Advanced Performance Analysis Indicator
🎯 CORE FEATURES
📊 Performance Analysis
• Stock vs Index comparison across 6 timeframes (1D to 200D)
• Conviction scoring system (Perfect/Solid/Good/Ok/Weak/Poor)
• Real-time outperformance tracking with ✓/✗ indicators
🏢 Sector Analysis
• Top 5 sector ranking with live performance data
• 10 Indian market sectors tracking (PHARMA, TECH, FINANCE, etc.)
• Automatic sector identification for current stock
📈 Technical Tools
• Triple Moving Averages (SMA/EMA/WMA/HMA)
• Distance from MA analysis with percentage/spread calculations
• Enhanced hover tooltips showing distance info
🔔 Smart Alerts
• Dynamic Circuit Breakers (20%/10%/5%/2%) that adapt to volatility
• Extreme distance alerts when price deviates significantly from MA
🎨 Visual Interface
• 4 customizable tables: Stock Performance, Sector Performance, Distance Analysis, Sector Display
• Dark/Light themes with professional styling
• Flexible positioning - place tables anywhere on chart
• Mini mode for compact display
⚡ Advanced Features
• Real-time data from 10+ Indian indices
• Granular controls - show/hide any columns or rows
• Multiple tooltip methods (Labels/Data Window)
• Professional color coding for quick analysis
🎯 PERFECT FOR:
Indian stock traders, sector rotation analysis, performance monitoring, and technical analysis with institutional-grade features.
📌 KEY BENEFITS:
✅ Multi-timeframe performance tracking
✅ Sector rotation insights
✅ Advanced moving average analysis
✅ Professional-grade visualization
✅ Customizable alerts and notifications
✅ Indian market focus with NSE data integration
🔧 TECHNICAL SPECIFICATIONS:
• Pine Script v5 compatible
• Overlay indicator
• Real-time data processing
• Memory optimized
• Multi-security data support
• Professional color schemes

Custom Multiple SMAsThe Custom Breakout Indicator provides visual guidance for identifying entry and exit signals within the BreakoutCatcher strategy. It consists of a fan of multiple Simple Moving Averages (SMAs) that make current market conditions visually accessible:
Flat, tightly clustered fan → Market is consolidating
First candle closing outside the fan → Potential entry signal (breakout)
Wide, rapidly expanding fan → Market is overheated, avoid entries
Additionally, the indicator displays a yellow trendline (EMA 100) as an overarching trend filter:
Price above EMA 100 → Consider only long signals
Price below EMA 100 → Consider only short signals
🔗 Part of the BreakoutCatcher strategy – available at: www.twn-trading.com
✔️ Fully functional on all timeframes

Variance and Moving Averages StrategyThe Variance and Moving Averages Strategy is a long-only trend-following system that combines volatility filtering with classic moving-average signals. It computes 5-, 15-, and 30-period simple moving averages (MA5, MA15, MA30) to identify a clear uptrend (MA5 > MA15 > MA30) and only enters when recent price variance (measured over the past 30 bars as the variance of (high–low)/close) is very low—avoiding choppy or noisy conditions. Once in a position, it employs a dual exit: a trend-based stop-loss (closing when MA5 falls below MA30) and a volatility-based take-profit (exiting when variance spikes above a high threshold), thus “buying low-volatility breakouts” and “selling on trend reversal or volatility expansion.”


5-Indicator Swing StrategyCustom 5-Indicator Swing Strategy for 4H Chart
---
Key Features:
1. Price Uptrend Detection
Uses 50-period EMA as trend filter
Only takes long positions when price is above EMA
2. RSI Momentum Confirmation
RSI must be above 40 and rising (3-bar confirmation)
Includes overbought exit at RSI > 70
3. MACD Bullish Crossover
Detects when MACD line crosses above signal line
Uses standard 12/26/9 settings (customizable)
4. Volume Spike Detection
Identifies volume spikes 1.5x above 20-period average
Confirms breakout strength
5. Fibonacci Retracement Levels
Calculates dynamic Fibonacci levels from recent swing high/low
Enters when price is near 38.2% to 61.8% support levels
Additional Features:
Risk Management: Stop Loss: 2 x ATR below entry price / Take Profit: 3 x ATR above entry price
ATR Length: 14 periods
Visual Indicators: Clear entry/exit signals with shapes
Information Table: Real-time status of all 5 conditions
Multi-Panel Display: RSI, MACD, and Volume in separate panels
Customizable Parameters: All inputs can be adjusted
Alert System: Built-in alerts for entry and exit signals

Nadaraya,poly100,MA ribbon,volume nến,RSInadaraya
polynomial 100
volume nến
rsi break out 75,25
MA Ribbon
