Volume Spikes Pro - relative volume comparisonThe Enhanced Volume Spike Detector builds on the basic relative volume comparison by adding price direction analysis and more sophisticated categorization of volume events.
Directional Analysis
This indicator doesn't just identify volume spikes, but categorizes them as:
- **Bullish**: Volume spike with upward price movement
- **Bearish**: Volume spike with downward price movement
- **Neutral**: Volume spike with minimal price change
- **Strong**: Exceptional volume spike (2.5x+ default) regardless of direction
Visual Classification
Different color schemes instantly communicate the volume spike type:
- Green for bullish volume (price rising)
- Red for bearish volume (price falling)
- Dark Green for strong bullish volume
- Dark Red for strong bearish volume (price falling)
Customization Tips
- For day trading or short timeframes: Consider reducing MA length to 10-15
- For swing trading: The default 20 is appropriate
- For position trading or longer timeframes: Consider increasing to 30-50
- For more selective signals: Increase multiplier to 2.0 or higher
- For more comprehensive detection: Decrease multiplier to 1.3-1.4
Candlestick analysis

XTE+ Optimized Trend Tracker📊 XTE+ Optimized Trend Tracker (OTT)
XTE+ OTT is a powerful, trend-following indicator designed for traders who value clarity, precision, and advanced analytics. It offers not only accurate entry and exit signals but also visual zones, historical signal analysis, and real-time trend monitoring.
🧠 How It Works
XTE+ OTT is based on an improved version of the Optimized Trend Tracker. It utilizes multiple customizable moving average types (VAR, EMA, SMA, WMA, and more) combined with volatility filtering (ATR logic) to generate cleaner, more reliable trend-following signals.
✅ Features
Trend Direction Detection with automatic switch logic
Buy/Sell Signal Icons with distinct large markers
Entry/Exit Zones drawn visually on chart
Custom Take-Profit / Stop-Loss settings for Buy and Sell signals
Statistical Panel showing:
Current Trend (Up/Down)
Number of total signals
Number of winning trades
Win percentage
Configurable Display Options:
Show/hide signals
Show/hide trend zones
Show/hide OTT and MA lines
Supports multiple MA types including EMA, SMA, VAR, ZLEMA, TSF and more
Non-repainting logic — signals are confirmed at bar close
⚙️ Inputs and Customization
OTT Period & Sensitivity (%)
MA Type Selection (VAR, EMA, etc.)
Entry Zone Visualization On/Off
Trend Panel Display On/Off
TP/SL % per direction (Buy/Sell separately)
Option to disable MA or OTT line display
📈 Visuals
Signal icons: BUY (Green Up Label), SELL (Red Down Label)
Entry zones: circles near breakout levels
Trendlines change color dynamically (green for uptrend, red for downtrend)
Trend Panel is pinned in the top-right corner for quick reference
💡 Usage Tips
Best used on higher timeframes (15min, 1H, 4H+) for more meaningful trend signals
Combine with volume/volatility indicators or support/resistance zones for enhanced decision making
Use TP/SL logic to track signal success over time and optimize strategies
📌 Disclaimer
This script is for educational and informational purposes only. It is not financial advice. Always test and validate your strategy before applying it in live markets.

JW Momentum IndicatorJW Momentum Indicator
This indicator provides clear and actionable buy/sell signals based on a combination of volume-enhanced momentum, divergence detection, and volatility adjustment. It's designed to identify potential trend reversals and momentum shifts with a focus on high-probability setups.
Key Features:
Volume-Enhanced Momentum: The indicator calculates a custom oscillator that combines momentum with volume, giving more weight to momentum when volume is significant. This helps to identify strong momentum moves.
Divergence Detection: It detects bullish and bearish divergences using pivot highs and lows, highlighting potential trend reversals.
Volatility-Adjusted Signals: The indicator adjusts signal sensitivity based on the Average True Range (ATR), making it more reliable in varying market conditions.
Clear Visuals: Buy and sell signals are clearly indicated with up and down triangles, while divergences are highlighted with distinct labels.
How to Use:
Buy Signals: Look for green up triangles or bullish divergence labels.
Sell Signals: Look for red down triangles or bearish divergence labels.
Oscillator and Thresholds: Use the plotted oscillator and thresholds to confirm signal strength.
Parameters:
Momentum Period: Adjusts the length of the momentum calculation.
Volume Average Period: Adjusts the length of the volume average calculation.
Volatility Period: Adjusts the length of the ATR calculation.
Volatility Multiplier: Adjusts the sensitivity of the volatility-adjusted signals.
Disclaimer:
This indicator is for informational purposes only and should not be considered financial advice. Always conduct 1 thorough research and use appropriate risk management techniques when trading.

TrendSync Pro (SMC)📊 TrendSync Pro (SMC) – Advanced Trend-Following Strategy with HTF Alignment
Created by Shubham Singh
🔍 Strategy Overview
TrendSync Pro (SMC) is a precision-based smart trend-following strategy inspired by Smart Money Concepts (SMC). It combines: Real-time pivot-based trendline detection
Higher Time Frame (HTF) filtering to align trades with dominant trend
Risk management via adjustable Stop Loss (SL) and Take Profit (TP)
Directional control — trade only bullish, bearish, or both setups
Realistic backtesting using commissions and slippage
Pre-optimized profiles for scalpers, intraday, swing, and long-term traders
🧠 How It Works:
🔧 Strategy Settings Image:
beeimg.com
The strategy dynamically identifies trend direction by using swing high/low pivots. When a new pivot forms: It draws a trendline from the last significant pivot
Detects whether the trend is up (based on pivot lows) or down (based on pivot highs)
Waits for price to break above/below the trendline
Confirms with HTF price direction (HTF close > previous HTF close = bullish)
Only then it triggers a long or short trade
It exits either at TP, SL, or a manual trendline break
🛠️ Adjustable Parameters:
Trend Period: Length for pivot detection (affects sensitivity of trendlines)
HTF Timeframe: Aligns lower timeframe entries with higher timeframe direction
SL% and TP%: Customize your risk-reward profile
Commission & Slippage: Make backtests more realistic
Trade Direction: Choose to trade: Long only, Short only, or Both
🎛️ Trade Direction Control:
In settings, you can choose: Bullish Only: Executes only long entries
Bearish Only: Executes only short entries
Both: Executes both long and short entries when conditions are met
This allows you to align trades with your own market bias or external analysis.
📈 Entry Logic: Long Entry:
• Price crosses above trendline
• HTF is bullish (HTF close > previous close)
• Latest pivot is a low (trend is considered up)
Short Entry:
• Price crosses below trendline
• HTF is bearish (HTF close < previous close)
• Latest pivot is a high (trend is considered down)
📉 Exit Logic: Hit Take Profit or Stop Loss
Manual trendline invalidation: If price crosses opposite of the trend direction
⏰ Best Timeframes & Recommended Settings:
Scalping (1m to 5m):
HTF = 15m | Trend Period = 7
SL = 0.5% | TP = 1% to 2%
Intraday (15m to 30m):
HTF = 1H | Trend Period = 10–14
SL = 0.75% | TP = 2% to 3%
6 Hour Trading (30m to 1H):
HTF = 4H | Trend Period = 20
SL = 1% | TP = 4% to 6%
Swing Trading (4H to 1D):
HTF = 1D | Trend Period = 35
SL = 2% | TP = 8% to 12%
Long-Term Investing (1D+):
HTF = 1W | Trend Period = 50
SL = 3% | TP = 15%+
Note: These are recommended base settings. Adjust based on volatility, asset class, or personal trading style.
📸 Testing Note:
beeimg.com
TradingView limits test length to 20k bars (~40 trades on smaller timeframes). To show long-term results: Test on higher timeframes (e.g., 1H, 4H, 1D)
Share images of backtest result in description
Host longer test result screenshots on Imgur or any public drive
📍 Asset Behavior Insight:
This strategy works on multiple assets, including BTC, ETH, etc.
Performance varies by trend strength:
Sometimes BTC performs better than ETH
Other times ETH gives better results
That’s normal as both assets follow different volatility and trend behavior
It’s a trend-following setup. Longer and clearer the trend → better the results.
✅ Best Practices: Avoid ranging markets
Use proper SL/TP for each timeframe
Use directional filter if you already have a directional bias
Always forward test before going live
⚠️ Trading Disclaimer:
This script is for educational and backtesting purposes only. Trading involves risk. Always use risk management and never invest more than you can afford to lose.

Change % Inteligente - NQ / ES / YMTopstep Compliance: Daily Price Change % Alert (NQ / ES / YM)
Script Purpose
This script helps funded traders (especially those using Topstep or similar programs) monitor the real-time percentage change of major equity index futures: Nasdaq (NQ), S&P 500 (ES), and Dow Jones (YM).
⚠️ Why it matters
Topstep prohibits trading within 2% of the daily price limits set by the CME. If a trader holds a position too close to those limits, they risk account disqualification.
📊 How it works
• Detects the instrument: NQ1!, ES1!, YM1!, or M2025 contracts
• Calculates the real-time % change from today’s market open
• Simulates daily CME price limits (+7% / -7%)
• Highlights when price enters the last 2% of the limit range (prohibited zone)
• Displays a clean, floating panel with the current % change and a warning if necessary
• Sends a visual and optional audio alert when in the prohibited zone
🧠 What makes this script unique?
This tool is **not for technical analysis**. It focuses exclusively on **funding program compliance** and **account protection**, which is not covered by other public scripts. It’s lightweight, intuitive, and designed for traders who manage risk like professionals.
✅ Open-source and ready for review.
✅ CHART SETUP FOR PUBLICATION
✔️ Use a clean chart
✔️ Only apply this script
✔️ Make sure the panel is visible (top-right or top-center recommended)
❌ No extra indicators or drawings
✔️ Use NQM2025, ESM2025 or YMM2025 on a volatile day (to show -1% to -3% range)
INSTRUCTIONS
1. Add the script to your chart.
2. Use it with NQ1!, ES1!, or YM1! (or M2025 contracts).
3. The panel will show today’s price change %.
4. If the market is within the last 2% of the CME price limit, a warning will appear.
5. Use this to avoid violating Topstep’s trading rules during volatile days.
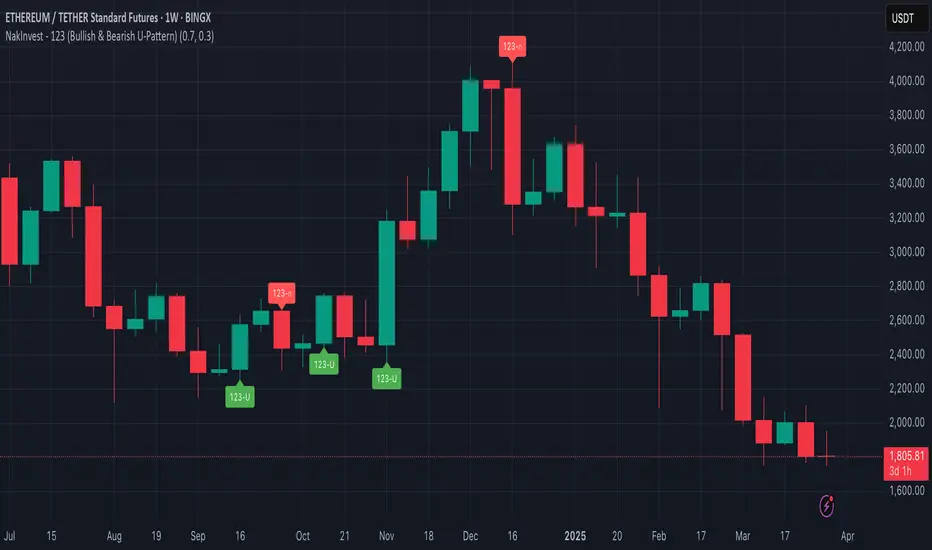
NakInvest - 123 (Bullish & Bearish U-Pattern)📘 Description: U-Shape 123 (Bullish & Bearish Identifier)
This indicator helps you identify the 123 reversal pattern, a powerful yet simple price action setup taught by renowned Brazilian trader Stormer.
I learned this pattern from Lucas Nakata, founder of NakInvest, who was a student of Stormer. Stormer has popularized and refined this setup in the Brazilian trading community, especially for identifying U-shaped reversals that precede strong directional moves.
⸻
🔎 What is the 123 Pattern?
The 123 pattern is a 3-candle formation used to spot bullish or bearish reversals. It forms a “U” or inverted “U” shape and is based purely on candlestick structure — no indicators or lagging signals.
There are two versions:
✅ Bullish 123 (“U” pattern)
• Candle 1: Red candle with a large body (selling pressure).
• Candle 2: Small candle of any color (pause or indecision).
• Candle 3: Green candle with a body at least 70% the size of candle 1 (strong bullish push).
This indicates a potential bullish reversal from a prior downtrend.
❌ Bearish 123 (inverted “U” pattern)
• Candle 1: Green candle with a large body (buying pressure).
• Candle 2: Small candle of any color (pause or indecision).
• Candle 3: Red candle with a body at least 70% the size of candle 1 (strong bearish push).
This indicates a potential bearish reversal from a prior uptrend.
Engulfing Candle Indicator with Single AlertEngulfing Candle Indicator with Alerts
This custom Pine Script indicator identifies Bullish and Bearish Engulfing Candles on the price chart, which are key reversal patterns. A Bullish Engulfing occurs when a smaller bearish candle is completely engulfed by a subsequent bullish candle, signaling a potential upward trend. Conversely, a Bearish Engulfing happens when a bullish candle is engulfed by a following bearish candle, indicating a possible downward trend.
The indicator highlights these patterns on the chart with green arrows for Bullish Engulfing and red arrows for Bearish Engulfing. It also includes an alert system that notifies the user whenever either of these patterns occurs.
The script uses an Average True Range (ATR) filter to ensure that the engulfing candles have sufficient size relative to market volatility. Additionally, users can adjust the minimum engulfing size to fine-tune the signal.

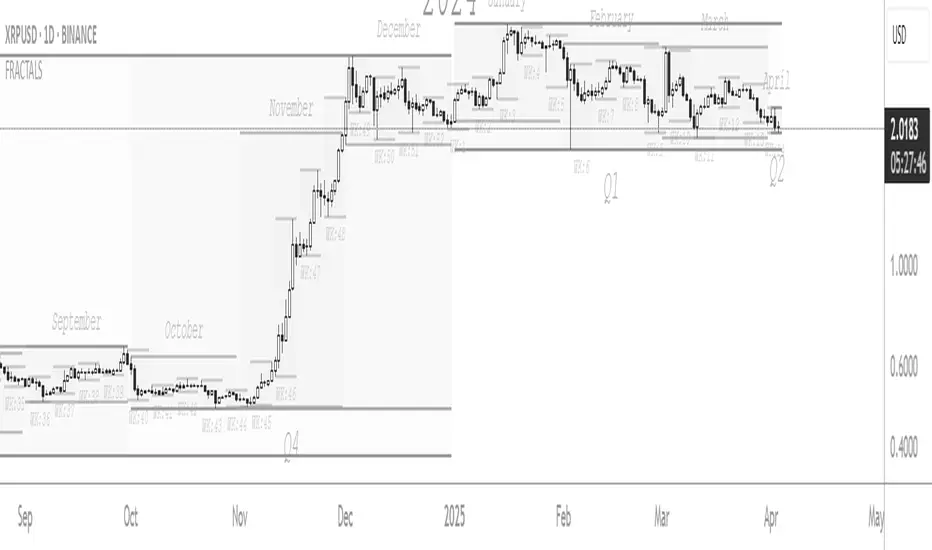
FRACTAL DIMENSIONSFRACTAL DIMENSIONS was created to allow us to properly visualize
the higher time frame dimensional data, While remaining on a lower
time frame. The Fractal dimensions are basically the higher time frames.
Remaining on a lower time frame allows us to get tighter entries and exits.
Each dimension is set in a wave degree formation. From primary to sub-minute,
depending on the time frame being utilized.
These multidimensional wave degrees will be utilized later in the strategy.
This indicator was broken off of the whole for the sake of drawing lines.
The data here is just for debugging purposes and is not used in the strategy,
but yet remains pretty awesome by itself.
Fractal dimensions is the foundation of the main strategy to come.
Now that we have this data, what are we going to do with it?
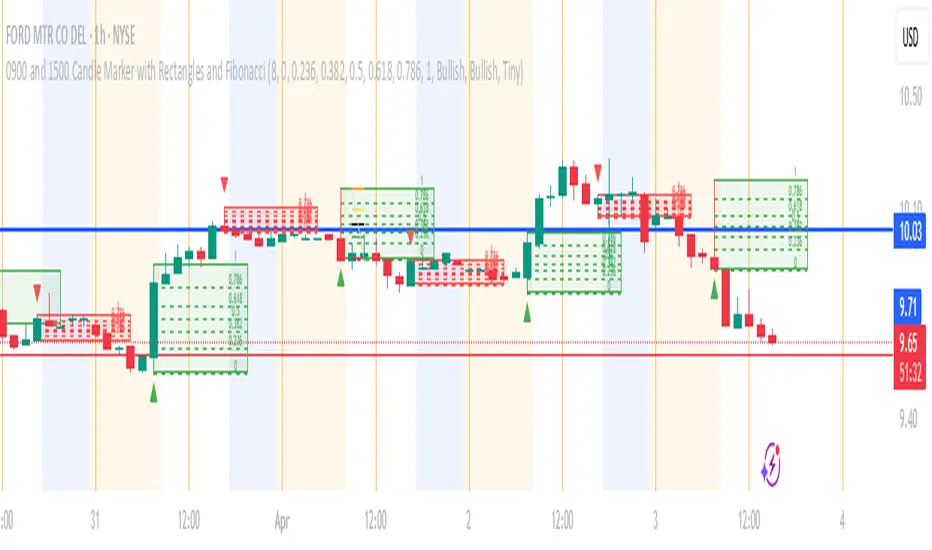
0900 and 1500 Candle Marker with Rectangles and FibonacciWelcome to the Indicator
// This tool is designed to help you analyze stock - crypto - or futures charts on TradingView by marking specific times - 9:00 AM and 3:00 PM (Eastern Time) - with colored rectangles and optional Fibonacci levels.
// It is perfect for spotting key moments in your trading day - like market opens or afternoon shifts - and understanding price ranges with simple lines and numbers.
// Whether you are new to trading or just want an easy way to visualize these times - this indicator is here to assist you.
//
// What It Does
// - Draws a green rectangle at 9:00 AM and a red rectangle at 3:00 PM on your chart - based on Eastern Time (America/New_York timezone).
// - Adds dashed lines inside these rectangles (called Fibonacci levels) to show important price points - like 0.236 or 0.618 of the rectangle’s height.
// - Places numbers on these lines (e.g. "0.5") so you can see exactly what each level represents.
// - Works on different chart types (stocks - crypto - futures) and adjusts for futures trading hours if needed.
// - Is designed to work best on timeframes of 1 hour or shorter (like 1-hour - 30-minute - 15-minute - 5-minute - or 1-minute charts) - where you can see the 9:00 AM and 3:00 PM candles clearly.
// - Lets you customize what you see through a settings menu - like hiding some lines or changing colors.
YOU MAY NOT MONETIZE
ANY PORTION OF THIS CODE.
WE ARE ALL IN THIS THING TOGETHER TO WIN.
BE A BLESSING ONTO THE WORLD AND GIVE.:)
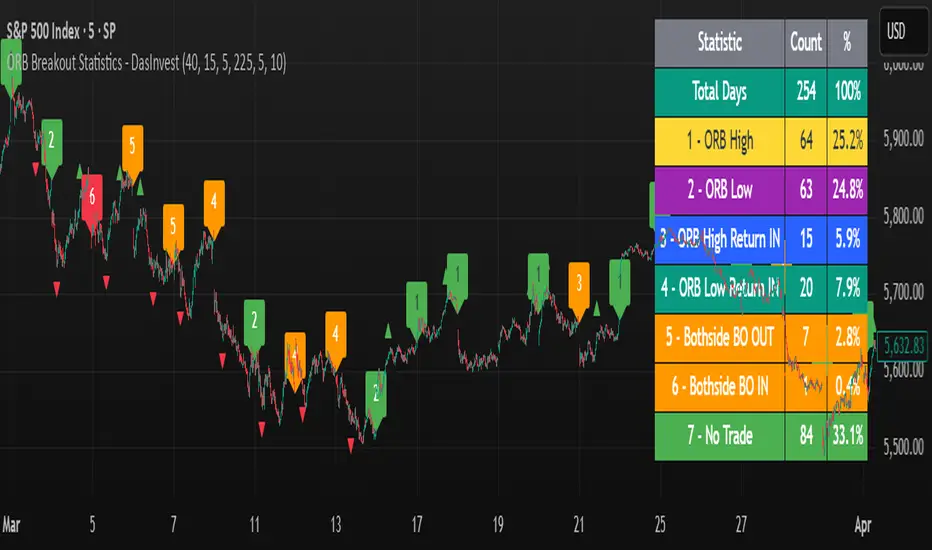
ORB Breakout Statistics with Labels and ProfitOpening Range Breakout Statistics – This indicator identifies the opening range based on user-defined inputs and detects breakouts above the high or below the low. At the end of each trading day, it classifies the session into a specific category based on price action. Additionally, it tracks profit and loss for each classification, allowing you to backtest the strategy using log files.
Open Vertical Lines [TradeWithRon]This indicator allows traders to draw vertical lines manually or automatically based on the current or specified higher timeframes. It is a versatile tool designed to help users identify and mark significant changes in the market, such as new candle formations, based on a selected or auto-adjusted timeframe.
Open Source
Features:
Timeframe Customization: Users can either manually specify a desired timeframe (e.g., 1-hour, 1-day, etc.) or enable the "Auto" feature, which automatically adjusts the timeframe based on the current chart's timeframe for better alignment with different trading strategies.
Customizable Line Style: The vertical line can be drawn in three different styles: Solid, Dashed, or Dotted, giving users the flexibility to choose their preferred appearance for better chart readability.
Line Color: Users can select the color of the vertical line with transparency options to match their chart's visual preferences.
Auto Timeframe Adjustments: The "Auto Align" option dynamically adjusts the timeframe used for vertical lines depending on the chart's current timeframe. For example, if you’re using a lower timeframe (e.g., 5 minutes), the indicator will automatically switch to a higher timeframe (e.g., 1 hour or daily) to mark vertical lines, ensuring the lines correspond to higher timeframe price action.
Vertical Line Placement:
A vertical line is placed each time a new candle appears on the chart, marking key moments for the user to analyze market movements. This can be helpful for marking the start of new trading sessions or significant events in the market.
How to Use:
1. Apply the indicator to your chart.
2. Configure the preferred timeframe settings (either fixed or auto-align).
3. Customize the line style and color according to your visual preference.
4. The indicator will automatically place vertical lines on the chart when a new candle is formed, based on your selected timeframe.

Enhanced Range Filter Strategy with ATR TP/SLBuilt by Omotola
## **Enhanced Range Filter Strategy: A Comprehensive Overview**
### **1. Introduction**
The **Enhanced Range Filter Strategy** is a powerful technical trading system designed to identify high-probability trading opportunities while filtering out market noise. It utilizes **range-based trend filtering**, **momentum confirmation**, and **volatility-based risk management** to generate precise entry and exit signals. This strategy is particularly useful for traders who aim to capitalize on trend-following setups while avoiding choppy, ranging market conditions.
---
### **2. Key Components of the Strategy**
#### **A. Range Filter (Trend Determination)**
- The **Range Filter** smooths price fluctuations and helps identify clear trends.
- It calculates an **adjusted price range** based on a **sampling period** and a **multiplier**, ensuring a dynamic trend-following approach.
- **Uptrends:** When the current price is above the range filter and the trend is strengthening.
- **Downtrends:** When the price falls below the range filter and momentum confirms the move.
#### **B. RSI (Relative Strength Index) as Momentum Confirmation**
- RSI is used to **filter out weak trades** and prevent entries during overbought/oversold conditions.
- **Buy Signals:** RSI is above a certain threshold (e.g., 50) in an uptrend.
- **Sell Signals:** RSI is below a certain threshold (e.g., 50) in a downtrend.
#### **C. ADX (Average Directional Index) for Trend Strength Confirmation**
- ADX ensures that trades are only taken when the trend has **sufficient strength**.
- Avoids trading in low-volatility, ranging markets.
- **Threshold (e.g., 25):** Only trade when ADX is above this value, indicating a strong trend.
#### **D. ATR (Average True Range) for Risk Management**
- **Stop Loss (SL):** Placed **one ATR below** (for long trades) or **one ATR above** (for short trades).
- **Take Profit (TP):** Set at a **3:1 reward-to-risk ratio**, using ATR to determine realistic price targets.
- Ensures volatility-adjusted risk management.
---
### **3. Entry and Exit Conditions**
#### **📈 Buy (Long) Entry Conditions:**
1. **Price is above the Range Filter** → Indicates an uptrend.
2. **Upward trend strength is positive** (confirmed via trend counter).
3. **RSI is above the buy threshold** (e.g., 50, to confirm momentum).
4. **ADX confirms trend strength** (e.g., above 25).
5. **Volatility is supportive** (using ATR analysis).
#### **📉 Sell (Short) Entry Conditions:**
1. **Price is below the Range Filter** → Indicates a downtrend.
2. **Downward trend strength is positive** (confirmed via trend counter).
3. **RSI is below the sell threshold** (e.g., 50, to confirm momentum).
4. **ADX confirms trend strength** (e.g., above 25).
5. **Volatility is supportive** (using ATR analysis).
#### **🚪 Exit Conditions:**
- **Stop Loss (SL):**
- **Long Trades:** 1 ATR below entry price.
- **Short Trades:** 1 ATR above entry price.
- **Take Profit (TP):**
- Set at **3x the risk distance** to achieve a favorable risk-reward ratio.
- **Ranging Market Exit:**
- If ADX falls below the threshold, indicating a weakening trend.
---
### **4. Visualization & Alerts**
- **Colored range filter line** changes based on trend direction.
- **Buy and Sell signals** appear as labels on the chart.
- **Stop Loss and Take Profit levels** are plotted as dashed lines.
- **Gray background highlights ranging markets** where trading is avoided.
- **Alerts trigger on Buy, Sell, and Ranging Market conditions** for automation.
---
### **5. Advantages of the Enhanced Range Filter Strategy**
✅ **Trend-Following with Noise Reduction** → Helps avoid false signals by filtering out weak trends.
✅ **Momentum Confirmation with RSI & ADX** → Ensures that only strong, valid trades are executed.
✅ **Volatility-Based Risk Management** → ATR ensures adaptive stop loss and take profit placements.
✅ **Works on Multiple Timeframes** → Effective for day trading, swing trading, and scalping.
✅ **Visually Intuitive** → Clearly displays trade signals, SL/TP levels, and trend conditions.
---
### **6. Who Should Use This Strategy?**
✔ **Trend Traders** who want to enter trades with momentum confirmation.
✔ **Swing Traders** looking for medium-term opportunities with a solid risk-reward ratio.
✔ **Scalpers** who need precise entries and exits to minimize false signals.
✔ **Algorithmic Traders** using alerts for automated execution.
---
### **7. Conclusion**
The **Enhanced Range Filter Strategy** is a powerful trading tool that combines **trend-following techniques, momentum indicators, and risk management** into a structured, rule-based system. By leveraging **Range Filters, RSI, ADX, and ATR**, traders can improve trade accuracy, manage risk effectively, and filter out unfavorable market conditions.
This strategy is **ideal for traders looking for a systematic, disciplined approach** to capturing trends while **avoiding market noise and false breakouts**. 🚀

GQT GPT - Volume-based Support & Resistance Zones V2搞钱兔,搞钱是为了更好的生活。
Title: GQT GPT - Volume-based Support & Resistance Zones V2
Overview:
This strategy is implemented in PineScript v5 and is designed to identify key support and resistance zones based on volume-driven fractal analysis on a 1-hour timeframe. It computes fractal high points (for resistance) and fractal low points (for support) using volume moving averages and specific price action criteria. These zones are visually represented on the chart with customizable lines and zone fills.
Trading Logic:
• Entry: The strategy initiates a long position when the price crosses into the support zone (i.e., when the price drops into a predetermined support area).
• Exit: The long position is closed when the price enters the resistance zone (i.e., when the price rises into a predetermined resistance area).
• Time Frame: Trading signals are generated solely from the 1-hour chart. The strategy is only active within a specified start and end date.
• Note: Only long trades are executed; short selling is not part of the strategy.
Visualization and Parameters:
• Support/Resistance Zones: The zones are drawn based on calculated fractal values, with options to extend the lines to the right for easier tracking.
• Customization: Users can configure the appearance, such as line style (solid, dotted, dashed), line width, colors, and label positions.
• Volume Filtering: A volume moving average threshold is used to confirm the fractal signals, enhancing the reliability of the support and resistance levels.
• Alerts: The strategy includes alert conditions for when the price enters the support or resistance zones, allowing for timely notifications.
⸻
搞钱兔,搞钱是为了更好的生活。
标题: GQT GPT - 基于成交量的支撑与阻力区间 V2
概述:
本策略使用 PineScript v5 实现,旨在基于成交量驱动的分形分析,在1小时级别的图表上识别关键支撑与阻力区间。策略通过成交量移动平均线和特定的价格行为标准计算分形高点(阻力)和分形低点(支撑),并以自定义的线条和区间填充形式直观地显示在图表上。
交易逻辑:
• 进场条件: 当价格进入支撑区间(即价格跌入预设支撑区域)时,策略在没有持仓的情况下发出做多信号。
• 离场条件: 当价格进入阻力区间(即价格上升至预设阻力区域)时,持有多头头寸则会被平仓。
• 时间范围: 策略的信号仅基于1小时级别的图表,并且仅在指定的开始日期与结束日期之间生效。
• 备注: 本策略仅执行多头交易,不进行空头操作。
可视化与参数设置:
• 支撑/阻力区间: 根据计算得出的分形值绘制支撑与阻力线,可选择将线条延伸至右侧,便于后续观察。
• 自定义选项: 用户可以调整线条样式(实线、点线、虚线)、线宽、颜色及标签位置,以满足个性化需求。
• 成交量过滤: 策略使用成交量移动平均阈值来确认分形信号,提高支撑和阻力区间的有效性。
• 警报功能: 当价格进入支撑或阻力区间时,策略会触发警报条件,方便用户及时关注市场变化。
⸻

Body Percentage of Range (Colored)Short Description:
This indicator measures the dominance of the candle's body relative to its total range (High - Low), providing a visual gauge of intra-candle strength versus indecision. Columns are colored based on whether the body constitutes more or less than a defined percentage (default 50%) of the candle's total height.
Detailed Description:
What it Does:
The "Body Percentage of Range" indicator calculates, for each candle, what percentage of the total price range (High minus Low) is occupied by the candle's body (absolute difference between Open and Close).
A value of 100% means the candle has no wicks (a Marubozu), indicating strong conviction during that period.
A value of 0% means the candle has no body (a Doji), indicating perfect indecision.
Values in between show the relative balance between the directional move (body) and the price exploration/rejection (wicks).
How to Interpret:
The indicator plots this percentage as columns:
Column Height: Represents the percentage of the body relative to the total range. Higher columns indicate a larger body dominance.
Column Color:
Green Columns: Appear when the body percentage is above the user-defined threshold (default 50%). This suggests that the directional move within the candle was stronger than the indecision (wicks). Often seen during trending moves or strong momentum candles.
Red Columns: Appear when the body percentage is at or below the user-defined threshold (default 50%). This suggests that wicks dominate the candle (body is 50% or less of the range), indicating significant indecision, struggle between buyers and sellers, or potential reversals. These are common in choppy, consolidating, or reversal market conditions.
Orange Line (Optional MA): A Simple Moving Average (SMA) of the body percentages is plotted to help smooth the readings and identify broader periods where candle structure indicates more trending (high MA) vs. ranging/indecisive (low MA) characteristics.
Potential Use Cases:
Identifying Choppy vs. Trending Markets: Sustained periods of low, predominantly red columns (and often a low/declining MA) can signal a choppy, range-bound market where trend-following strategies might underperform. Conversely, periods with frequent high, green columns suggest a more trending environment.
Confirming Breakouts/Momentum: High green columns appearing alongside increased volume during a breakout can add conviction to the move's strength.
Spotting Potential Exhaustion/Reversals: A very tall green column after a strong trend, followed immediately by a low red column (like a Doji or Spinning Top pattern appearing on the price chart), might signal potential exhaustion or a pending reversal, indicating indecision has suddenly entered the market.
Filtering Entries: Traders might avoid taking entries (especially trend-following ones) when the indicator shows a consistent pattern of low red columns, suggesting high market indecision.
Settings:
Color Threshold %: Allows you to set the percentage level above which columns turn green (default is 50%).
Smoothing MA Length: Adjusts the lookback period for the Simple Moving Average.
Disclaimer:
This indicator is a tool for technical analysis and should be used in conjunction with other methods (like price action, volume analysis, other indicators) and robust risk management. It does not provide direct buy/sell signals and past performance is not indicative of future results.

Today's Daily LevelsTrack daily price action like a pro with instant visibility of key levels, percentages, and P&L values - all in one clean view.
• Shows Daily Open, High, Low & Median levels
• Dynamic color-coding: green above open, red below
• Real-time price labels with:
Exact price levels
% distance between levels
Point values
Dollar values per contract
• Auto-repaints on timeframe changes
• 30min alerts for median crosses

Vertical Line at Specified HoursThis script helps you easily separate time.
This indicator can be used for many different purposes. For example, I use it to separate different days and sessions.
Features :
1- Ability to use 10 vertical lines simultaneously
2- The Possibility to change the color of lines
3- The Possibility to change the line type
Tip : The times you enter in the input section must be in the New York time zone.

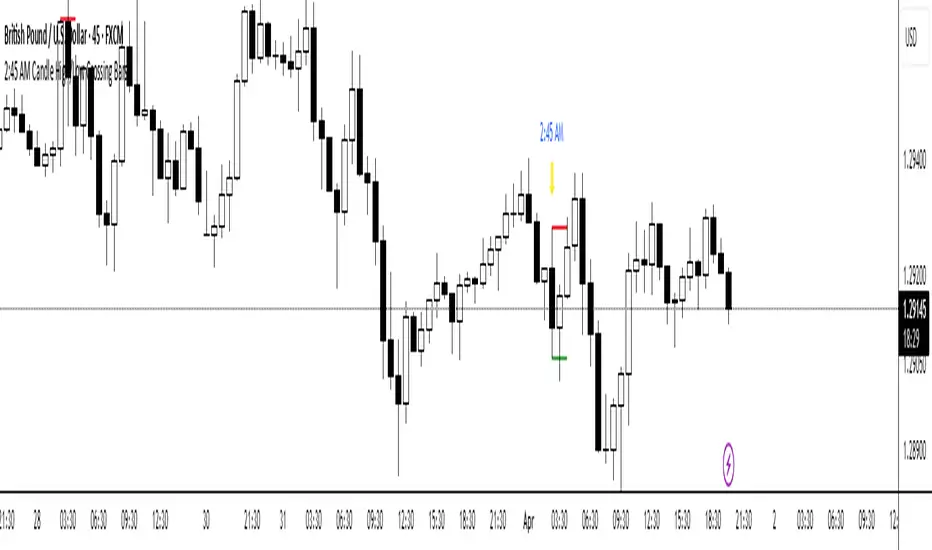
2:45 AM Candle High/Low Crossing Bars2:45 AM Candle High/Low Crossing Bars is an indicator that focuses on the trading view 2:45am NY TIME high and low indicating green for buy and red bars for sell, with the 2:45am new york time highlight/ If the next candle sweeps the low we buy while if it sweeps the high we sell, all time zoon must be the new York UTC time.
yatofxDescription: "Ramon Coto's 3 Session Bar Color" Indicator
This TradingView Pine Script indicator colors candlestick bars based on three custom trading sessions. It allows traders to visually distinguish different market timeframes on their charts.
Features:
Three configurable trading sessions with user-defined time ranges.
Customizable session colors:
Session A → Blue
Session B → Red
Session C → Lime
Enable/disable sessions independently using input toggles.
Automatic session detection: Bars are colored based on the active session.
Optimized for TradingView Mobile & Desktop with clear and efficient logic.
How It Works:
1. User Inputs: The script takes session time ranges and enables/disables each session.
2. Session Detection: The script checks whether the current time falls within any of the defined sessions.
3. Bar Coloring: If a session is active, the corresponding color is applied to the bars.
This indicator helps traders quickly recognize which market session they are in, improving decision-making for session-based strategies.

Imbalance(FVG) DetectorImbalance (FVG) Detector
Overview
The Imbalance (FVG) Detector is a technical analysis tool designed to highlight price inefficiencies by identifying Fair Value Gaps (FVGs). These gaps occur when rapid price movement leaves an area with little to no traded volume, which may later act as a zone of interest. The indicator automatically detects and marks these imbalances on the chart, allowing users to observe historical price behavior more effectively.
Key Features
- Automatic Imbalance Detection: Identifies bullish and bearish imbalances based on a structured three-bar price action model.
- Customizable Sensitivity: Users can adjust the minimum imbalance percentage threshold to tailor detection settings to different assets and market conditions.
- Real-time Visualization: Marked imbalances are displayed as colored boxes directly on the chart.
- Dynamic Box Updates: Imbalance zones extend forward in time until price interacts with them.
- Alert System: Users can set alerts for when new imbalances appear or when price tests an existing imbalance.
How It Works
The indicator identifies market imbalances using a three-bar price structure:
- Bullish Imbalance: Occurs when the high of three bars ago is lower than the low of the previous bar, forming a price gap.
- Bearish Imbalance: Occurs when the low of three bars ago is higher than the high of the previous bar, creating a downward gap.
When an imbalance is detected:
- Green Boxes indicate bullish imbalances.
- Red Boxes indicate bearish imbalances.
- Once price interacts with an imbalance, the box fades to gray, marking it as tested.
! Designed for Crypto Markets
This indicator is particularly useful in crypto markets, where frequent volatility can create price inefficiencies. It provides a structured way to visualize gaps in price movement, helping users analyze historical liquidity areas.
Customization Options
- Min Imbalance Percentage Size: Adjusts the sensitivity of the imbalance detection.
- Alerts: Users can enable alerts to stay notified of new or tested imbalances.
Important Notes
- This indicator is a technical analysis tool and does not provide trading signals or financial advice.
- It does not predict future price movement but highlights historical price inefficiencies.
- Always use this tool alongside other market analysis methods and risk management strategies.

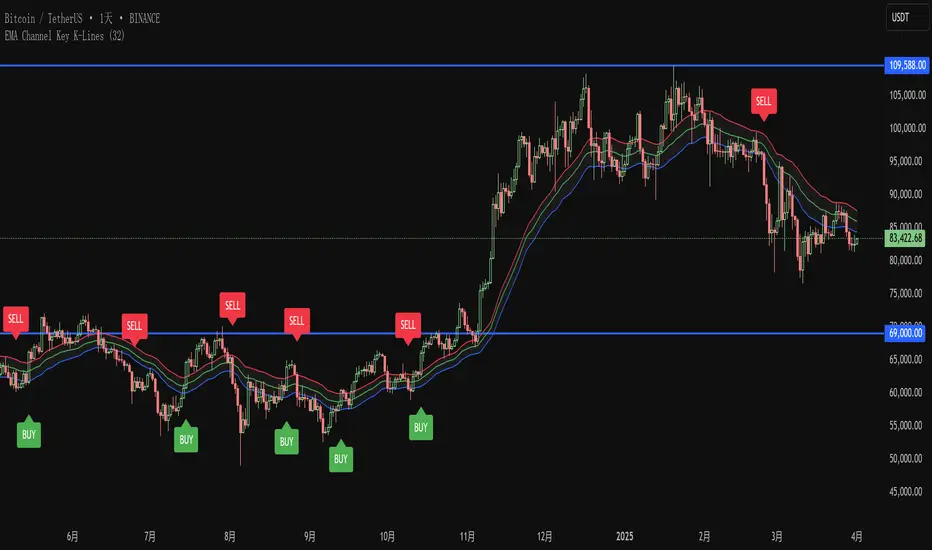
EMA Channel Key K-LinesEMA Channel Setup :
Three 32-period EMAs (high, low, close prices)
Visually distinct colors (red, blue, green)
Gray background between high and low EMAs
Key K-line Identification :
For buy signals: Close > highest EMA, K-line height ≥ channel height, body ≥ 2/3 of range
For sell signals: Close < lowest EMA, K-line height ≥ channel height, body ≥ 2/3 of range
Alternating signals only (no consecutive buy/sell signals)
Visual Markers :
Green "BUY" labels below key buy K-lines
Red "SELL" labels above key sell K-lines
Clear channel visualization
Logic Flow :
Tracks last signal direction to prevent consecutive same-type signals
Strict conditions ensure only significant breakouts are marked
All calculations based on your exact specifications
Renko Flip MarkerThis script shows on chart where Renko bricks flip for candlestick chart. I intended it for candlestick chart, but it seems to work Renko chart too from my testing so far. You may change the Renko size for your own scenario you're trading. Hopefully helps, Thank you.

SCE GANN PredictionsThis is a script designed to give an insight on price direction from being above or below a GANN Value.
What Are GANN Waves?
The SCE GANN Predictions indicator is inspired by the work of W.D. Gann, a renowned trader who believed that price movements follow geometric and mathematical patterns. GANN waves use past price behavior—specifically momentum or "velocity"—to forecast where prices might head next.
How Does the Indicator Work?
Calculating Velocity
The script starts by measuring the "velocity" of price movement over a user-defined lookback period (denoted as n). This velocity is the average difference between the close and open prices over n bars. Think of it as the market’s speed in a given direction.
Predicting the Future Price
Using this velocity, the indicator estimates a future price after a specific time horizon—calculated as n + n*2 bars into the future (e.g., if n = 15, it predicts 45 bars ahead). It scales the velocity by a ratio (Gr) to determine the "end price." This is the raw GANN prediction.
Optimizing the Ratio (Gr)
The key to a good prediction is finding the right Gr. The script tests a range of Gr values (from Gr_min to Gr_max, stepping by Gr_step) and evaluates each one by calculating the sum of squared errors (SSE) between the predicted prices and the actual historical close prices. The Gr with the lowest SSE is deemed "optimal" and used for the final prediction.
Smoothing with an SMA
The raw GANN prediction is then smoothed using a simple moving average (SMA) over the lookback period (n). This SMA is plotted on your chart, serving as a dynamic trend line. The plot’s color changes based on the current price: teal if the close is above the SMA (bullish), and red if below (bearish).
Visuals
This example shows how the value explains price strength and changes color. When the price is above the line, and it’s green, we’re showing an up trend. The opposite is when the price is below the line, and it’s red, showing a down trend.
We can see that there may be moments where price drops under the value for just that one bar.
In scenarios with sideways price action, even though the price crosses, there is no follow through. This is a shortcoming of the overall concept.
Customizable Inputs
Timeframe: Choose the timeframe for analysis (default is 2 minutes).
Show GANN Wave: Toggle the GANN SMA plot on or off (default is true).
Lookback Period (Gn): Set the number of bars for velocity and SMA calculations (default is 15).
Min Ratio (Gr_min): The lower bound for the Gr optimization (default is 0.05).
Max Ratio (Gr_max): The upper bound for Gr (default is 0.2).
Step for Gr (Gr_step): The increment for testing Gr values (default is 0.01).
How to Use SCE GANN Predictions
Trend Direction
The colored SMA provides a quick visual cue. Teal suggests an uptrend, while red hints at a downtrend. Use this to align your trades with the broader momentum.
Crossover Signals
Watch for the close price crossing the GANN SMA. A move above could signal a buy opportunity, while a drop below might indicate a sell. Combine this with other indicators for confirmation.
Fine-Tuning
Experiment with the lookback period (Gn) and Gr range to optimize for your market. Shorter lookbacks might suit fast-moving assets, while longer ones could work for slower trends.
Like any technical tool, SCE GANN Predictions isn’t a crystal ball. It’s based on historical data and mathematical assumptions, so it won’t always be spot-on.

Small Range Stocks (ATR 7)This indicator identifies stocks with a small daily range relative to their ATR(7). It plots a small green tick below candles where the daily range is ≤ 0.9 × ATR(7), helping traders spot consolidation zones for potential breakouts.
