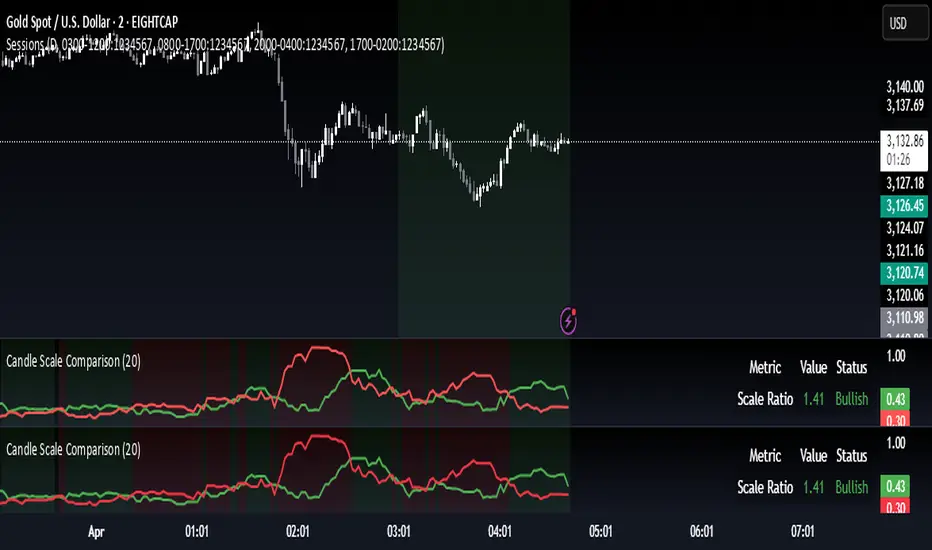
Candle Scale ComparisonCompares the scale of bullish and bearish candles and shows which side is currently dominant. Works in any symbol.
1. Input Parameters:
- LookbackPeriod: Allows you to set how many bars to look back for calculating averages (default: 20)
- showLabels: Toggle to show/hide dominance labels on the chart
2. Calculations:
- Calculates the scale of bullish candles (close - open)
Calculates the scale of bearish candles (open - close)
- Computes moving averages for both scales using the specified lookback period
- Determines which type of candles are dominating based on the averages
3. Visual Elements:
- Plots two lines showing the average scales:
- Green line for bullish candle scales
- Red line for bearish candle scales
- Adds a background color that changes based on dominance:
- Light green when bullish candles dominate
- Light red when bearish candles dominate
- Shows labels above the chart indicating current dominance
- Displays a table in the top-right corner showing:
- The current scale ratio (bullish/bearish)
- The current dominance status
4. Features:
- The indicator is plotted in a separate pane below the main chart
- Uses color coding for easy visual interpretation
- Provides both visual and numerical representation of the dominance
- Updates in real-time as new candles form
Candlestick analysis
TriplePower55%🔴 Bearish Candle (Losing Candle)
🔹 Definition:
A candle that closes below the opening price.
Important condition: the body of the candle must be ≥ 55% of the entire candle's range.
It is automatically colored red on the platform.
🔹 Significance:
Used to identify resistance levels or initiate the Triple Power analysis.
The last valid bearish candle (with a body and that broke a bullish candle) is selected to draw Fibonacci levels.
🔹 How it's handled:
When the price closes above the high of the bearish candle, an upward wave begins.
The indicator draws a blue line at its high and a red line at its low, with the timeframe labeled (e.g., TF: M).
🟢 Bullish Candle (Winning Candle)
🔹 Definition:
A candle that closes above the opening price.
Its body must be ≥ 55% of the total candle's range.
It is automatically colored green on the platform.
🔹 Significance:
Used to identify support levels, or as a reference in extensions or pauses.
The last closed bullish candle is used to draw extension targets if there’s no valid bearish candle.
🔹 How it's handled:
If the price closes below the low of the monthly bullish candle, it signals the start of a strong downward trend.
If the low is not broken, the movement is considered a temporary pause.
The stop level is placed at the low of the last closed bullish candle.

Shaved Candle IdentifierThis script is different because it actually highlights the candle and is not just an icon. It will identify bars that have no wick. Each color represents a different type of candle.
Shaved candles represent major liquidity zones, and tend to get swept in the future.
Shaved candles are useful for spotting reversals and as price targets.
Green is when open = low
Red is when open = high
Blue is when close = high
Orange is when close = low
There is 0 tolerance for any deviation, if the price is 0.001 off, it will not be identified. Only absolutely shaved candles will be identified.

RedK VADER - Volume-Accelerated Directional Energy RatioRedK VADER - Volume-Accelerated Directional Energy Ratio
Overview
RedK VADER is an indicator that analyzes market trends by calculating the energy ratio based on price movement and volume. It utilizes Zero Lag EMA smoothing to provide faster and more responsive signals.
Features
✅ Considers both price action and volume: Calculates the energy ratio of upward and downward movements to assess market strength.
✅ Zero Lag Smoothing: Uses EMA-based smoothing to minimize lag and improve responsiveness.
✅ Histogram Display: Helps visualize trend strength and potential reversals.
✅ Simple yet effective: Uses short-term and long-term energy differences to generate intuitive trade signals.
How to Use
📌 Blue Line (RedK VADER): Indicates trend direction and strength.
📌 Orange Line (Signal Line): A smoothed version of VADER; crossovers provide trade signals.
📌 Histogram (Green Bars): Represents the difference between VADER and the signal line. When crossing the zero line, it may indicate a trend reversal.
Trade Signals
🔵 Buy Signal: When RedK VADER crosses above the signal line.
🔴 Sell Signal: When RedK VADER crosses below the signal line.
⚡ Trend Strength: The larger the histogram bars, the stronger the trend.
Use this indicator to gain deeper market insights and enhance your trading decisions! 🚀
Sentiment OscillatorIn the complex world of trading, understanding market sentiment can be like reading the emotional pulse of financial markets. Our Sentiment Oscillator is designed to be your personal market mood translator, helping you navigate through the noise of price movements and market fluctuations.
Imagine having a sophisticated tool that goes beyond traditional price charts, diving deep into the underlying dynamics of market behavior. This indicator doesn't just show you numbers – it tells you a story about market sentiment, combining multiple financial signals to give you a comprehensive view of potential market directions.
The Sentiment Oscillator acts like a sophisticated emotional barometer for stocks, cryptocurrencies, or any tradable asset. It analyzes price changes, market volatility, trading volume, and long-term trends to generate a unique sentiment score. This score ranges from highly bullish to deeply bearish, providing traders with an intuitive visual representation of market mood.
Green zones indicate positive market sentiment, suggesting potential buying opportunities. Red zones signal caution, hinting at possible downward trends. The oscillator's gray neutral zone helps you identify periods of market uncertainty, allowing for more calculated trading decisions.
What sets this indicator apart is its ability to blend multiple market factors into a single, easy-to-understand indicator. It's not just about current price – it's about understanding the deeper currents moving beneath the surface of market prices.
Traders can use this oscillator to:
- Identify potential trend reversals
- Understand market sentiment beyond price movement
- Spot periods of market strength or weakness
- Complement other technical analysis tools
Whether you're a day trader, swing trader, or long-term investor, the Sentiment Oscillator provides an additional layer of insight to support your trading strategy. Remember, no indicator is a crystal ball, but this tool can help you make more informed decisions in the dynamic world of trading.

TheStrat: Failed 2'sThis indicator identifies and highlights Failed 2-Up (2U) and Failed 2-Down (2D) patterns in The Strat trading framework. These patterns signal a potential reversal when a 2-Up (higher high) or 2-Down (lower low) candle fails to follow through and reverses, offering high-probability trade setups.

Three Red WicksThe indicator will mark spots on your chart where three red candles appear in a row. You can modify the marker's color, shape, or position by adjusting the plotshape parameters if desired.
Would you like me to modify anything in this indicator, like changing the marker style or adding additional conditions?

Reversal & Breakout Strategy with ORB### Reversal & Breakout Strategy with ORB
This strategy combines three distinct trading approaches—reversals, trend breakouts, and opening range breakouts (ORB)—into a single, cohesive system. The goal is to capture high-probability setups across different market conditions, leveraging a mashup of technical indicators for confirmation and risk management. Below, I’ll explain why this combination works, how the components interact, and how to use it effectively.
#### Why the Mashup?
- **Reversals**: Identifies overextended moves using RSI (overbought/oversold) and SMA50 crosses, filtered by VWAP and SMA200 trend direction. This targets mean-reversion opportunities in trending markets.
- **Breakouts**: Uses EMA9/EMA20 crossovers with VWAP and SMA200 confirmation to catch momentum-driven trend continuations.
- **Opening Range Breakout (ORB)**: Detects early momentum by breaking the high/low of a user-defined opening range (default: 15 bars) with volume confirmation. This adds a time-based edge, ideal for intraday trading.
The synergy comes from blending these methods: reversals catch pullbacks, breakouts ride trends, and ORB exploits early volatility—all filtered by trend (SMA200) and anchored by VWAP for context.
#### How It Works
1. **Indicators**:
- **EMA9/EMA20**: Fast-moving averages for breakout signals.
- **SMA50**: Medium-term trend filter for reversals.
- **SMA200**: Long-term trend direction to align trades.
- **RSI (14)**: Measures overbought (>70) or oversold (<30) conditions.
- **VWAP**: Acts as a dynamic support/resistance level.
- **ATR (14)**: Sets stop-loss distance (default: 1.5x ATR).
- **Volume**: Confirms ORB breakouts (1.5x average volume of opening range).
2. **Entry Conditions**:
- **Long**: Triggers on reversal (SMA50 cross + RSI < 30 + below VWAP + uptrend), breakout (EMA9 > EMA20 + above VWAP + uptrend), or ORB (break above opening range high + volume).
- **Short**: Triggers on reversal (SMA50 cross + RSI > 70 + above VWAP + downtrend), breakout (EMA9 < EMA20 + below VWAP + downtrend), or ORB (break below opening range low + volume).
3. **Risk Management**:
- Risks 5% of equity per trade (based on the initial capital set in the strategy tester).
- Stop-loss: Based on lowest low/highest high over 7 bars ± 1.5x ATR.
- Targets: Two exits at 1:1 and 1:2 risk:reward (50% of position at each).
- Break-even: Stop moves to entry price after the first target is hit.
4. **Backtesting Settings**:
- Commission: Hardcoded at 0.1% per trade (realistic for most brokers).
- Slippage: Hardcoded at 2 ticks (realistic for most markets).
- Tested on datasets yielding 100+ trades (e.g., 2-min or 5-min charts over months).
#### How to Use It
- **Timeframe**: Works best on intraday (2-min, 5-min) or daily charts. Adjust `Opening Range Bars` (e.g., 15 bars = 30 min on 2-min chart) for your timeframe.
- **Settings**:
- Set your initial equity in the TradingView strategy tester’s "Properties" tab under "Initial Capital" (e.g., $10,000). The script automatically risks 5% of this equity per trade.
- Adjust `Stop Loss ATR Multiplier` or `Risk:Reward Targets` based on your risk tolerance.
- Note that commission (0.1%) and slippage (2 ticks) are fixed in the script for backtesting consistency.
- **Execution**: Enter on signal, monitor plotted stop (red) and targets (green/blue). The strategy supports pyramiding (up to 2 positions) for scaling into trends.
#### Backtesting Notes
Results are realistic with commission (0.1%) and slippage (2 ticks) included. For a sufficient sample, test on volatile instruments (e.g., stocks, forex) over 3-6 months on lower timeframes. The default 1.5x ATR stop may seem wide, but it’s justified to avoid premature exits in volatile markets—feel free to tweak it with justification. The script assumes an initial capital of $10,000 in the strategy tester for the 5% risk calculation (e.g., $500 risk per trade); adjust this in the "Properties" tab as needed.
This mashup isn’t just a random mix; it’s a deliberate fusion of complementary strategies, offering traders flexibility across market phases. Questions? Let me know!

SMA7 Tail Reversal📌 Description:
The SMA7 Tail Reversal indicator is designed to identify potential counter-trend trading opportunities by checking if candle wicks (tails) respect a key moving average level (SMA7).
This indicator highlights price action where candles are clearly separated from the moving average, suggesting a possible reversal or temporary correction.
📌 How It Works:
Moving Average Calculation:
Calculates a simple moving average (SMA) of length 7 to act as the primary trend filter.
Candle Classification:
Bullish Candle: A candle where the closing price is higher than the opening price, with a short upper wick.
Bearish Candle: A candle where the closing price is lower than the opening price, with a short lower wick.
Conditions for Coloring Candles:
Long Condition (Green Candle):
High & Low are both below the SMA7 line.
Volume is above the 20-period average.
A bullish candle is detected.
Short Condition (Red Candle):
High & Low are both above the SMA7 line.
Volume is above the 20-period average.
A bearish candle is detected.
📌 Visual Representation:
Green Candles: Potential long signals when price action stays below the SMA7 line.
Red Candles: Potential short signals when price action stays above the SMA7 line.
Yellow Line: SMA7, used as the dynamic threshold for signal generation.
📌 Usage:
Best applied to volatile markets with clear trends.
Effective in detecting counter-trend opportunities where price diverges from the SMA7 line.
Works well with additional confirmation tools for better accuracy.

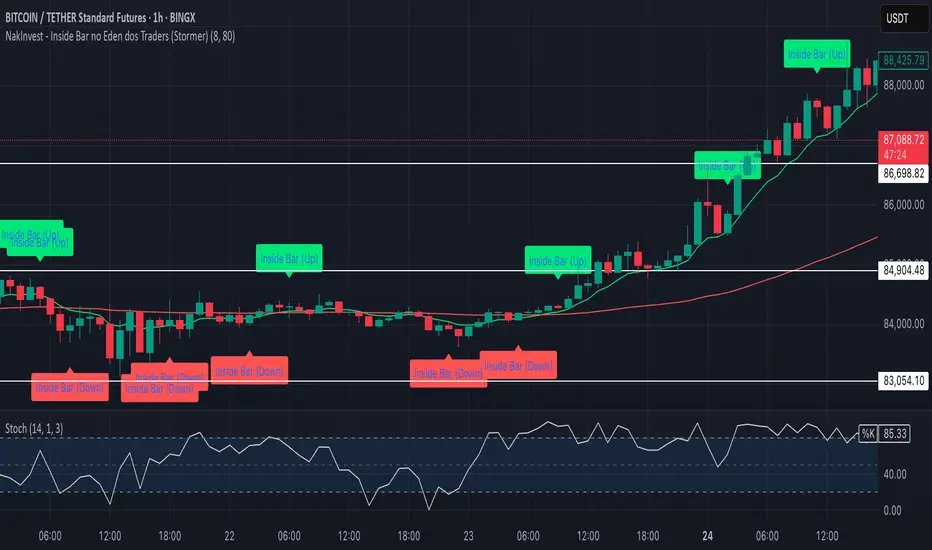
NakInvest - Inside Bar no Eden dos Traders (Stormer)📌 NakInvest - Inside Bar Detector (Éden dos Traders Enhanced Detection)
This indicator is designed to identify Inside Bars that occur during strong trending conditions, following the popular Éden dos Traders strategy by Stormer, famous brazilian trader. It uses the relationship between two EMAs (Short EMA & Long EMA) to determine whether the market is in a bullish or bearish trend, and highlights Inside Bars that meet specific criteria.
⸻
🔍 What This Indicator Does:
1. EMA-Based Trend Detection:
• Identifies Uptrends when the Short EMA is above the Long EMA.
• Identifies Downtrends when the Short EMA is below the Long EMA.
2. Inside Bar Detection:
• An Inside Bar is detected when the entire candle (body & wicks) is contained within the body of the previous candle.
• This pattern suggests consolidation and potential breakouts, especially when found within a strong trend.
3. Debug Mode for Transparency:
• When enabled, provides visual markers to indicate when the conditions for trend detection and Inside Bars are met.
• Helps traders understand why certain candles are detected and others are not.
⸻
📈 How to Use:
• Apply this indicator to any market and timeframe, but it’s most effective on higher timeframes (H1, H4, Daily).
• Ideal for traders looking for trend-continuation setups or reversal signals after periods of consolidation.
• Combine this indicator with other tools (e.g., Volume Analysis, Price Action Patterns) for greater accuracy.
⸻
⚙️ Indicator Settings:
1. Short EMA Length: The period for the fast-moving average (default: 8).
2. Long EMA Length: The period for the slow-moving average (default: 80).
3. Enable Debug Mode: Toggle visibility of debug markers to better understand condition logic.
⸻
📢 Alerts:
This script includes labels for:
• IB (Up): Inside Bar detected during an uptrend.
• IB (Down): Inside Bar detected during a downtrend.
⸻
📌 Disclaimer:
This indicator is intended for educational purposes only and is not financial advice. Always perform your own research and consult with a financial professional before making any trading decisions.
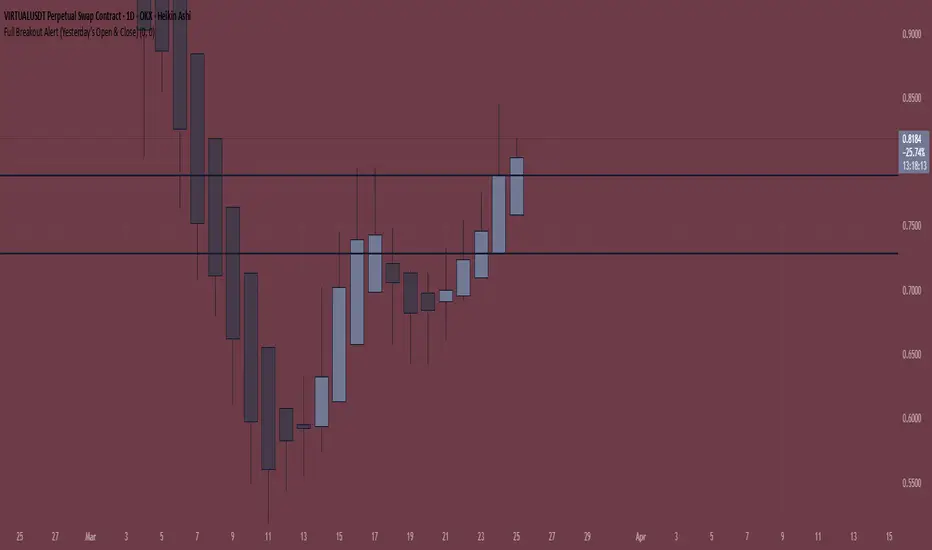
Full Breakout Alert (Yesterday’s Open & Close)For this Script
Horizontal 1 will be your resistance from the opening candle of yesterday
Horizontal 2 will be your support from the closing candle of yesterday
If you manually input the value, the line will change. Then you can add alert and it will just trigger if the Body and the Wick is above/below (whatever you choose from) from the value itself
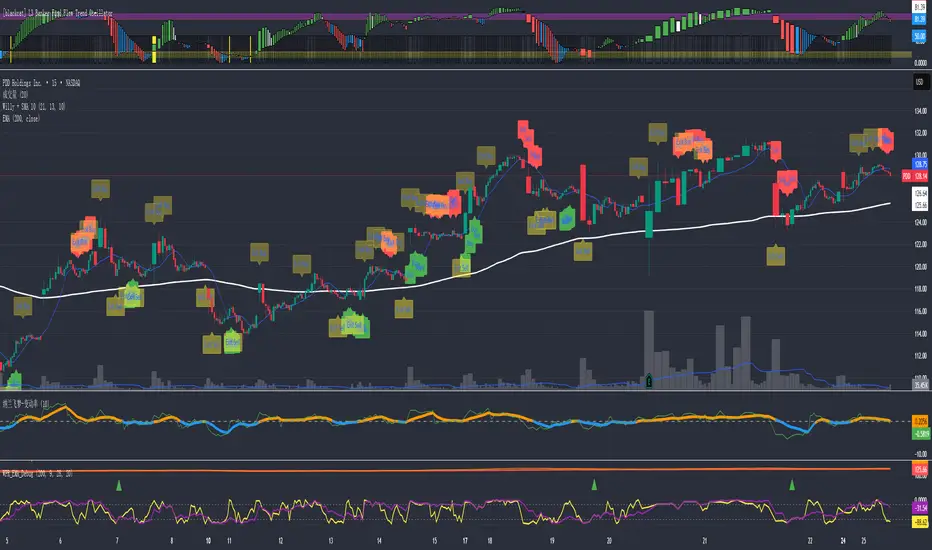
Optimized WPR Strategy with Filters (Debug)Identifying Market Trends:
The 200-period EMA is used to determine the short-term trend of the market.
When the price is above the 200-period EMA, it suggests a potential bullish market and an uptrend, and the strategy will only look for buying opportunities.
When the price is below the 200-period EMA, it suggests a potential bearish market and a downtrend, and the strategy will only look for selling opportunities.
When the 200-period EMA intersects with the price, it indicates that the market may be in a directionless consolidation phase.
Identifying Potential Reversal Points:
The strategy employs two Williams %R (WPR) indicators: one with a 9-period (fast WPR) and another with a 28-period (slow WPR).
WPR is a momentum indicator used to identify overbought and oversold conditions in the market. Its value oscillates between -100 and 0, with values near -100 indicating oversold conditions and values near 0 indicating overbought conditions.
In an uptrend (when the price is above the 200 EMA), the strategy seeks buying opportunities when both WPR indicators cross above -80 (the oversold zone) from below. This is considered a bullish signal, suggesting the market may be about to rebound. Sell signals are ignored at this time.
In a downtrend (when the price is below the 200 EMA), the strategy seeks selling opportunities when both WPR indicators cross below -20 (the overbought zone) from above. This is considered a bearish signal, suggesting the market may be about to reverse downward. Buy signals are ignored at this time.
Summary:
In summary, this strategy first uses the 200-period EMA to determine the overall trend direction of the market. Then, within the confirmed trend direction, it utilizes the simultaneous crossing of the overbought or oversold zones by the dual WPR indicators to identify potential reversal points as entry signals for trading. The strategy emphasizes that trading signals are only valid when both WPR indicators meet the conditions.
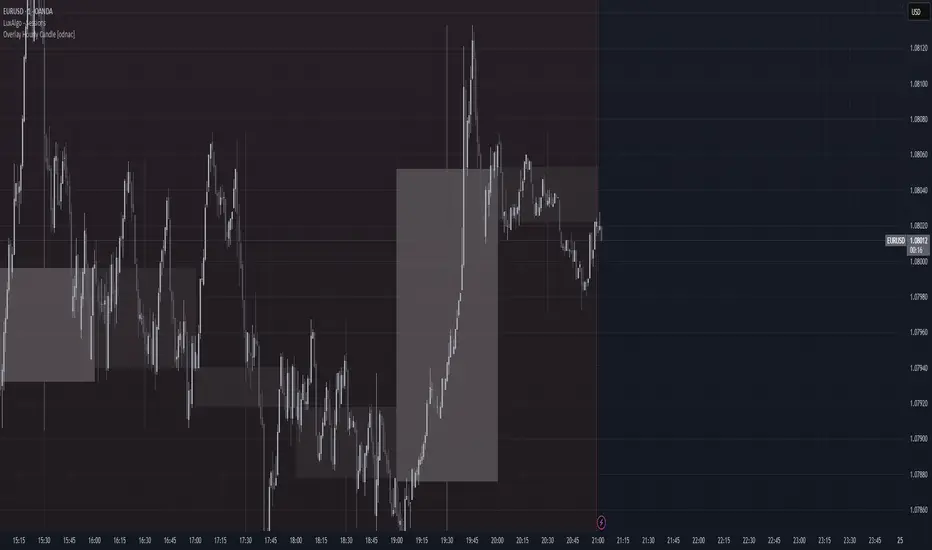
Overlay Hourly Candle [odnac] * This script overlays 1-hour candlestick representations on the chart.
* It captures the open, close, high, and low prices for each hourly period.
* The script dynamically updates as new hourly candles form and adjusts the
* box and wick positions accordingly.
*
* Features:
* - Draws an hourly candle with body and wicks.
* - Colors bullish candles in green and bearish candles in red.
* - Updates dynamically as new hourly candles form.
* - Uses TradingView's box and line functions to represent candle structures.
*
* Usage:
* - Add the script to your TradingView chart as an overlay.
* - Observe how the hourly candles appear distinctly on any timeframe.
IU Bigger than range strategyDESCRIPTION
IU Bigger Than Range Strategy is designed to capture breakout opportunities by identifying candles that are significantly larger than the previous range. It dynamically calculates the high and low of the last N candles and enters trades when the current candle's range exceeds the previous range. The strategy includes multiple stop-loss methods (Previous High/Low, ATR, Swing High/Low) and automatically manages take-profit and stop-loss levels based on user-defined risk-to-reward ratios. This versatile strategy is optimized for higher timeframes and assets like BTC but can be fine-tuned for different instruments and intervals.
USER INPUTS:
Look back Length: Number of candles to calculate the high-low range. Default is 22.
Risk to Reward: Sets the target reward relative to the stop-loss distance. Default is 3.
Stop Loss Method: Choose between:(Default is "Previous High/Low")
- Previous High/Low
- ATR (Average True Range)
- Swing High/Low
ATR Length: Defines the length for ATR calculation (only applicable when ATR is selected as the stop-loss method) (Default is 14).
ATR Factor: Multiplier applied to the ATR to determine stop-loss distance(Default is 2).
Swing High/Low Length: Specifies the length for identifying swing points (only applicable when Swing High/Low is selected as the stop-loss method).(Default is 2)
LONG CONDITION:
The current candle’s range (absolute difference between open and close) is greater than the previous range.
The closing price is higher than the opening price (bullish candle).
SHORT CONDITIONS:
The current candle’s range exceeds the previous range.
The closing price is lower than the opening price (bearish candle).
LONG EXIT:
Stop-loss:
- Previous Low
- ATR-based trailing stop
- Recent Swing Low
Take-profit:
- Defined by the Risk-to-Reward ratio (default 3x the stop-loss distance).
SHORT EXIT:
Stop-loss:
- Previous High
- ATR-based trailing stop
- Recent Swing High
Take-profit:
- Defined by the Risk-to-Reward ratio (default 3x the stop-loss distance).
ALERTS:
Long Entry Triggered
Short Entry Triggered
WHY IT IS UNIQUE:
This strategy dynamically adapts to different market conditions by identifying candles that exceed the previous range, ensuring that it only enters trades during strong breakout scenarios.
Multiple stop-loss methods provide flexibility for different trading styles and risk profiles.
The visual representation of stop-loss and take-profit levels with color-coded plots improves trade monitoring and decision-making.
HOW USERS CAN BENEFIT FROM IT:
Ideal for breakout traders looking to capitalize on momentum-driven price moves.
Provides flexibility to customize stop-loss methods and fine-tune risk management parameters.
Helps minimize drawdowns with a strong risk-to-reward framework while maximizing profit potential.

TR FVG & Swing High Low FinderTR FVG & Swing Level Finder
Overview:
The TR FVG & Swing Level Finder is a powerful Pine Script indicator designed for traders who want to identify Fair Value Gaps (FVGs) and Swing Highs/Lows on their charts. This indicator combines two essential technical analysis tools into one, helping traders spot potential areas of support, resistance, and trend reversals. FVGs are price gaps that often act as areas of interest for price to return to, while swing highs and lows help identify key turning points in the market. The indicator is highly customizable, allowing users to adjust colors, limits, and display options to suit their trading style.
Key Features:
1: Fair Value Gap (FVG) Detection:
- Identifies Bullish FVGs: Occur when the high of two candles ago is lower than the low of the current candle, indicating a potential upward price movement.
- Identifies Bearish FVGs: Occur when the low of two candles ago is higher than the high of the current candle, indicating a potential downward price movement.
- Displays FVGs as colored boxes on the chart, with customizable border and fill colors based on the timeframe.
- Labels each FVG box with the corresponding timeframe (e.g., "1m FVG", "1h FVG", "Daily FVG").
2: Swing High and Swing Low Detection:
- Detects Swing Highs: A 3-candle pattern where the middle candle's high is higher than the highs of the candles on either side.
- Detects Swing Lows: A 3-candle pattern where the middle candle's low is lower than the lows of the candles on either side.
- Draws a solid black line with 50% opacity at each swing high and low, extending 5 bars to the right for better visibility.
- Adds a small Swing High or Swing Low label at the right end of each line, colored according to user-defined settings.
3: Timeframe-Specific FVG Visualization:
- FVGs are color-coded based on the chart's timeframe, making it easy to distinguish between FVGs on different timeframes.
- Each timeframe has its own fill color for bullish and bearish FVGs, with adjustable transparency for better chart clarity.
- A dashed black line is drawn in the middle of each FVG box to highlight the midpoint of the gap.
4: Customizable Display Options:
- FVG Limit: Control the maximum number of FVGs displayed on the chart (from 1 to 20).
- Extend Options for FVG Boxes:
- "None": FVG boxes extend only 2 bars to the right.
- "Limited": FVG boxes extend a user-defined number of candles to the right (1 to 100 candles).
- "Default": FVG boxes extend 3 bars to the right of the current bar.
- Color Customization:
- Set border colors for bullish and bearish FVGs.
- Adjust fill colors for FVGs on different timeframes (1m, 5m, 15m, 30m, 1h, 4h, Daily, Weekly, Monthly).
- Customize the colors of swing high and swing low labels.
5: Performance Optimization:
- The indicator only plots FVGs and swings on the last confirmed bar (barstate.islastconfirmedhistory), ensuring efficient performance and reducing chart clutter.
- Limits the number of displayed FVGs and swings to the user-defined fvgLimit, keeping the chart clean and focused on the most recent price action.
6: Inputs and Customization:
- Number of FVGs to Show (fvgLimit): Set the maximum number of FVGs and swings to display (default: 3, range: 1 to 20).
- Bullish FVG Border Color (bullishColor): Choose the border color for bullish FVGs (default: green).
- Bearish FVG Border Color (bearishColor): Choose the border color for bearish FVGs (default: red).
- Swing High Color (swingHighColor): Set the color for swing high labels (default: blue).
- Swing Low Color (swingLowColor): Set the color for swing low labels (default: purple).
- Extend Options:
- Extend Option (extendOption): Choose how far FVG boxes extend to the right ("None", "Limited", or "Default"; default: "Default").
- Extend Candles (extendCandles): If "Limited" is selected, specify the number of candles to extend FVG boxes (default: 8, range: 1 to 100).
- Timeframe-Specific Fill Colors:
- Customize fill colors for bullish and bearish FVGs on various timeframes (1m, 5m, 15m, 30m, 1h, 4h, Daily, Weekly, Monthly).
- Each fill color has a default transparency (e.g., 93% for most timeframes, 90% for 30m), which can be adjusted as needed.
How to Use:
1: Add the Indicator to Your Chart:
- Open TradingView, go to the Pine Editor, and paste the script.
- Click "Add to Chart" to apply the indicator to your current chart.
2: Adjust Settings:
- Open the indicator settings by clicking the gear icon next to the indicator name on your chart.
- Modify the inputs to suit your preferences:
- Set the number of FVGs and swings to display.
- Choose your preferred colors for FVGs and swings.
- Adjust the extend options for FVG boxes.
3: Interpret the Indicator:
- FVG Boxes: Look for colored boxes on the chart, which represent Fair Value Gaps. Bullish FVGs (green borders by default) suggest potential buying opportunities, while bearish FVGs (red borders by default) suggest potential selling opportunities. The label inside each box indicates the timeframe of the FVG.
- Swing Highs and Lows: Identify key turning points with solid black lines (50% opacity) at swing highs and lows. Each line extends 5 bars to the right, with an "SH" (Swing High) or "SL" (Swing Low) label at the end. Swing highs can act as resistance levels, while swing lows can act as support levels.
4: Combine with Your Strategy:
- Use FVGs to identify areas where price might return to fill the gap, often acting as support or resistance.
- Use swing highs and lows to spot potential trend reversals or to set stop-loss and take-profit levels.
- Combine the indicator with other tools (e.g., trendlines, moving averages) for a more comprehensive trading strategy.
Notes:
- The indicator works on all timeframes, but the appearance of FVGs and swings will vary depending on the chart's timeframe.
- For best results, use the indicator on a clean chart to avoid visual clutter, especially if you increase the fvgLimit.
- The swing high/low lines are drawn with 50% opacity to ensure they don’t overpower other chart elements, but they are still clearly visible.
Author’s Note:
This script was developed to help traders identify key price levels with ease. I hope it adds value to your trading! If you have any feedback or suggestions for improvement, feel free to leave a comment. Happy trading!

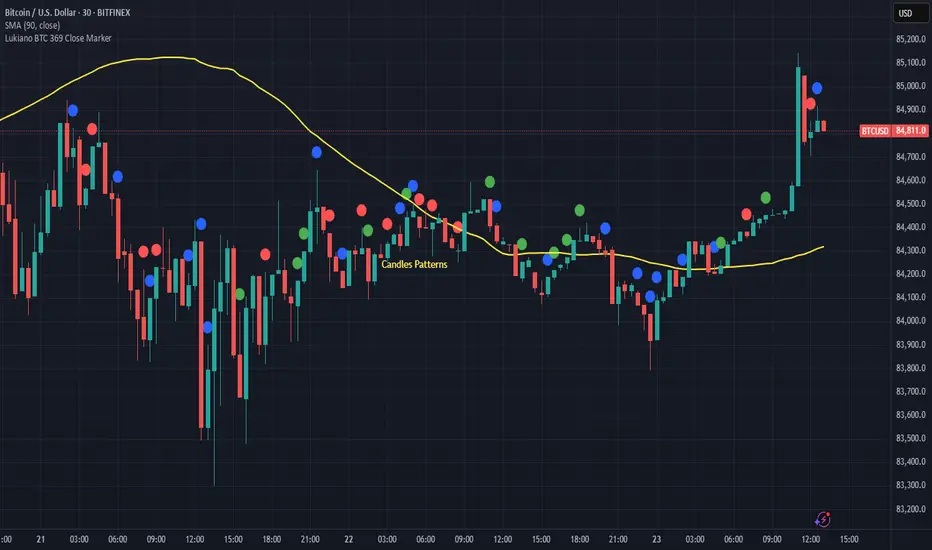
Lukiano BTC 369 Close MarkerThis indicator highlights candles where the closing price reduces to 3, 6, or 9 based on digital root calculation (sum of digits).
🔵 Blue dot = 3
🟢 Green dot = 6
🔴 Red dot = 9
Inspired by Tesla’s 369 theory and adapted for BTC traders who want to explore alternative energy-based signals.
Created by @Lukiano
RSI Candles with EMA byAuncleJoeThe Relative Strength Index (RSI) is one of the most widely used momentum indicators in trading. It helps traders assess whether an asset is overbought or oversold by measuring the speed and magnitude of recent price changes. Traditionally, RSI is displayed as a single line oscillating between 0 and 100, but this representation can sometimes make it difficult to spot trends, reversals, and momentum shifts effectively.
To enhance RSI visualization and usability, the RSI Candles with EMA indicator transforms the RSI values into candlestick charts, providing a more intuitive and dynamic way to analyze momentum. Unlike the traditional RSI line, this approach allows traders to observe RSI trends just as they would analyze price charts, making it easier to detect changes in momentum and trend strength.
Each RSI candle represents a specific period’s momentum activity. Green candles indicate that the RSI closed higher than it opened, signaling bullish momentum, while red candles suggest that the RSI closed lower than it opened, indicating bearish sentiment. This candlestick-style visualization helps traders spot RSI trends, breakouts, and reversals more effectively than a simple line chart.
To further refine momentum analysis, this indicator also includes an Exponential Moving Average (EMA) of RSI. The EMA smooths RSI fluctuations and provides a clearer trend direction. When RSI candles remain above the EMA, it suggests strong buying momentum, whereas RSI candles falling below the EMA indicate increasing selling pressure. This combination of RSI candlesticks and an EMA line allows traders to better identify shifts in market sentiment and potential trend reversals.
Additionally, the indicator includes customizable overbought and oversold levels (defaulted at 70 and 30, respectively). These levels help traders recognize when an asset might be overextended in either direction, potentially signaling an upcoming reversal. When RSI candles approach or cross these thresholds, traders can anticipate possible changes in market direction.
This indicator is particularly useful for a wide range of traders. Scalpers and day traders can leverage it to quickly identify short-term momentum shifts, while swing traders can use it to detect potential reversals in multi-day trends. Trend-following traders can confirm bullish or bearish trends based on RSI’s position relative to its EMA, and mean reversion traders can use it to spot extreme conditions where price action might snap back.
By combining RSI candlesticks with an EMA filter, this indicator provides a more dynamic and visually intuitive approach to momentum trading. It offers clearer trend signals, better reversal detection, and enhanced decision-making, making it an essential tool for traders who rely on RSI-based strategies.

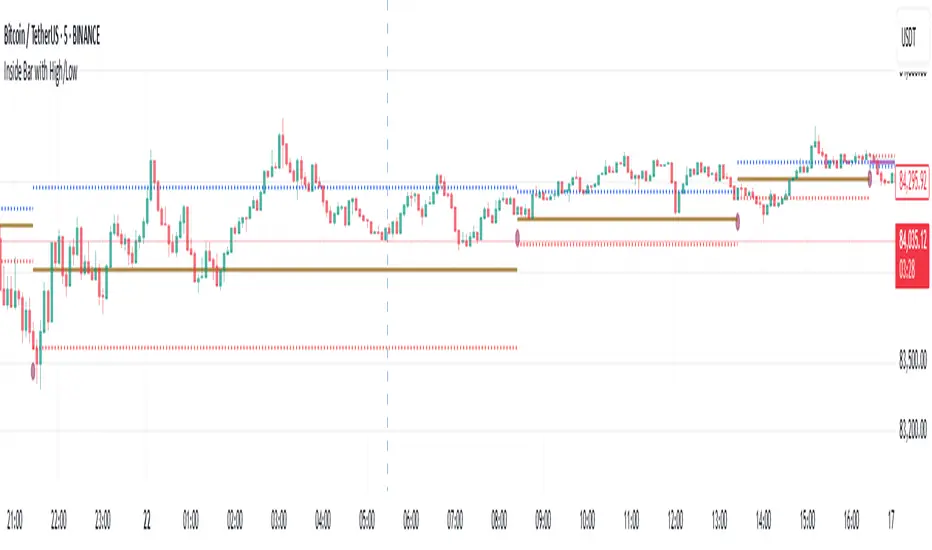
Inside Bar with High/LowInside Bar with High/Low
The indicator plots horizontal mid line between two Inside bars with High / Low with Multi Time Frame Selection by the user which can be traded in trending markets in the direction of the trend, when traded this way they are typically referred to as a ‘Breakout Play’ or an inside bar ‘Price Action Breakout Pattern’ They can also be traded counter-trend, typically from ‘Key Chart Levels’ , when traded this way they are often referred to as ‘Inside Bar Reversals’ .
The classic entry for an inside bar signal is to place a buy stop or sell stop at the high or low of the mother bar, and then when price breakouts above or below the mother bar, your entry order is filled with best time frame preferably more than 1 hour.
Stop loss placement is typically at the opposite end of the mother bar, or it can be placed near the mother bar halfway point (50% level), typically if the mother bar is larger than average.
It’s worth noting that these are the ‘classic’ or standard entry and stop loss placements for an inside bar setup is a useful tool for traders looking to identify potential reversals using the 20/50 EMA and candlestick patterns. However, like any trading tool, it should be used in conjunction with other indicators and analysis techniques for better accuracy
And also this tool is especially useful for day traders who want to track price action during specific times of the day and make informed decisions based on market behavior with more than 60 minutes period
As always, back testing and customization are recommended to optimize performance across different market conditions
In the end, experienced traders may decide on other entries or stop loss placements as they see fit.
Please remember that this indicator is provided for educational purposes only and does not constitute financial advice
Moyenne des EMA (5, 9, 20, 50, 100, 200)La moyenne des EMA 5,9,20,50,100,200 haut, bas, ouverture ou fermeture pour le calcul.

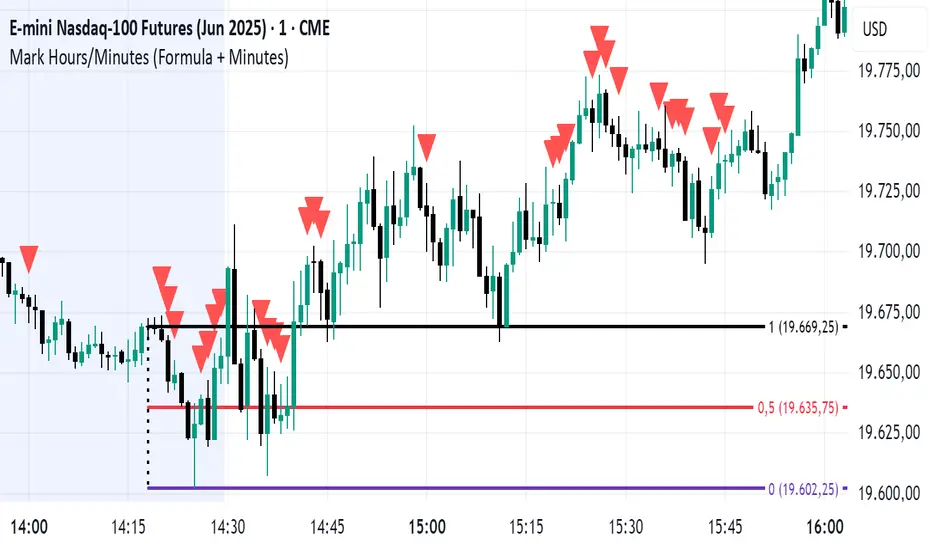
Mark Hours/Minutes (Formula + Minutes)This Pine Script code is a TradingView indicator that analyzes the hour and minutes of each candle in a 1-minute timeframe and plots a red triangle above the candle if one of the following conditions is met:
Sum/Difference Condition: The sum or the absolute difference of the hours and minutes is equal to 29, 35, or 71, with a tolerance of +/- 1.
Minutes Condition: The minutes are equal to 00, 29, or 35.
This indicator is based on the Goldbach theory and the "algo path" concept popularized by Hopiplaka, which posits that algorithmic trading paths often initiate from minute values of 00, 29, and 35. Use this indicator according to your trading strategy.
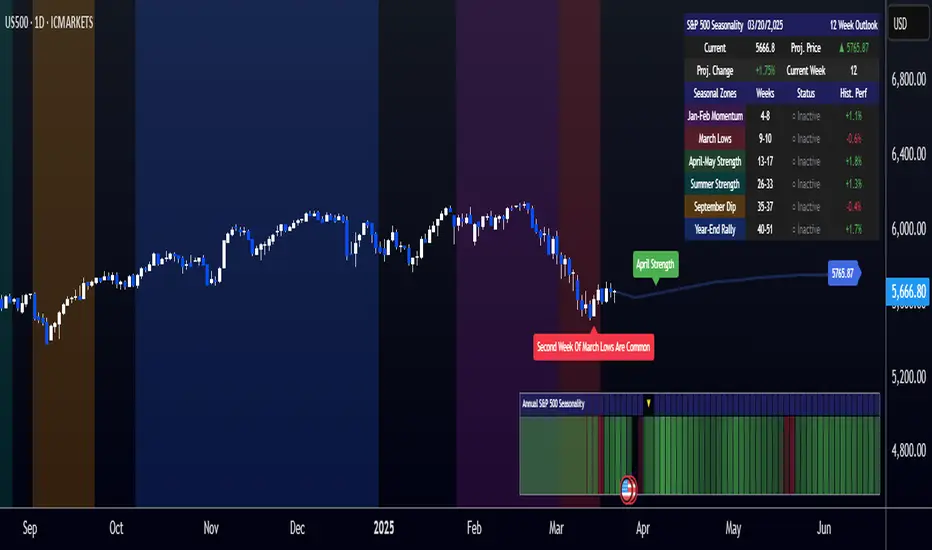
[COG]S&P 500 Weekly Seasonality ProjectionS&P 500 Weekly Seasonality Projection
This indicator visualizes S&P 500 seasonality patterns based on historical weekly performance data. It projects price movements for up to 26 weeks ahead, highlighting key seasonal periods that have historically affected market performance.
Key Features:
Projects price movements based on historical S&P 500 weekly seasonality patterns (2005-2024)
Highlights six key seasonal periods: Jan-Feb Momentum, March Lows, April-May Strength, Summer Strength, September Dip, and Year-End Rally
Customizable forecast length from 1-26 weeks with quick timeframe selection buttons
Optional moving average smoothing for more gradual projections
Detailed statistics table showing projected price and percentage change
Seasonality mini-map showing the full annual pattern with current position
Customizable colors and visual elements
How to Use:
Apply to S&P 500 index or related instruments (daily timeframe or higher recommended)
Set your desired forecast length (1-26 weeks)
Monitor highlighted seasonal zones that have historically shown consistent patterns
Use the projection line as a general guideline for potential price movement
Settings:
Forecast length: Configure from 1-26 weeks or use quick select buttons (1M, 3M, 6M, 1Y)
Visual options: Customize colors, backgrounds, label sizes, and table position
Display options: Toggle statistics table, period highlights, labels, and mini-map
This indicator is designed as a visual guide to help identify potential seasonal tendencies in the S&P 500. Historical patterns are not guarantees of future performance, but understanding these seasonal biases can provide valuable context for your trading decisions.
Note: For optimal visualization, use on Daily timeframe or higher. Intraday timeframes will display a warning message.
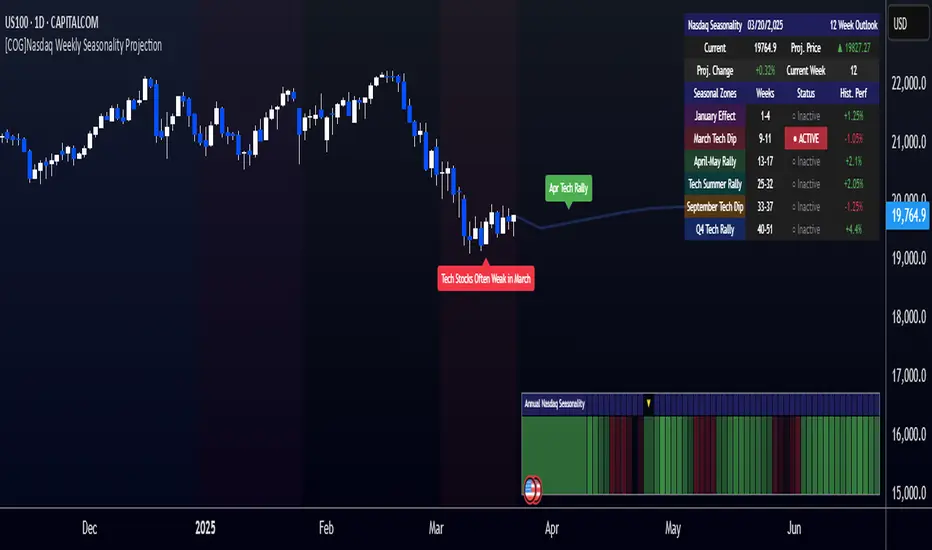
[COG]Nasdaq Weekly Seasonality ProjectionNasdaq Weekly Seasonality Projection
This indicator provides a visualization of Nasdaq seasonality patterns based on historical weekly performance data. It projects price movements for up to 26 weeks ahead, highlighting key seasonal periods that have historically affected tech stocks.
Key Features:
Projects price movements based on historical Nasdaq weekly seasonality patterns
Highlights six key seasonal periods: January Effect, March Lows, April-May Strength, Tech Summer Rally, September Dip, and Q4 Tech Rally
Customizable forecast length from 1-26 weeks with quick timeframe selection buttons
Optional moving average smoothing for more gradual projections
Detailed statistics table showing projected price and percentage change
Seasonality mini-map showing the full annual pattern with current position
Customizable colors and visual elements
How to Use:
Apply to Nasdaq indices or tech-focused instruments (daily timeframe or higher recommended)
Set your desired forecast length (1-26 weeks)
Monitor highlighted seasonal zones that have historically shown consistent patterns
Use the projection line as a general guideline for potential price movement
Settings:
Forecast length: Configure from 1-26 weeks or use quick select buttons (1M, 3M, 6M, 1Y)
Visual options: Customize colors, backgrounds, label sizes, and table position
Display options: Toggle statistics table, period highlights, labels, and mini-map
This indicator is designed as a visual guide to help identify potential seasonal tendencies in Nasdaq and tech stocks. Historical patterns are not guarantees of future performance, but understanding these seasonal biases can provide valuable context for your trading decisions.
Note: For optimal visualization, use on Daily timeframe or higher. Intraday timeframes will display a warning message.
Rotational Factor CalculationThe Rotational Factor is a simple, objective means for evaluating day timeframe attempted direction based on the market's half hour auction rotations. At any point in time during the day, the running tally can help keep general awareness for whether buyers or sellers are in control, and if a transition is taking place. It is also helpful to use as one of a handful of variables that categorize the session's Directional Performance to assist in possible direction for the next session. This method is from Dalton's Mind Over Market's book and in part helps answer the question, which way is the market trying to go? This can then be applied to the second question, is the market doing a good job in it's attempted direction? Staying aware of these two questions keeps current sentiment and expectations in check.
Calculation method
Each 30min RTH candle gets a score:
if the high is higher than the previous candle's high: +1
if the high is lower than the previous candle's high: -1
if the low is higher than the previous candle's low: +1
if the low is lower than the previous candle's low: -1
if the high (or low) of a candle is equal to the high (or low) of the previous candle: 0
The running tally intraday text is displayed in blue. Once the session closes the text is displayed in orange and remains listed over the final candle of the day for 30 days. The RTH candles are calculated until the end of the RTH session (3pm EST) even though the session's full tally is displayed over the final candle at 3:30pm EST.
