Avions Ultimate indicator70% wr backtest it yourself. works best on bitcoin 30m timeframe works the best for me
Candlestick analysis

PriceLevels GBHOW-TO: Goldbach Price Levels – Identify Algorithmic Key Zones
This open-source indicator highlights specific price levels ending with numbers like 03, 11, 29, 35, 65, and 71.
These values are often observed at key reversal or hesitation points and may align with algorithmic behavior patterns in the market.
What it does:
– Automatically scans and marks horizontal price levels containing these number endings
– You can toggle visibility for each number type
– Each level can have a custom color and line thickness
– Labels show price values at the end of each line
– Label color and transparency are fully customizable to match dark or light chart styles
This tool is designed to help traders visually spot recurring patterns that might otherwise go unnoticed.
It’s ideal for discretionary traders who want to study market structure through static price references.
This script is open-source and published for educational use.
For feedback or improvements, feel free to reach out via private message on TradingView.

Math by Thomas Liquidity PoolDescription
Math by Thomas Liquidity Pool is a TradingView indicator designed to visually identify potential liquidity pools on the chart by detecting areas where price forms clusters of equal highs or equal lows.
Bullish Liquidity Pools (Green Boxes): Marked below price where two adjacent candles have similar lows within a specified difference, indicating potential demand zones or stop loss clusters below support.
Bearish Liquidity Pools (Red Boxes): Marked above price where two adjacent candles have similar highs within the difference threshold, indicating potential supply zones or stop loss clusters above resistance.
This tool helps traders spot areas where smart money might hunt stop losses or where price is likely to react, providing valuable insight for trade entries, exits, and risk management.
Features:
Adjustable box height (vertical range) in points.
Adjustable maximum difference threshold between candle highs/lows to consider them equal.
Boxes automatically extend forward for visibility and delete when price sweeps through or after a defined lifetime.
Separate visual zones for bullish and bearish liquidity with customizable colors.
How to Use
Add the Indicator to your chart (preferably on instruments like Nifty where point-based thresholds are meaningful).
Adjust Inputs:
Box Height: Set the vertical size of the liquidity zones (default 15 points).
Max Difference Between Highs/Lows: Set the max price difference to consider two candle highs or lows as “equal” (default 10 points).
Box Lifetime: How many bars the box stays visible if not swept (default 120 bars).
Interpret Boxes:
Green Boxes (Bullish Liquidity Pools): Areas of potential demand and stop loss clusters below price. Watch for price bounces or accumulation near these zones.
Red Boxes (Bearish Liquidity Pools): Areas of potential supply and stop loss clusters above price. Watch for price rejections or distribution near these zones.
Trading Strategy Tips:
Use these zones to anticipate where stop loss hunting or liquidity sweeps may occur.
Combine with your Order Block, Fair Value Gap, and Market Structure tools for higher probability setups.
Manage risk by avoiding entries into price regions just before large liquidity pools get swept.
Automatic Cleanup:
Boxes delete automatically once price breaks above (for bearish zones) or below (for bullish zones) the zone or after the set lifetime.

1-Min Scalping Strategy with Trailing Stop (1 Contract)This is a 1 min scalp strategy specifically written for NQ futures with consistency in mind and stop losses with trailing stops. Happy trading. *** Not an investment advice***

Nifty Futures ATM Option Signal//@version=6
indicator('Nifty Futures ATM Option Signal', overlay = true)
// === Input symbols ===
// You must update these to match the live ATM options of current expiry.
niftyFutSymbol = input.symbol('NSE:NIFTY1!', 'Nifty Index Futures')
atmCallSymbol = input.symbol('NSE:NIFTY250605C24750', 'ATM Call Option (Same Expiry)')
atmPutSymbol = input.symbol('NSE:NIFTY250605P24750', 'ATM Put Option (Same Expiry)')
// === Get OHLC values from 5-minute charts ===
niftyOpen = request.security(niftyFutSymbol, '5', open)
niftyClose = request.security(niftyFutSymbol, '5', close)
callOpen = request.security(atmCallSymbol, '5', open)
callClose = request.security(atmCallSymbol, '5', close)
putOpen = request.security(atmPutSymbol, '5', open)
putClose = request.security(atmPutSymbol, '5', close)
// === Candle directions ===
niftyRed = niftyClose < niftyOpen
niftyGreen = niftyClose > niftyOpen
callGreen = callClose > callOpen
putGreen = putClose > putOpen
// === Trading signals ===
buySignal = niftyRed and callGreen
sellSignal = niftyGreen and putGreen
// === Plot signals on chart ===
plotshape(buySignal, title = 'Buy Signal', location = location.belowbar, color = color.green, style = shape.triangleup, size = size.small)
plotshape(sellSignal, title = 'Sell Signal', location = location.abovebar, color = color.red, style = shape.triangledown, size = size.small)
bgcolor(buySignal ? color.new(color.green, 85) : na, title = 'Buy Background')
bgcolor(sellSignal ? color.new(color.red, 85) : na, title = 'Sell Background')

🦌 Horn Pattern - Horn + FT - Ming Joo🦌 Horn Pattern Reversal Strategy (By Ming Joo)
This strategy is based on a 3-bar reversal pattern known as the Horn Pattern (bull-bear-bull for longs, bear-bull-bear for shorts). A confirmation bar (bar ) follows the pattern to validate a breakout.
🔍 Context Filter:
To ensure high-quality trades, a simple trend filter is applied using EMA(20):
✅ Bullish Horn signals are valid only if the confirmation bar closes above EMA20
✅ Bearish Horn signals are valid only if the confirmation bar closes below EMA20
This prevents taking counter-trend reversals in weak conditions.
🎯 Entry Logic:
Long entry: Horn high + 1 tick
Short entry: Horn low – 1 tick
Target: 1R
Stop: Structural extreme (low/high of the horn)
Optionally shows 0.5R line
This structure-based reversal model is suitable for 5min–1H timeframes, and works best on volatile instruments (e.g. ES1!, NQ1!, BTCUSD, AAPL).

OBHOW-TO: Advanced Order Block & Liquidity Mapping Tool
This script combines order block detection using 3- and 5-bar fractal structures with dynamic and static liquidity zones, plus optional time-based label calculations.
Key features:
– Fractal-based detection of bullish and bearish order blocks
– Automatic removal of broken OBs to keep charts clean
– Optional FVG validation for higher-quality OBs
– Custom time label logic for bar/session analysis
– Configurable visuals: line styles, widths, label placement, and time offsets
The logic for liquidity detection is adapted from the open-source LiquidityFinderLibrary by TFlab. This version adds custom cleanup behavior and visual enhancements to improve usability.
This script is published as open-source and intended for educational and analytical use only. No performance guarantees are implied.
If you have questions or suggestions, feel free to message me privately on TradingView.

Year/Quarter Open LevelsDeveloped by ADEL CEZAR and inspired by insights from ERDAL Y, this indicator is designed to give traders a clear edge by automatically plotting the Yearly Open and Quarterly Open levels — two of the most critical institutional reference points in price action.
These levels often act as magnets for liquidity, bias confirmation zones, and support/resistance pivots on higher timeframes. With customizable settings, you can display multiple past opens, fine-tune label positions, and align your strategy with high-timeframe structure — all in a lightweight, non-intrusive design.
If you follow Smart Money Concepts (SMC), ICT models, or build confluence using HTF structures and range theory, this script will integrate seamlessly into your workflow.

Fractals 1hFractals 1h, visible on 5m TF.
This indicator allows me to backtest my strategy "from zone to zone"...

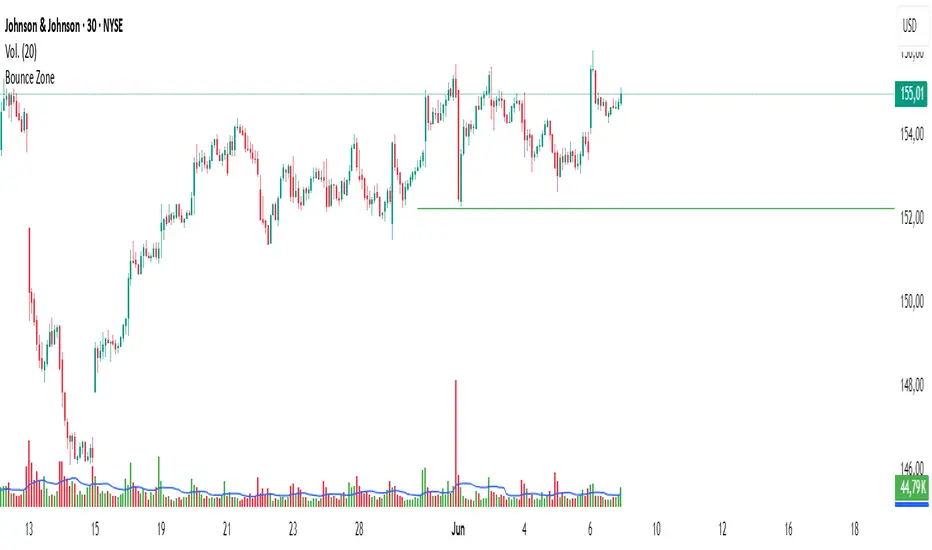
Bounce Zone📘 Bounce Zone – Indicator Description
The "Bounce Zone" indicator is a custom tool designed to highlight potential reversal zones on the chart based on volume exhaustion and price structure. It identifies sequences of candles with low volume activity and marks key price levels that could act as "bounce zones", where price is likely to react.
🔍 How It Works
Volume Analysis:
The indicator calculates a Simple Moving Average (SMA) of volume (default: 20 periods).
It looks for at least 6 consecutive candles (configurable) where the volume is below this volume SMA.
Color Consistency:
The candles must all be of the same color:
Green candles (bullish) for potential downward bounce zones.
Red candles (bearish) for potential upward bounce zones.
Zone Detection:
When a valid sequence is found:
For green candles: it draws a horizontal line at the low of the last red candle before the sequence.
For red candles: it draws a horizontal line at the high of the last green candle before the sequence.
Bounce Tracking:
Each horizontal line remains on the chart until it is touched twice by price (high or low depending on direction).
After two touches, the line is automatically removed, indicating the zone has fulfilled its purpose.
📈 Use Cases
Identify areas of price exhaustion after strong directional pushes.
Spot liquidity zones where institutions might step in.
Combine with candlestick confirmation for reversal trades.
Useful in both trending and range-bound markets for entry or exit signals.
⚙️ Parameters
min_consecutive: Minimum number of consecutive low-volume candles of the same color (default: 6).
vol_ma_len: Length of the volume moving average (default: 20).
🧠 Notes
The indicator does not repaint and is based purely on historical candle and volume structure.
Designed for manual strategy confirmation or support for algorithmic setups.
ETH Day TraderThis is the new script I try creating with chatgpt. The winrate is low but the profit is higher than expected. Please help me revise and let's improve it together. BINANCE:ETHUSDT

Market State [wundaba]General market overview indicator
Add your own symbols
Credits to Luon MC for the idea

JonnyBtc Daily Pullback Strategy (Volume + ADX)📈 JonnyBtc Daily Optimized Pullback Strategy (With Volume + ADX)
This strategy is designed for Bitcoin swing trading on the daily timeframe and uses a combination of price action, moving averages, volume, RSI, and ADX strength filtering to time high-probability entries during strong trending conditions.
🔍 Strategy Logic:
Trend Filter: Requires price to be aligned with both 50 EMA and 200 EMA.
Pullback Entry: Looks for a pullback to a fast EMA (default 21) and a crossover signal back above it.
RSI Confirmation: RSI must be above a minimum threshold for long entries (default 55), or below for short entries.
Volume Filter: Entry is confirmed only when volume is above a 20-day average.
ADX Filter: Only enters trades when ADX is above a strength threshold (default 20), filtering out sideways markets.
Trailing Stop (optional): Uses ATR-based trailing stop-loss and take-profit system, fully configurable.
⚙️ Default Settings:
Timeframe: Daily
Trade Direction: Long-only by default (can be toggled)
Trailing Stop: Enabled (can disable)
Session Filter: Off by default for daily timeframe
📊 Best Use:
Optimized for Bitcoin (BTCUSD) on the 1D chart
Can be adapted to other trending assets with proper tuning
Works best in strong trending markets — not ideal for choppy/ranging conditions
🛠️ Customizable Parameters:
EMA lengths (Fast, Mid, Long)
RSI and ADX thresholds
ATR-based TP/SL multipliers
Trailing stop toggle
Volume confirmation toggle
Time/session filter
⚠️ Disclaimer:
This script is for educational and research purposes only. Past performance does not guarantee future results. Always backtest and verify before trading with real funds.

AD Pro//@version=5
indicator("AD Pro", overlay=true)
// === Inputs
atrLen = input.int(14, "ATR Length")
factor = input.float(0.7, "Factor")
slMultiplier = input.float(2.0, "SL Multiplier")
// Volatility Filter Input
atrFilterStrength = input.float(1.0, "Volatility Threshold (x Avg ATR)", step=0.1, minval=0.1)
// Min % Price Change Filter
enableMinMove = input.bool(true, "Enable Min % Price Change Filter")
lookbackBars = input.int(20, "Lookback Bars")
minMovePct = input.float(0.005, "Min % Price Change", step=0.001, minval=0)
// TP Buy colors
tp1BuyColor = input.color(color.lime, "TP1 Buy Color")
tp2BuyColor = input.color(color.green, "TP2 Buy Color")
tp3BuyColor = input.color(color.teal, "TP3 Buy Color")
// TP Sell colors
tp1SellColor = input.color(color.fuchsia, "TP1 Sell Color")
tp2SellColor = input.color(color.red, "TP2 Sell Color")
tp3SellColor = input.color(color.maroon, "TP3 Sell Color")
// SL colors
slBuyColor = input.color(color.blue, "SL Buy Color")
slSellColor = input.color(color.blue, "SL Sell Color")
// === Indicator Calculations
atr = ta.atr(atrLen)
avgATR = ta.sma(atr, 50)
atrCondition = atr > avgATR * atrFilterStrength
priceChange = math.abs(close - close ) / close
priceMoveOK = priceChange > minMovePct
priceChangeCondition = not enableMinMove or priceMoveOK
volatilityOK = atrCondition and priceChangeCondition
// === UT Bot Logic
src = close
var float trailPrice = na
var bool dirLong = true
longStop = src - factor * atr
shortStop = src + factor * atr
if na(trailPrice)
trailPrice := longStop
dirLong := true
else
if dirLong
trailPrice := math.max(trailPrice, longStop)
dirLong := src > trailPrice
else
trailPrice := math.min(trailPrice, shortStop)
dirLong := src > trailPrice
rawBuy = dirLong and not dirLong
rawSell = not dirLong and dirLong
// Apply Volatility Filter
buySignal = rawBuy and volatilityOK
sellSignal = rawSell and volatilityOK
// === Entry & Label Storage
var float entryPrice = na
var bool lastSignalIsBuy = na
var label tp1Lbl = na
var label tp2Lbl = na
var label tp3Lbl = na
var label slLbl = na
var line tp1Line = na
var line tp2Line = na
var line tp3Line = na
var line slLine = na
if buySignal or sellSignal
if not na(tp1Lbl)
label.delete(tp1Lbl)
if not na(tp2Lbl)
label.delete(tp2Lbl)
if not na(tp3Lbl)
label.delete(tp3Lbl)
if not na(slLbl)
label.delete(slLbl)
if not na(tp1Line)
line.delete(tp1Line)
if not na(tp2Line)
line.delete(tp2Line)
if not na(tp3Line)
line.delete(tp3Line)
if not na(slLine)
line.delete(slLine)
entryPrice := close
lastSignalIsBuy := buySignal
tp1 = entryPrice + (buySignal ? 1 : -1) * atr
tp2 = entryPrice + (buySignal ? 2 : -2) * atr
tp3 = entryPrice + (buySignal ? 3 : -3) * atr
sl = entryPrice - (buySignal ? 1 : -1) * factor * atr * slMultiplier
tp1Lbl := label.new(bar_index, tp1, "TP1 " + str.tostring(tp1, format.mintick),
style=label.style_label_right,
color=buySignal ? tp1BuyColor : tp1SellColor,
textcolor=color.black)
tp2Lbl := label.new(bar_index, tp2, "TP2 " + str.tostring(tp2, format.mintick),
style=label.style_label_right,
color=buySignal ? tp2BuyColor : tp2SellColor,
textcolor=color.white)
tp3Lbl := label.new(bar_index, tp3, "TP3 " + str.tostring(tp3, format.mintick),
style=label.style_label_right,
color=buySignal ? tp3BuyColor : tp3SellColor,
textcolor=color.white)
slLbl := label.new(bar_index, sl, "SL " + str.tostring(sl, format.mintick),
style=label.style_label_right,
color=buySignal ? slBuyColor : slSellColor,
textcolor=color.white)
tp1Line := line.new(bar_index, tp1, bar_index + 1, tp1,
color=buySignal ? tp1BuyColor : tp1SellColor, style=line.style_dashed)
tp2Line := line.new(bar_index, tp2, bar_index + 1, tp2,
color=buySignal ? tp2BuyColor : tp2SellColor, style=line.style_dashed)
tp3Line := line.new(bar_index, tp3, bar_index + 1, tp3,
color=buySignal ? tp3BuyColor : tp3SellColor, style=line.style_dashed)
slLine := line.new(bar_index, sl, bar_index + 1, sl,
color=buySignal ? slBuyColor : slSellColor, style=line.style_dashed)
// === Plot Signals
plotshape(buySignal, title="Buy", location=location.belowbar, color=color.green, style=shape.labelup, text="BUY")
plotshape(sellSignal, title="Sell", location=location.abovebar, color=color.red, style=shape.labeldown, text="SELL")
// === Alerts
alertcondition(buySignal, title="Buy Alert", message="Buy Signal!")
alertcondition(sellSignal, title="Sell Alert", message="Sell Signal!")

Nifty Futures vs ATM Option Candle Mismatch//@version=5
indicator("Nifty Futures vs ATM Option Candle Mismatch", overlay=true)
// === Input symbols (modify these as needed) ===
niftySymbol = input.symbol("NSE:NIFTY1!", "Nifty Futures Symbol")
atmOptionSymbol = input.symbol("NSE:NIFTY24JUN22400CE", "ATM Option Symbol") // Replace with real ATM symbol dynamically
// === Get 5-min candles from both instruments ===
niftyClose = request.security(niftySymbol, "5", close)
niftyOpen = request.security(niftySymbol, "5", open)
optionClose = request.security(atmOptionSymbol, "5", close)
optionOpen = request.security(atmOptionSymbol, "5", open)
// === Determine candle color (green or red) ===
niftyGreen = niftyClose > niftyOpen
optionGreen = optionClose > optionOpen
// === Condition: Mismatch in candle direction ===
mismatch = (niftyGreen != optionGreen)
// === Plot an icon or background when mismatch occurs ===
plotshape(mismatch, title="Mismatch Signal", location=location.abovebar, color=color.red, style=shape.triangledown, size=size.small)
bgcolor(mismatch ? color.new(color.red, 85) : na, title="Mismatch Background")

Nifty Futures vs ATM Options Signal//@version=5
indicator("Nifty Futures vs ATM Options Signal", overlay=true)
// === Input Symbols ===
// Use appropriate symbols available in your TradingView account
niftyFutSymbol = input.symbol("NSE:NIFTY1!", "Nifty Futures")
atmCallSymbol = input.symbol("NSE:NIFTY24JUN22400CE", "ATM Call Option")
atmPutSymbol = input.symbol("NSE:NIFTY24JUN22400PE", "ATM Put Option")
// === Fetch OHLC from 5-min candles for all symbols ===
niftyOpen = request.security(niftyFutSymbol, "5", open)
niftyClose = request.security(niftyFutSymbol, "5", close)
callOpen = request.security(atmCallSymbol, "5", open)
callClose = request.security(atmCallSymbol, "5", close)
putOpen = request.security(atmPutSymbol, "5", open)
putClose = request.security(atmPutSymbol, "5", close)
// === Condition 1: Buy Signal ===
// Nifty Futures RED candle and ATM Call Option GREEN candle
buySignal = (niftyClose < niftyOpen) and (callClose > callOpen)
// === Condition 2: Sell Signal ===
// Nifty Futures GREEN candle and ATM Put Option GREEN candle
sellSignal = (niftyClose > niftyOpen) and (putClose > putOpen)
// === Plot Buy/Sell Signals ===
plotshape(buySignal, title="Buy Signal", location=location.belowbar, color=color.green, style=shape.triangleup, size=size.small)
plotshape(sellSignal, title="Sell Signal", location=location.abovebar, color=color.red, style=shape.triangledown, size=size.small)
bgcolor(buySignal ? color.new(color.green, 85) : na, title="Buy Background")
bgcolor(sellSignal ? color.new(color.red, 85) : na, title="Sell Background")

David_FairPriceCandlestick_calculatedDescription:
This indicator displays the "Typical Price" for each candle as a visual marker (cross) directly on the chart. The Typical Price is calculated as the average of the High, Low, and Close values of each bar:
(High + Low + Close) / 3
The marker provides a quick visual reference to the fair or average price level within every single candle.
Unlike a Point of Control (POC) or volume-based indicators, this script works purely with price data and is independent of volume or order flow.
Use cases:
Identify where most trading activity may have been concentrated within the candle (for price-based strategies)
Support as a reference line for mean-reversion or fair value concepts
Works on all timeframes and instruments
Customization:
You can easily change the marker style (cross, dot, triangle, etc.) and color within the script.

🦌 Horn Pattern - Horn + FT - Ming Joo太棒了!以下是你策略的中英文简介版本,专为 **TradingView 发布页面** 编写,突出你当前唯一的 context filter(基于 EMA20)。
---
## 🇬🇧 English Description — Horn Pattern Strategy with EMA Context Filter
**🦌 Horn Pattern Reversal Strategy (By Ming Joo)**
This strategy is based on a 3-bar reversal pattern known as the **Horn Pattern** (bull-bear-bull for longs, bear-bull-bear for shorts). A confirmation bar (bar\ ) follows the pattern to validate a breakout.
🔍 **Context Filter:**
To ensure high-quality trades, a simple trend filter is applied using EMA(20):
* ✅ **Bullish Horn** signals are valid **only if** the confirmation bar closes **above EMA20**
* ✅ **Bearish Horn** signals are valid **only if** the confirmation bar closes **below EMA20**
This prevents taking counter-trend reversals in weak conditions.
🎯 Entry Logic:
* Long entry: Horn high + 1 tick
* Short entry: Horn low – 1 tick
* Target: 1R
* Stop: Structural extreme (low/high of the horn)
* Optionally shows 0.5R line
This structure-based reversal model is suitable for 5min–1H timeframes, and works best on volatile instruments (e.g. ES1!, NQ1!, BTCUSD, AAPL).
---
## 🇨🇳 中文简介 — Horn 结构反转策略(含 EMA 趋势滤网)
**🦌 Horn 反转策略(By Ming Joo)**
本策略基于经典的 **Horn 形态**(多头为 bull-bear-bull,空头为 bear-bull-bear),由三根结构K线 + 一根确认K线构成,搭配 **EMA20 趋势过滤器** 筛选优质信号。
🔍 **上下文过滤条件(唯一 context filter):**
* ✅ **Bullish Horn** 仅在确认K线的收盘 **高于 EMA20** 时触发
* ✅ **Bearish Horn** 仅在确认K线的收盘 **低于 EMA20** 时触发
防止在弱趋势中逆势进场,提升成功率。
🎯 入场逻辑:
* 多头:Horn 高点 +1 tick 挂多
* 空头:Horn 低点 –1 tick 挂空
* 止盈:1R
* 止损:Horn 的结构极点
* 可选显示 0.5R 虚线
适合用于 5分钟至 1小时图表,特别适用于高波动性品种(如 ES1!, NQ1!, BTCUSD, AAPL 等)。
---

Liquidity Sweep Strategy [Enhanced]liquidity sweep simplifier
break of structure, move back into zone which pushes prices in the same direction, sweep of liquidity and entry

AD BackGrand//@version=5
indicator("AD BackGrand", overlay=true)
// فقط برای XAUUSD اجرا بشه
isGold = syminfo.ticker == "XAUUSD"
// ⚙️ ورودیها
threshold = input.float(4.0, title="🟡 Volatility Threshold ($)", minval=0.1, step=0.1)
candleCount = input.int(3, title="🕒 Number of Candles to Check", minval=1, maxval=50)
// محاسبه مجموع نوسان کندلها (داینامیک)
totalVol = 0.0
for i = 0 to candleCount - 1
totalVol += high - low
// شرطها
isVolatile = isGold and (totalVol > threshold)
isCalm = isGold and (totalVol <= threshold)
// رنگ بکگراند
bgcolor(isVolatile ? color.new(color.green, 80) : na, title="High Volatility")
bgcolor(isCalm ? color.new(color.red, 85) : na, title="Low Volatility")
// نمایش مجموع نوسان (اختیاری)
plot(isGold ? totalVol : na, title="🔢 Total Volatility", color=color.orange)

Candle Body Strength CounterThis indicator measures the total bullish and bearish candle body strength over a user-defined lookback period. For each bar, it sums the absolute body sizes of bullish candles (where close > open) and bearish candles (where close < open) within the lookback window. The result is two lines: one for bullish body strength and one for bearish body strength, making it easy to spot shifts in market momentum and bias.
Adjustable lookback period (default: 20 bars)
Green line: cumulative bullish body strength
Red line: cumulative bearish body strength
Use this tool to quickly assess which side (bulls or bears) has been stronger over your chosen timeframe.

Gold Buy/Sell Signals with Engulfing & S&D ZonesTrade base on the Fast & Slow Moving Average. When the Fast MA line is below the candle, it is an uptrend to BUY. if Fast MA line is above the candle, it's time to SELL.

