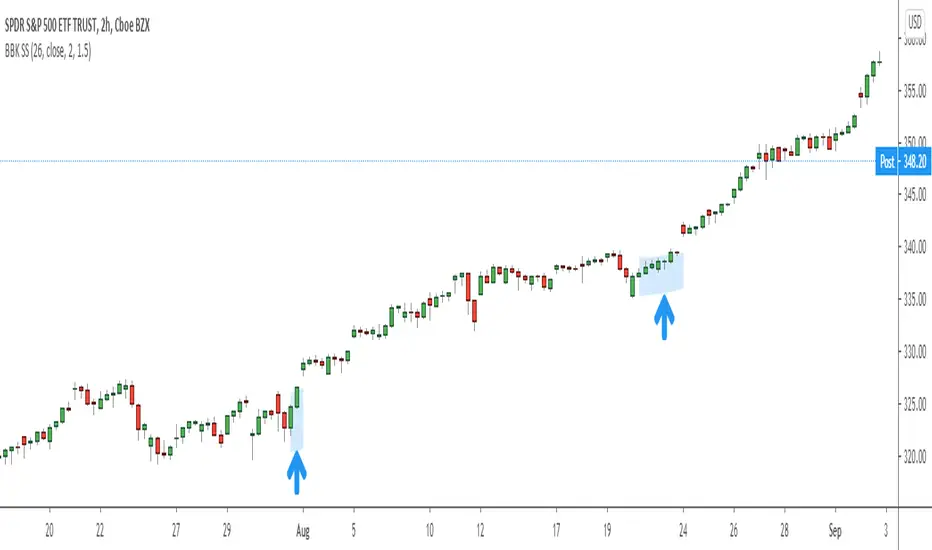
Spread Entry Balance of PowerThis is a bar chart showing the strength of a potential option spread entry using 8 conditions for each side of a trade, bull or bear.
In theory, if the SE Strength (Spread Entry Strength) is at one of the extremes of the Bear or Bull side, then a spread is prime for entry.
To calculate this, the 8 conditions receive a 1 or zero dependent on whether the condition is true (1) or false (0), and then all of those are summed. The primary gist of the strength comes from Nishant's book, or my interpretation thereof, with some additives that limits what I need to review (such as condition 8 below.)
The 8 Bull Conditions are:
1) Bollinger Bands are outside of the Keltner Channels
2) ADX is trending up
3) RSI is trending up
4) -DI is trending down
5) RSI is under 30
6) Price is below the lower Keltner Channel
7) Price is between the lower Bollinger Band and the Bollinger basis.
8) Price at one point within the last 5 bars was below the lower Bollinger Band
The 8 Bear Conditions are the inverse conditions (except the first), and the conditions are given a negative disposition (meaning they sum to -8 :)):
1) Bollinger Bands are outside of the Keltner Channels
2) ADX is trending down
3) RSI is trending down
4) +DI is trending up
5) RSI is over 70
6) Price is above the upper Keltner Channel
7) Price is between the upper Bollinger Band and the Bollinger basis.
8) Price at one point within the last 5 bars was above the upper Bollinger Band
肯特納通道(KC)

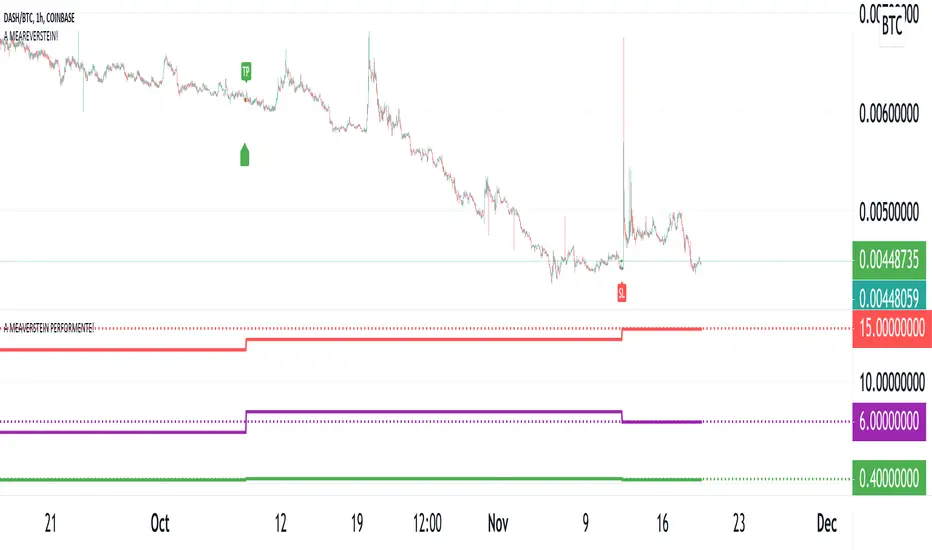
Meareverstein (mean-reversion)This script uses basic statistics to exploit mean-reversion conditions in the market.
The idea of mean-reversion is similar to stretching an elastic band. After a certain level, the potential energy to snap back to the initial position increases. For the case of the markets, the initial position is the mean price.
Entries and exits are clearly represented visually, with TP/SL texts when either is being hit.
The default risk-reward ratio is 1.5.
The script can be used on most liquid assets (minimal slippage)
Refer to "Meareverstein performente" below for the accompanying script that showcases the performance in real time.
Data provided will be: Total number of trades, Total returns, and Expectancy.
Square Root Moving AverageAbstract
This script computes moving averages which the weighting of the recent quarter takes up about a half weight.
This script also provides their upper bands and lower bands.
You can apply moving average or band strategies with this script.
Introduction
Moving average is a popular indicator which can eliminate market noise and observe trend.
There are several moving average related strategies used by many traders.
The first one is trade when the price is far from moving average.
To measure if the price is far from moving average, traders may need a lower band and an upper band.
Bollinger bands use standard derivation and Keltner channels use average true range.
In up trend, moving average and lower band can be support.
In ranging market, lower band can be support and upper band can be resistance.
In down trend, moving average and upper band can be resistance.
An another group of moving average strategy is comparing short term moving average and long term moving average.
Moving average cross, Awesome oscillators and MACD belong to this group.
The period and weightings of moving averages are also topics.
Period, as known as length, means how many days are computed by moving averages.
Weighting means how much weight the price of a day takes up in moving averages.
For simple moving averages, the weightings of each day are equal.
For most of non-simple moving averages, the weightings of more recent days are higher than the weightings of less recent days.
Many trading courses say the concept of trading strategies is more important than the settings of moving averages.
However, we can observe some characteristics of price movement to design the weightings of moving averages and make them more meaningful.
In this research, we use the observation that when there are no significant events, when the time frame becomes 4 times, the average true range becomes about 2 times.
For example, the average true range in 4-hour chart is about 2 times of the average true range in 1-hour chart; the average true range in 1-hour chart is about 2 times of the average true range in 15-minute chart.
Therefore, the goal of design is making the weighting of the most recent quarter is close to the weighting of the rest recent three quarters.
For example, for the 24-day moving average, the weighting of the most recent 6 days is close to the weighting of the rest 18 days.
Computing the weighting
The formula of moving average is
sum ( price of day n * weighting of day n ) / sum ( weighting of day n )
Day 1 is the most recent day and day k+1 is the day before day k.
For more convenient explanation, we don't expect sum ( weighting of day n ) is equal to 1.
To make the weighting of the most recent quarter is close to the weighting of the rest recent three quarters, we have
sum ( weighting of day 4n ) = 2 * sum ( weighting of day n )
If when weighting of day 1 is 1, we have
sum ( weighting of day n ) = sqrt ( n )
weighting of day n = sqrt ( n ) - sqrt ( n-1 )
weighting of day 2 ≒ 1.414 - 1.000 = 0.414
weighting of day 3 ≒ 1.732 - 1.414 = 0.318
weighting of day 4 ≒ 2.000 - 1.732 = 0.268
If we follow this formula, the weighting of day 1 is too strong and the moving average may be not stable.
To reduce the weighting of day 1 and keep the spirit of the formula, we can add a parameter (we call it as x_1w2b).
The formula becomes
weighting of day n = sqrt ( n+x_1w2b ) - sqrt ( n-1+x_1w2b )
if x_1w2b is 0.25, then we have
weighting of day 1 = sqrt(1.25) - sqrt(0.25) ≒ 1.1 - 0.5 = 0.6
weighting of day 2 = sqrt(2.25) - sqrt(1.25) ≒ 1.5 - 1.1 = 0.4
weighting of day 3 = sqrt(3.25) - sqrt(2.25) ≒ 1.8 - 1.5 = 0.3
weighting of day 4 = sqrt(4.25) - sqrt(3.25) ≒ 2.06 - 1.8 = 0.26
weighting of day 5 = sqrt(5.25) - sqrt(4.25) ≒ 2.3 - 2.06 = 0.24
weighting of day 6 = sqrt(6.25) - sqrt(5.25) ≒ 2.5 - 2.3 = 0.2
weighting of day 7 = sqrt(7.25) - sqrt(6.25) ≒ 2.7 - 2.5 = 0.2
What you see and can adjust in this script
This script plots three moving averages described above.
The short term one is default magenta, 6 days and 1 atr.
The middle term one is default yellow, 24 days and 2 atr.
The long term one is default green, 96 days and 4 atr.
I arrange the short term 6 days to make it close to sma(5).
The other twos are arranged according to 4x length and 2x atr.
There are 9 curves plotted by this script. I made the lower bands and the upper bands less clear than moving averages so it is less possible misrecognizing lower or upper bands as moving averages.
x_src : how to compute the reference price of a day, using 1 to 4 of open, high, low and close.
len : how many days are computed by moving averages
atr : how many days are computed by average true range
multi : the distance from the moving average to the lower band and the distance from the moving average to the lower band are equal to multi * average true range.
x_1w2b : adjust this number to avoid the weighting of day 1 from being too strong.
Conclusion
There are moving averages which the weighting of the most recent quarter is close to the weighting of the rest recent three quarters.
We can apply strategies based on moving averages. Like most of indicators, oversold does not always means it is an opportunity to buy.
If the short term lower band is close to the middle term moving average or the middle term lower band is close to the long term moving average, it may be potential support value.
References
Computing FIR Filters Using Arrays
How to trade with moving averages : the eight trading signals concluded by Granville
How to trade with Bollinger bands
How to trade with double Bollinger bands
Volatility Squeeze Region IndicatorVolatility Squeeze Indicator conditions based on lowest ATR ,proportion of Bollinger and keltner channel upper and lower bands. Usage to identify and highlight Squeeze region when if indicator value <1 means Squeeze On and >1 means Squeeze off .
Additionally Background Highlights for Daily(Blue), Weekly(Brown) and Monthly(purple) Squeeze regimes for confluence check. For Breakouts and trades use appropriate Price Action and in conjunction other indicators.
Tobacco ChannelThese bands use KAMA for the basis, build Keltner Channels that you might expect high probability reversals to occur from.
I named it Tobacco Channel because I found its idea in Cuban's Reversion Bands — Indicator by cubantobacco.

BB Keltner Squeeze Signal 1.0Made this to signal when the criteria is met for a "Bollinger Band + Keltner Channel Squeeze" signal. This is when one or both of the Bollinger Bands come inside the Keltner Channel. When this happens the bars are highlighted. The idea of this script is to clean up charts as much as possible.
Bollinger Bands are measures of standard deviation from a simple moving average. This is the distance that price travels as a whole over time. Keltner Channels are a measure of ATR from an exponential moving average. This is the average range of individual bars.
Both indicators measure volatility and when they contract indicate that price is consolidation. A very tight consolidation can often be a prelude to an expansion of volatility and price movement. It can be a signal for a potential breakout or confirmation one will be successful.
The actual Bollinger Bands and Keltner Channels are turned off by default but can be turned on in the script settings. I also use 26 as the default length but it can be changed.
Volatility Bands by DGTVolatility represents how large an asset's prices swing around the mean price, the degree of variation of a trading price over time, and is commonly measured with beta (β) coefficients, standard deviations (σ) of returns where tools such as Average True Range, Bollinger Bands, Keltner Channel, Squeeze Indicator, etc presents volatility concept
Volatility often refers to the amount of uncertainty or risk related to the size of changes in a security's value. The higher the volatility, the riskier the security - the price of the security can change dramatically over a short time period in either direction. A lower volatility - security's value does not fluctuate dramatically, and tends to be more steady
This study, Volatility Bands , attempts to present a way to measure and visualize volatility , using standard deviations (σ) and average true range indicator, and aims to point out areas that might indicate potential trading opportunities
I will try to explain the usage with examples,
same setup with different option selected
as you may observe from the examples different setting may have advantages and disadvantages over one another, it is recommended to verify a trading setup with different available options.
Additionally, It is recommended to use this indicator in conjunction with other technical indicators, or verify using chart/candle patterns. Below is an usage example using in conjunction with other indicator, in the given example “Neglected Volume by DGT” is selected
Similarities and Differences
Bollinger Bands depicts two standard deviations above and below a simple moving average, and Keltner Channel depicts two times average true range (ATR) above and below an exponential moving average
Volatility Bands study combines the approach of both Bollinger Bands and Keltner Channel, with different settings and different visualization
Default settings are one standard deviations and one time average true range (ATR) above and below 13 period exponential moving average. Setting can be adjusted by users but let me remind all testes are performed with the default settings.
Mathematically expressed as
Upper band area between “ema + stdev” and “ema + atr”
Lower band area between “ema – stdev” and “ema – atr”
A different display is added with the inspiration I get from one of the @quantgym ‘s study, many thanks @quantgym 😉
When difference band display is selected the study will reflect the area between “ema + stdev – atr” and “ema – stdev + atr”. As shown in the examples above
Note: standard deviation calculation can be adjusted based on price action or its moving average.
Other differentiation between BB and KC is with V-BANDS mostly we look for trade opportunities when price action move out of the bands and in most cases we assume market is consolidating when the price action is within the bands
The other indicator that presents similarities to Volatility Bands is Squeeze Indicator, which measures the relationship between Bollinger Bands and Keltner's Channels to help identify consolidations and signal when prices are likely to break out. Mainly Volatility Bands is different version of Squeeze indicator, in fact the purpose is almost same but visualization is completely different. Additionally Volatility Bands Offers trading opportunities whereas Squeeze indicator only presents market states unless a momentum indicator is adapted to Squeeze indicator.
Disclaimer:
Trading success is all about following your trading strategy and the indicators should fit within your trading strategy, and not to be traded upon solely
The script is for informational and educational purposes only. Use of the script does not constitute professional and/or financial advice. You alone have the sole responsibility of evaluating the script output and risks associated with the use of the script. In exchange for using the script, you agree not to hold dgtrd TradingView user liable for any possible claim for damages arising from any decision you make based on use of the script

EMA Keltner Channel 1D100/200 EMAs, along with Keltner Bands based off them. Colors correspond to actions you should be ready to take in the area. Use to set macro mindset.
Uses the security function to display only the 1D values.
Red= Bad
Orange = Not as Bad, but still Bad.
Yellow = Warning, might also be Bad.
Purple = Dip a toe in.
Blue = Give it a shot but have a little caution.
Green = It's second mortgage time.
Double Donchian, Double Keltner, no-overlayThis is rather an educational script on how you can put multiple channels on the chart in a relatively non-confusing manner. Because it can be done doesn't mean you should do it (especially as a beginner). However, you might want to use maybe two.
Normally, TradingView would put them all over each other causing chart to lose readability. By a few clever conditions, higher timeframe KC does draw on the chart only if it is outside lower timeframe KC. Lower timeframe Donchian is 99,5% outside both Keltner Channels, and it will not show if it overlaps at any point. Higher TF Donchian ale two lines but no background.
Keltner channel 1 uses original settings
Keltner channel 2 uses TradingView default settings
Donchian 1 uses TradingView default
Donchian 2 uses 60 periods used by Turtles if I remember it correct
Have a great trade!

Keltner Channel AlertSimple Keltner Indicator with a custom alert.
The alert should ring when any Band has the price crossing.

Emke ChannelThis is a slightly modified Keltner Channel with 100/200 EMAs.
Based on mean reversion theory that price will be more and more difficult to maintain it's direction the farther it gets from the EMAs.
It uses the security feature to only show the 1D channel.

Elder-Keltner-Impulse-MA Study by STTAStudy Name: Elder-Keltner-Impulse-MA Study by STTA
English:
This indicator shows in a combined way three Keltner Channels with EMA21 and multiplier 1,3,5, the Elder Impulse System and a short EMA 11 to recognize the valuation zone, according to various strategies of Dr. Alexander Elder.
This indicator can be applied on all symbols.
Inputs: displayed symbol
Settings:
Elder Force Index (EFI)
-EIF MACD Length
-EIF MACD Slow Length
-EIF MACD Signal Length
-EIF EMA Length
EMA Short Length
Keltner Channels (KC)
-KC MA Length
-KC Multiplier1-3
-KC Source
-KC Type
-KC Bands Style
Outputs:
-EIF Bar Colors
-KC Upper1-3 channel upper and lower Lines
-MA Short

CBG Keltner ChannelsHere's an updated version of the CBG Keltner Channel indicator.
1. Added a new option for painting bars and backgrounds.
- Option 5 will paint up bars if the midline moving average is moving up and price is above the control moving average. It will paint down bars if the opposite is true. If neither are true, it will paint a neutral color. The neutral color defaults to gray bars and no color for backgrounds.
2. I've also added a 3rd band.
The chart here shows the default settings except for the inner band which is turned off.
mForex - Keltner channel + EMA Scalping systemTransaction setup parameters
Time frame: M5, M15
Currency pair: EUR / USD , GPB / USD
Transaction: London, USA
Number of orders / day: 10 - 15 orders
Trading strategies
=== BUY ===
Candles close on the upper Keltner
EMA10 crosses the upper Keltner range from below
Stop loss in the middle band or up to 12 pips
Profit target: 15-25 pips
=== SELL ===
Candles close below Keltner below
EMA10 crosses the Keltner range below from above
Stop loss in the middle band or up to 12 pips
Profit target: 15-25 pips

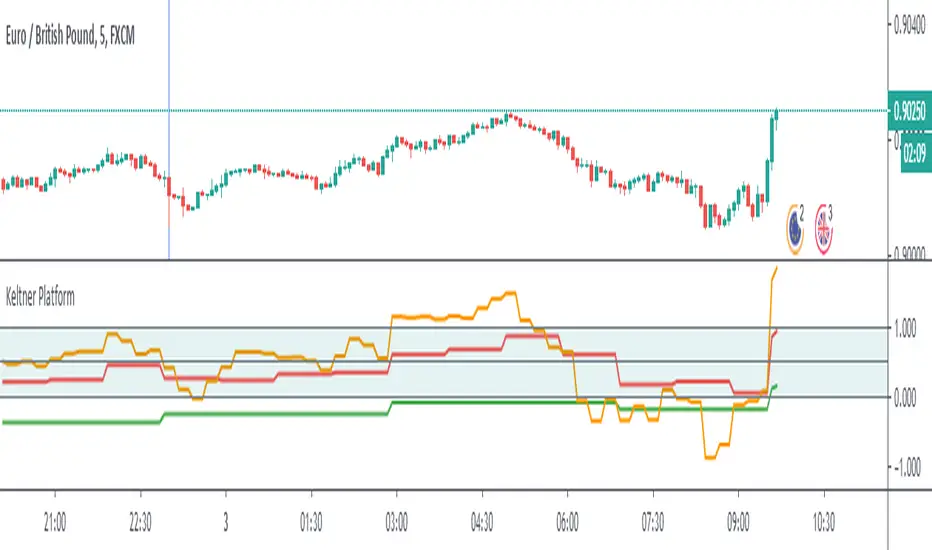
Keltner PlatformThis script gives you the information on Keltner Channels in three or four different timeframes. I usually like to put the information from high-timeframe charts on the lower ones to see the bigger picture without switching. Keltner Platform gives you the idea of how far the price is from its moving average in the true range units.
BLACK - daily
GREEN - 4h
RED - 1h
ORANGE - 15 m if the timeframe is below 1h
How to remember colours? Black is ground, green are plants growing on it, red is the flame, orange is lower temperature flame. This is how they should be settled when all timeframes are in an early uptrend.
You can use different MA types for calculation, simple is recommended (by me).
Have a great trade!
Elliott Wave Oscillator Signals by DGTElliott Wave Principle , developed by Ralph Nelson Elliott, proposes that the seemingly chaotic behaviour of the different financial markets isn’t actually chaotic. In fact the markets moves in predictable, repetitive cycles or waves and can be measured and forecast using Fibonacci numbers. These waves are a result of influence on investors from outside sources primarily the current psychology of the masses at that given time. Elliott wave predicts that the prices of the a traded currency pair will evolve in waves: five impulsive waves and three corrective waves. Impulsive waves give the main direction of the market expansion and the corrective waves are in the opposite direction (corrective wave occurrences and combination corrective wave occurrences are much higher comparing to impulsive waves)
The Elliott Wave Oscillator (EWO) helps identifying where you are in the 5-3 Elliott Waves, mainly the highest/lowest values of the oscillator might indicate a potential bullish/bearish Wave 3. Mathematically expressed, EWO is the difference between a 5-period and 35-period moving average based on the close. In this study instead 35-period, Fibonacci number 34 is implemented for the slow moving average and formula becomes ewo = ema(source, 5) - ema(source, 34)
The application of the Elliott Wave theory in real time trading gets difficult because the charts look messy. This study (EWO-S) simplifies the visualization of EWO and plots labels on probable reversals/corrections. The good part is that all plotting’s are performed on the top of the price chart including a histogram (optional and supported on higher timeframes). Additionally optional Keltner Channels Cloud added to help confirming the price actions.
What to look for:
Plotted labels can be used to follow the Elliott Wave occurrences and most importantly they can be considered as signals for possible trade setup opportunities. Elliott Wave Rules and Fibonacci Retracement/Extensions are suggested to confirm the patters provided by the EWO-S
Trading success is all about following your trading strategy and the indicators should fit within your trading strategy, and not to be traded upon solely
Disclaimer : The script is for informational and educational purposes only. Use of the script does not constitutes professional and/or financial advice. You alone the sole responsibility of evaluating the script output and risks associated with the use of the script. In exchange for using the script, you agree not to hold dgtrd TradingView user liable for any possible claim for damages arising from any decision you make based on use of the script

Squeeze Momentum Indicator [LazyBear] vX by DGTModified version of Squeeze Momentum Indicator visualizing on Price Chart
author: LazyBear, modified by KıvançÖZBİLGİÇ
Rainbow Gator - EMAs strategy for Binary OptionThis is an EMAs indicator for Binary Option or Scalping Alert designed for lower Time Frame Trend (2-5minutes).
Although you will find it a useful tool for higher time frames as well.
The Alerts are generated when the fast EMA cross over/under other slower EMAs, you then have the chance to wait for the pullback during the new trend then enter for trend momentum (follow the trend).
Beware when the trend is close to EMA200.
You must draw your SRT (Support-Resistance-Trendline) before looking for setups.
Good luck.
NSDT Triple KeltnerA different spin on Keltner Channels. Using 3 channels of varying widths provides a good visual for potential entries off of extremes. Normal channel is center, green and red "zones" could be used as potential entry/exit areas, and the outside yellow zones may be viewed as extremes (signifying potential breakouts or strong reversal areas).

(NKC) MTF Squeeze Pro MultiTimeframe Squeeze Momentum Pro
Dots indicate squeeze
Fills indicate momentum

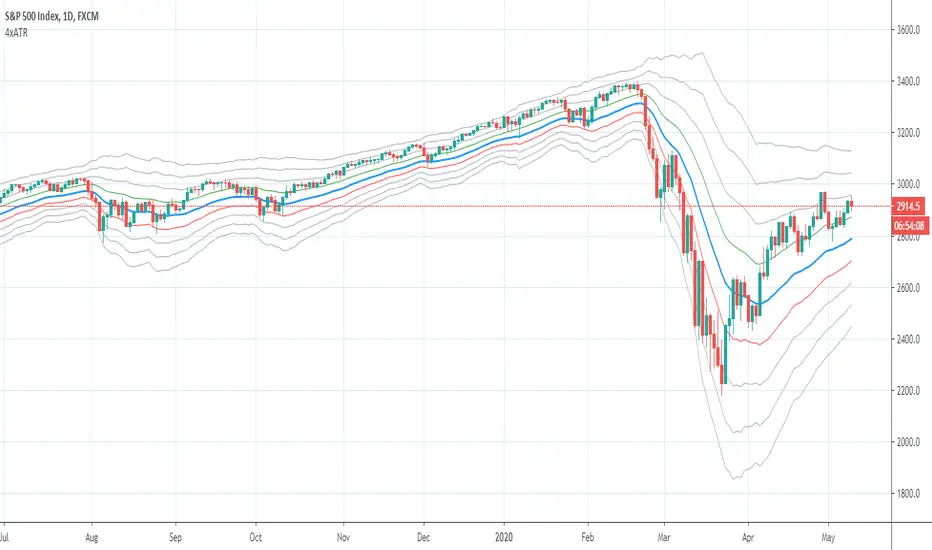
4x ATR of the Lows by CanUk101Plots 4 Keltner style channels above and below an EMA to allow overbought and oversold interpretation and assess volatility