Diversified Investment EMA Cross Strategy SimulatorThis simulating indicator proves that even if you use a simple strategy, you can reduce your risk by diversifying your investments.
The strategy itself is simple.(only long)
Buy when 50 days EMA crosses over 200 days EMA.
Sell when 50 days EMA crosses under 200 days EMA.
Or, stop loss when the asset falls by 2% (eg).
Using this simple strategy on an asset is just a test of your luck.
However, this capital change graph shows that risk can be reduced by diversifying investment into eight assets rather than one asset.
Options
Total Assets Capital Change represents the sum of capital changes for 8 assets. The gray line is the initial capital.
Each Asset Capital Change represents all eight asset capital changes. In this case, the gray line is displayed as the initial capital divided by 8.
The rest of the options show a graph of capital change for each asset, showing when buys and sells occurred.
And set the start date, initial capital, stop loss %, and commission.
And select the 8 assets you want to invest in and you are ready to go. To effectively reduce risk, uncoupled assets would be better if possible.
The table in the lower right shows the selected asset and color.
Please enjoy the simulation.
個人檔案管理

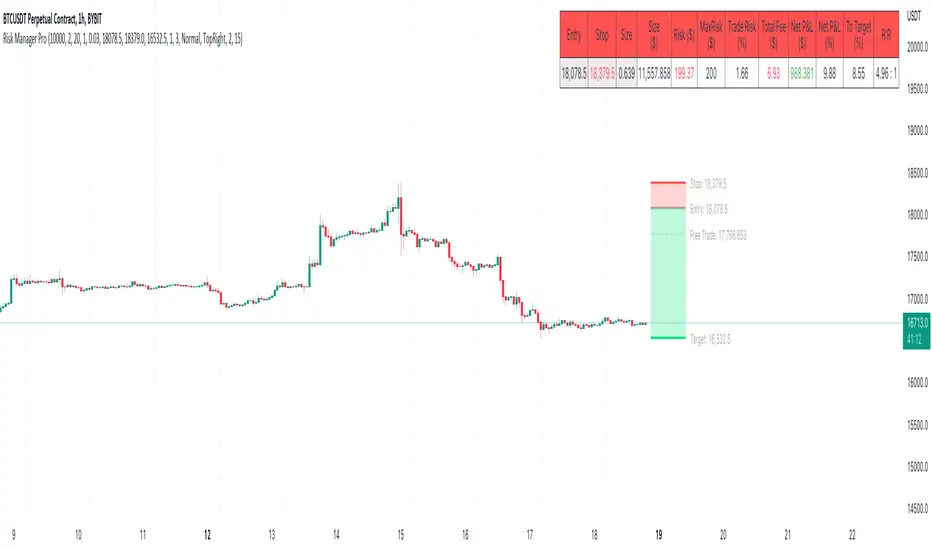
Risk Management & Position Size Dashboard ProThis version of the dashboard system factors in trading fees to your max risk to account per trade. This comes in handy when trading very low timeframes where trade risk can be tiny and leverage high where traditional position size calculations can yield huge position sizes where just the fees can far exceed your risk appetite. This system calculates your position size factoring in fees so you will never exceed your risk settings. Details below.
****
This indicator is designed to assist traders by instantly providing the necessary information to execute orders based on defined risk parameters. This is not an indicator that tells you WHEN to buy or sell, but HOW MUCH to buy or sell based on your risk appetite. The indicator is compatible with any strategy and any instrument
The indicator uses some great pinescript features, allowing you to drag and drop your levels directly on the chart for instant feedback from the risk management dashboard. Huge timesaver.
Instructions:
1. The first time you add the indicator to your chart, you will be asked to identify your Entry, Stop and Target levels by clicking on them directly on the chart. You can at any point adjust these levels directly on the chart, or you can manually enter them in settings
2. Setup your risk profile in the indicator settings:
(a) Current Capital: Enter the current value of your trading account
(b) Max Risk Per Trade: Enter the maximum % of your Capital you want to risk per trade
(c) Max Leverage: Enter the maximum leverage you want applied to your account. This comes in handy when you trade on very low timeframes where position sizes can become very large. No matter what you enter here, position size will never exceed Max Risk Per Trade
(d) Stop Ticks: Number of ticks to use above/below the identified high/low for stops
(e) % fee per trade: enter your brokers fees here to ensure the system takes this into consideration while calculating position size
(e) Use Current Price as Entry (Market Orders): By default, the system will use the entry level you have selected for limit orders. If you want to use the system to display data based on current price for market orders, select “Use Current Price as Entry (Market Orders)”
(f) number of TP levels: enter the number of TP levels you are planning to use to ensure the fees are calculated for them
3. Based on your stop and target levels, the system will automatically determine if you're looking to long or short and accordingly display all relevant data to you.
4. Display Free Trade Level: toggle this on to display the level you should exit 50% of your position to make the trade risk free
5. Dashboard / Text size / level colours and positions are customisable
The Dashboard displays the following information at all times:
1. Entry
2. Stop
3. Trade Risk (%): Percentage price difference between Entry and Stop
4. Max Risk ($): Currency value of loss if the trade is stopped out
5. Size: Position Size to execute your trade based on your risk profile/appetite
6. Size($): Position Size in currency value
7. Total Fees: Total fees for the trade based on settings above
7. P&L($): Potential profit to your Capital in currency value
8. P&L(%): Potential profit to your Capital in %
9. Risk to account: % risk to account - used as confirmation that the max risk to your account, factoring fees is circa your risk appetite
10. R:R: Risk to Reward Ratio
11. % to Target: Percent price needs to move to achieve your target
Hope this helps you with your trading. I built this as I was tired of wasting time opening up spreadsheets or calculators to execute trades - especially on lower timeframes. Making the code open source so if you do make improvements to this I'd love to hear from you. Also open to suggestions.
Happy Trading!
average price calculatorthe "average price calculator" is a tool that calculate the brake-even price when trading with multiple entries
how it works?
just copy the the entry price and size of position
and the average price or brake-even price will appear on the chart
if trading in both directions (buy and sell) at the same time
mark the sell position as negative (-)
hope you find this tool useful
successful trading to you all

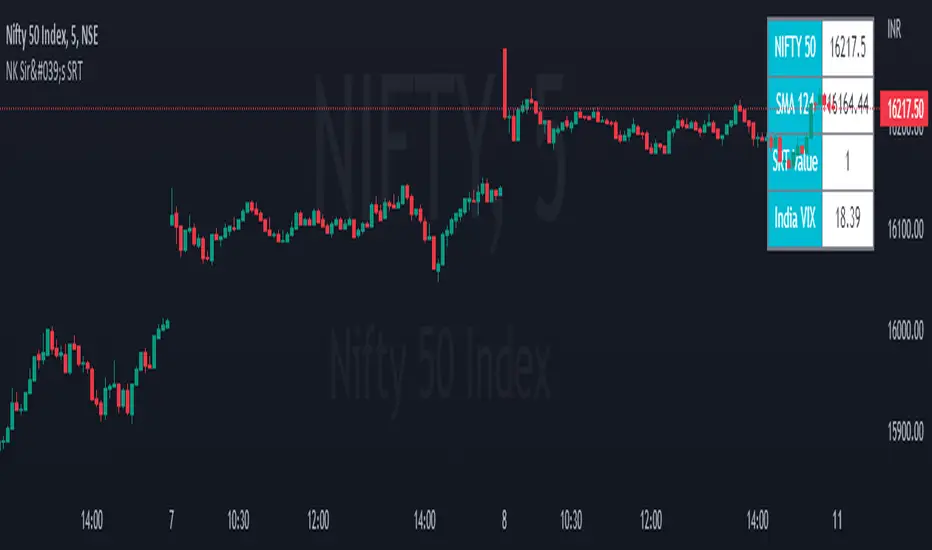
NK Sir's SRTFirst of all I would like to thanks Nitish Sir for teaching us the concept of SRT, which proves to be an excellent tool for Investing.
In a year, there are around 248 to 252 trading days .
On dividing the same by 2 we get 124. Even 125 / 126 can be taken.
We get SRT value by dividing Nifty Spot with 124 SMA value & SRT is applicable on Nifty in a Day Chart.
This value ranges in between 0.6 (Low) to 1.38/1.4/1.45/1.5 (High).
Ideal Entry in a stock will be at 0.6, which is very rare. You tend to buy at 0.7/0.8/0.9/1.10.
Exit from a stock will be at 1.3 - 1.5.
However generally we get a value of 0.8/0.9 and we should start investing 20 % of our capital that we have planned to invest. For every 0.1 decrease in SRT Value, we should add 20% to the stock portfolio.
Start Booking Profit if SRT value above 1.35 & book 50 % of the portfolio when SRT value is 1.45.
For Traders, as an when SRT value comes to 0.8/ 0.9. Buy when Hilega Milega gives us a clear BUY signal on Monthly Time Frame.
Stock bought at SRT value of 0.6 tend to double in a year. It generally quite rare to see a SRT Value of 0.6.
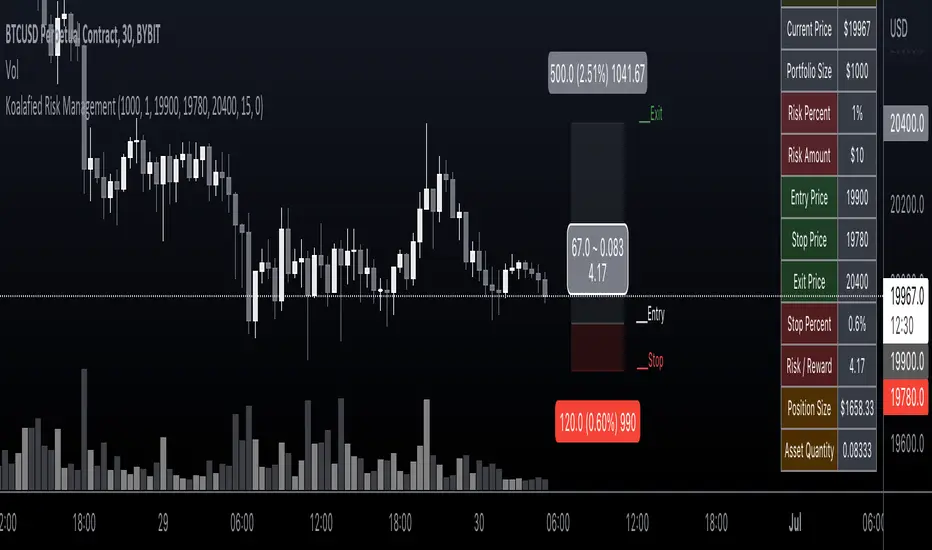
Koalafied Risk ManagementTables and labels/lines showing trade levels and risk/reward. Use to manage trade risk compared to portfolio size.
Initial design optimised for tickers denominated against USD.
Strategy Multiple Orders + Statistics Template - EducationalHello traders
It's been a while
We're back in a bear market so I have a bit more time to publish new Pine scripts for the TradingView community
Special thanks to @fikira for his Multiple Orders script () and to @carnagecain for allowing me to publish this script we worked together on
I got widely inspired by @fikira's script for that one
This script is for educational purposes only - I wanted to show how we can add multiple TPs/SL + a table with custom statistics
In this Strategy template, users can define multiple take-profit and multiple stop-loss levels.
Basically, we have 4 trades per trend and each trade has its own SL/TP
Statistics
Stats are split per trade direction (Long, Short) and then consolidated
I put custom stats in that table such as:
- Probability of Win
- Probability of Loss
- Avg Profit/Loss per Trade
- APPT: (Probability of Win * Average Gross Profit) - (Probability of Loss * Average Loss)
- Number of times each TP/SL has been hit
I'm catching up with all recent pinescript features as we speak - more educational scripts template to come soon
Best Regards
Dave

SMART4TRADER -ATR viewIndicator in the form of an information panel in the upper right corner
the indicator shows ATR (Daily, Weekly, Monthly) in percentage and points.
Calculates position size considering volatility and given risk
The indicator also takes into account the multipliers in the contract
_--------------------------
Индикатор в виде информационной панели в правом верхнем углу
индикатор показывает ATR (Daily, Weekly, Monthly) в процентах и пунктах.
Рассчитывает размер позиции с учетом волатильности и заданного риска
Так же индикатор учитывает множители в составе контракта

OmidCapitalCalWith this tool, traders are able to calculate position leverage based on risk percentage
// ------ Settings Inputs -----------------------------------------------------------------------------------------------------
// "Capital" -- enter your portfolio balance
// "Risk" -- enter the percent of your portfolio you are willing to lose if the stop loss is hit
// "Entry" -- enter the price at which you will enter the trade
// "Stop" -- enter the price at which your stop loss will be set
// "Target" -- enter the price at which your take profit will be set
// ----------------------------------------------------------------------------------------------------------------------------
// ------ Outputs -------------------------------------------------------------------------------------------------------------
// "Capital" -- displays the portfolio balance entered in settings
// "Risk" -- displays the % loss entered in settings and the corresponding amount of your portfolio
// "Entry" -- displays the entry price entered in settings
// "Stop" -- displays the stop loss price entered in settings
// "Stop %" -- displays the calculated percentage loss from the entry price
// "Target" -- displays the take profit price entered in settings
// "Target %" -- displays the calculated percentage profit from the entry price
// "Leverage" -- displays the calculated leverage based on your max loss and stop loss settings

unrealized pnl for btcusdt (or any linear perp)haven't seen this published, so i made it to watch my position while looking at my TV chart
right now, code works for just linear contracts (base currency margined, not quote currency) and i will have to add the code for inverse perps soon in the next update
very simple tool... not much to explain
just enter
long or short
average entry
position size (designed for btc since i'm a maxi, but entering the amount of any base currency should work)
take profit
then you'll get candles for your position and a line for your TP (and its amount)
next version will add a feature to plot inverse perps
(sorry TV if this doesn't abide by the House Rules exactly)

My_PortfolioDisplays all time high/low/mean prices and average cost with lines; and the price changes relative to the average cost in percentages.
This does not calculate average cost. This is just a fast way of viewing the current situation of one's portfolio.
Parities invested in and average costs for them have to be manually entered in the settings or by editing the script.
Should work with all parities.

crypto Position Size CalculatorCrypto Position Size Calculator
this indicator helps you to figure out the position size your trade . and its only used for crypto
the indicator needs to fill the input section in order to give you the information table that includes position size .
The input section consists two section the first section you will give the trade info like entry , stop loss and take profit .
then the next section its about your account balance and risk per trade . then you can get your position size .
you can have also option where you can display your table like bottom right , bottom left or top right its your choice.
special thanks : Ahmed busury
special thanks : Aj group family

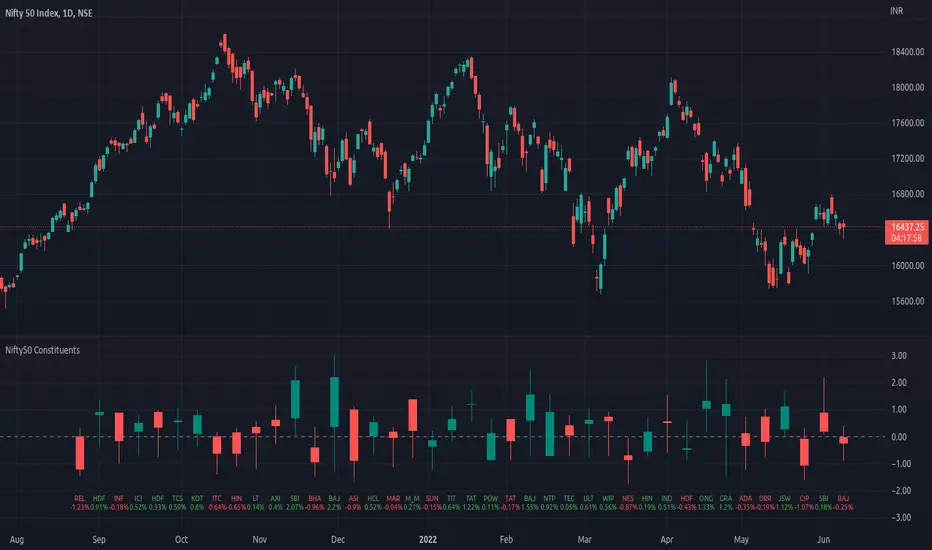
Top 40 constituents of Nifty50Displays real-time candles of top 40 constituents of Nifty50 for a given time frame, side-by-side. This gives an overall idea of breadth and depth of market movements in the time-frame.
Please note that, this is not a standard chart rendered bar-wise and may take time to load as it requests multiple securities. You could modify the contents, from settings, to include stocks from your portfolio or indices of different sectors.
NSE:NIFTY
Relevant World GDP GroupedLooking at a basket of countries total GDP for comparing size of economy. Makes it easy to select your own groupings of countries for comparison. A country's GDP is the total of consumer spending (C) plus business investment (I) and government spending (G), plus net exports, which is total exports minus total imports (X – M). Alliances visualized was the original idea but wasn't quite sure for a lot of other countries where they stand so it is what it is; feel free to improve.

US/CA Bond Yield CurveEasy Viewing of 4 different duration bond yields for US and Canada. Bond prices and bond yields are excellent indicators of the economy as a whole, and of inflation in particular. A bond's yield is the discount rate that can be used to make the present value of all of the bond's cash flows equal to its price. Good as part of a macro set.

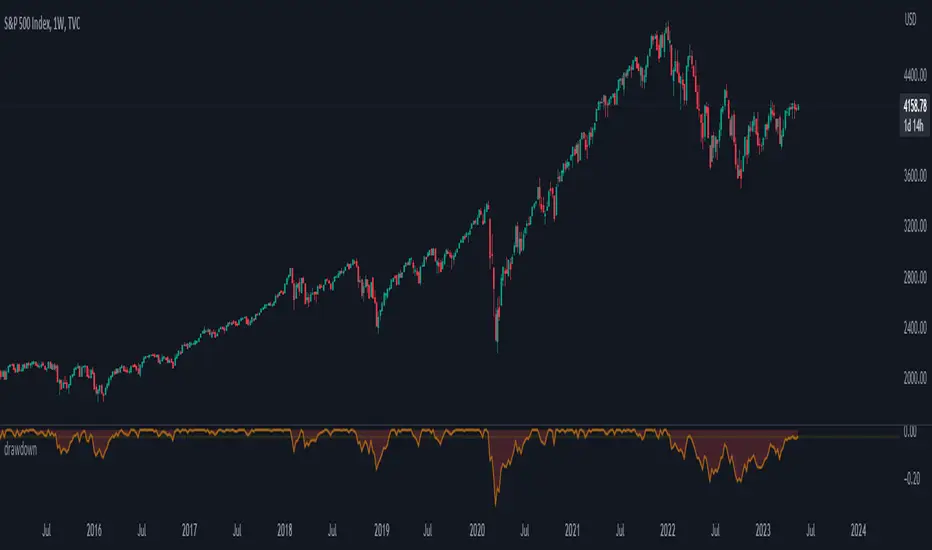
trailing_drawdown
Description:
Drawdown was a tool to measure historical risk, derived from measuring current wealth from its previous peak, casually from portfolio construction (weights allocation), will consider to having a minimum drawdown. In this indicator, the drawdown for individual assets is utilized to measure its value or percentage from its trailing peak (default to 1-yr period).
Drawdown:
drawdown = (price/peaks)-1
Feature:
Static: display drawdown as percentage
Dynamic: display drawdown as value
Asia Reversal ZoneThis indicator shows the most likely time Asia session reverses it direction.
Designed for US30 scalps 30-100 points.
Focus on price and time that is key.
Remove Plot line.
Also check out "Deluxo Kill zones" my other indicator.
-Enjoy
