Pine Script®指標
在腳本中搜尋"bot"
Linear Regression BotHello Fellow Traders!
-------------------------------------------
This is the newest addition to Gnome Alerts PRO!
This is a new trading method designed to take advantage of Linear Regression methods along with using price blocks to make smarter trades.
PineScript v4 allows us to get more creative from an indicator perspective and really make some neat stuff.
This Bot Script works on all Crypto, Leverage, Forex, & Traditional Exchanges.
FEATURES
------------------------
*Goat Alerts & Autoview Ready*
- Easy to Use
- DCA
- Avg Position Tracking
-Take Profit
- Stop Loss
You can get access to any of my scripts by visiting my Website, all links are down below....
Pine Script®指標

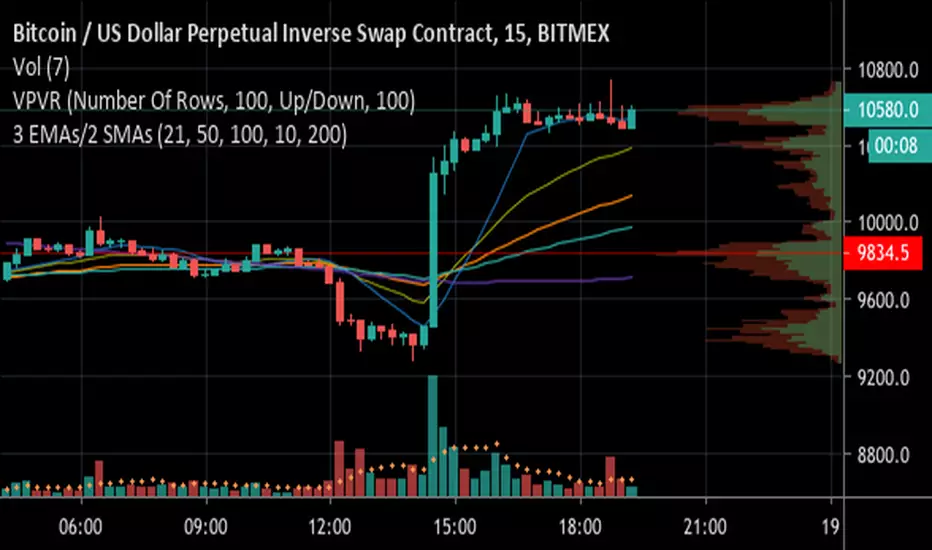
3 EMAs with Crossing Alerts & 2 SMAsHi all,
This is a simple indicator that plots 3 EMA lines and 2MAs of your choice to the screen and has built in alert triggers.
Features:
1) Alerts are triggered when EMAs 1 (Signal line) and 2 (Baseline) cross - a Long signal is called if the cross is above EMA 3 ( Trendline ), a short if the cross is below EMA3
2) Signals are represented visually as a triangle on the chart, below the candles is a long, above is a short
3) TradingView Alerts can be easily set as I have labelled the signals clearly as many other Indicators like this aren’t easy to work out if trying to create alerts to trigger a 3commas bot, for example!
Each EMA is fully customisable and if you wish to take advantage of the alerts, only a few simple rules need to be followed:
EMA1 needs to be less than EMA2.
EMA2 needs to be the same or greater than EMA3
That’s it, happy trading!
Pine Script®指標
Quad Moving Avgerages BackTestHello Fellow Traders!
-------------------------------------------
This is the newest addition to Gnome Alerts PRO!
Trade Moving Average Breakouts with Minimal Drawdon.
This Bot Script works on all Crypto, Leverage, Forex, & Traditional Exchanges.
FEATURES
------------------------
*Autoview Ready*
- Easy to Use
- Backtesting Included
-Take Profit
- Stop Loss
You can get access to any of my scripts by visiting my Website, link is in Tradingview Bio ... Just click on the Gnome!
Pine Script®策略

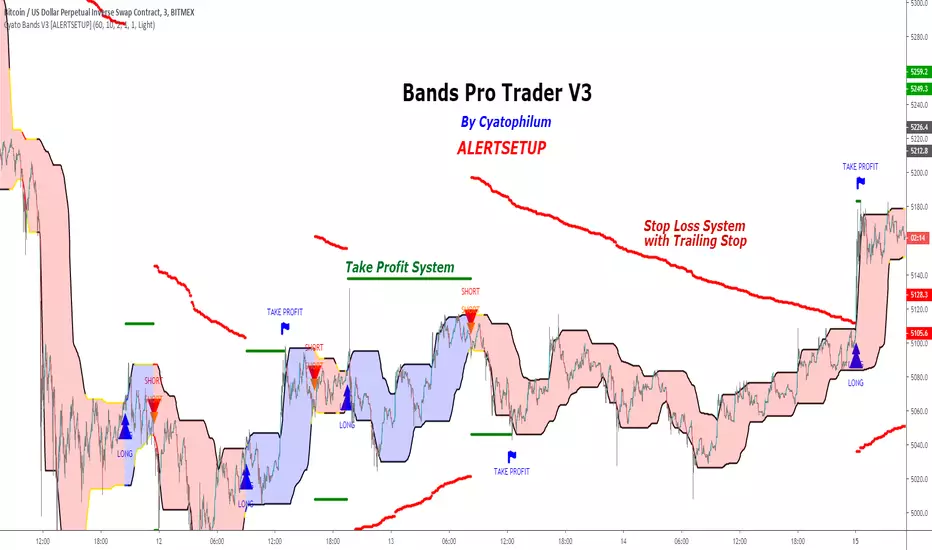
Cyatophilum Bands Pro Trader V3 [ALERTSETUP]An Original Automated Strategy that can be used for Manual or Bot Trading, on any timeframe and market.
>> Presentation <<
This script comes with a Backtest Version
How it works
No, these are NOT Bollinger Bands..
The Cyatophilum Bands are an original formula that I created. You will probably never find it anywhere else.
Their behavior is the following:
When they are horizontal it means the trend is going sideways and they represent supports (lower band) and resistances (upper band).
When they are climbing or falling it means the trend is either bullish or bearish and they represent Trend Lines.
The strategy enters Long on a Bull Breakout and enters Short on a Bear Breakout.
The exits are triggered either on a Trend Reversal, a Stop Loss or a Take Profit.
FEATURES
Take Profit System
Stop Loss System
Show Net profit Line
More features here
Finding a profitable configuration is GUARANTEED
0. Choose your symbol and timeframe. Then add the Backtest version to your chart. If at any time you decide to change your timeframe, go back to step 1.
1. Open the strategy tester and look at the buy & hold line.
If it is mostly climbing (last value greater than 0) then it means we are in a bull market. You should then opt or a long only strategy.
If it is mostly dropping (last value lower than 0) then it means we are in a bear market. You should then opt or a short only strategy.
Note : This first step is really important. Trading against the market has very little chances to succeed.
2. Go into the Strategy Input Parameters:
check "Enable Long Results" and uncheck "Enable Short Results" if you are in a long only strategy.
check "Enable Short Results" and uncheck "Enable Long Results" if you are in a short only strategy.
3. Open the Strategy Tester and open the Strategy Properties.
We are going to find the base parameters for the Bands.
The "Bands Lookback" is the main parameter to configure for any strategy. It corresponds to how strong of a support and resistance the bands will behave. The lower the timeframe, the higher lookback you will need. It can move from 10 to 60. For example 60 is a good value for a 3 minute timeframe. Try different values, and look at the "net profit" value in the Overview tab of the Strategy Tester. Keep the Lookback value that shows the best net profit value.
Then play with the "Bands Smoothing" from 2 to 20 and keep the best net profit value.
The "Band Smoothing" is used to reduce noise.
Usually, the default value (10) is what gives the best results.
From this point you should already be able to have a profitable strategy (net profit>0), but we can improve it using the Stop Loss and the Take Profit feature.
4. To activate the Stop Loss feature, click on the "SECURITY" checkbox
You should see horizontal red lines appear.
A Long/short exit alert will be triggered if the price were to cross this line. (A red Xcross will appear)
Choose the Stop Loss percentage.
On top of that, you can enable the feature "Trailing Stop". It will make the red line follow the price, at a speed that you can configure with the "Trailing Speed" parameter.
Now, sometimes a stop is triggered and it was just a fakeout. You can enable "Re-entries after a stop" to avoid missing additional opportunities.
5. To activate the Take Profit feature, click on the "TAKE PROFIT" checkbox
You should see horizontal green lines appear.
A Long/short exit alert will be triggered if the price were to cross this line. (A flag will appear)
Choose the Take Profit percentage.
A low takeprofit will provide a safer strategy but can reduce potential profits.
A higher takeprofit will increase risk but can provide higher potential profits.
6. Money Management
You can configure the backtest according to your own money management.
Let's say you have 10 000 $ as initial capital and want to trade only 5%, set the Order Size to 5% of Equity.
You can increase net profit by increasing the order size but this is at your own risk.
How to create alerts explained here
Sample Uses Cases
Use it literally anywhere
This indicator can be used on any timeframe and market (not only cryptocurrencies).
About the Backtest below
The Net Profit (Gross profit - Gross loss) is calculated with a commission of 0.05% on each order.
No leverage used. This is a long strategy.
Each trade is made with 10 % of equity from an inital capital of 10 000$. The net profit can be bigger by increasing the % of equity but this a trader's rule to minimise the risk.
I am selling access to all my indicators on my website : blockchainfiesta.com
To get a 2 days free trial, just leave a comment , thanks !
Join my Discord for help, configurations, requests, etc. discord.gg
Pine Script®指標
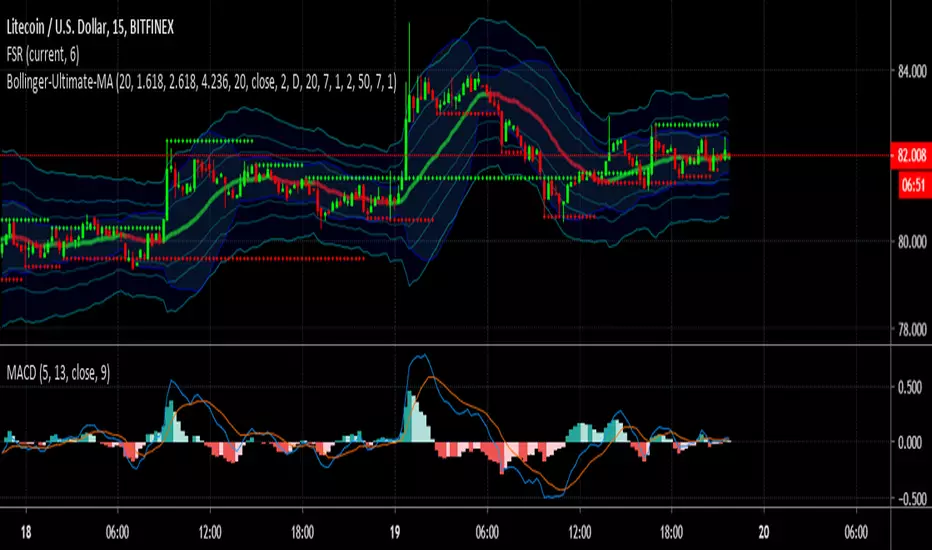
Bollinger-Ultimate-MAThis script combine Bollinger Band , Fibonacci and CM_Ultimate_MA_MTF_V2
To integrate with Trading Bot ;
Add alert, in the first drop down, either "Buy Condition" or "Sell Condition", and then your frequency and so on.
Pine Script®指標
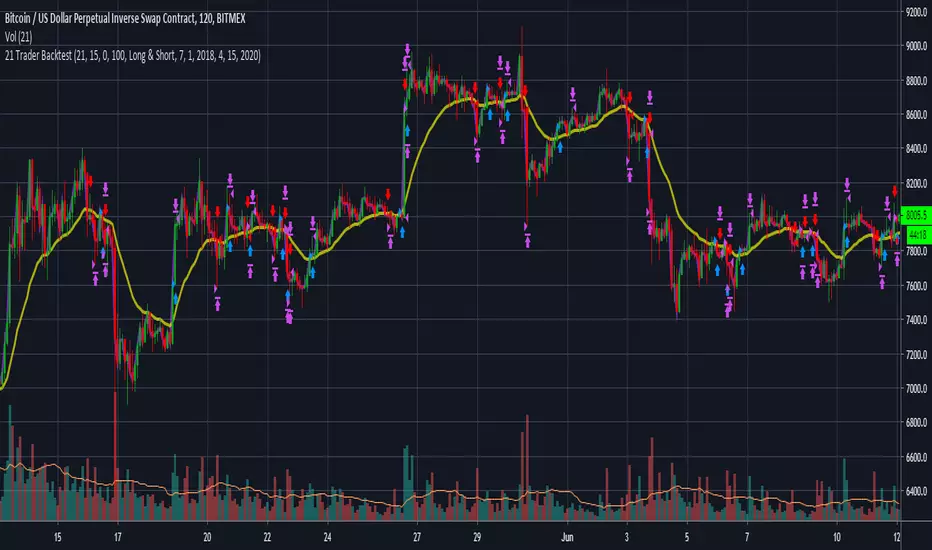
21 Trader BacktestHello Fellow Traders!
-------------------------------------------
This is the newest addition to Gnome Alerts PRO!
Trade Moving Average Breakouts with Minimal Drawdon.
This Bot Script works on all Crypto, Leverage, Forex, & Traditional Exchanges.
FEATURES
------------------------
*Autoview Ready*
- Easy to Use
- Backtesting Included
-Take Profit
- Stop Loss
Pine Script®策略
Dragon-Bot - Default ScriptDragon-Script is a framework to make it as easy as possible to test your own strategies and set alerts for external execution bots. This is the alerts version of the script.
The script has many features build in, like:
1) A ping/pong mechanism between longs and shorts
2) A stop-loss
3) Trailing Stops with several ways to calculate them.
4) 2 different ways to flip from long to short.
The script is divided into several parts.
The first part of the script is used to set all the variables. You should normally never change the first part except for the comments at the top.
The second part of the script is the part where you initialise all your indicators. Several indicators can be found on Tradingview and on other sites. Please keep in mind that all the variable names used in the indicator should be unique. (all the … = … parts)
The third part of the script, is the most important part of the script. Here you can create the entry and exit points.
Let’s look at the OPENLONG function to explain this part: The first variables are all the possible entries; These are longentry1 till longentry5. You can add many more if you like.
The variables are all initialised as being false. This way the script can set a value to true if an entry happens.
The if function is the actual logic: You could say “if this is true” then (the line below the if function) longentry1 := (becomes) true.
In this case we have said: “if this is true” then (the line below the if function) longentry1 := (becomes) true when the current close is larger than the close that is 1 back.
The last part is the makelong_funct. This part says that if any of the entries are true, the whole function is true.
The last part of the script is the actual execution. Here the alerts are plotted and the back test strategies are opened and closed.
We hope you guys like it and all feedback is welcome!
Pine Script®指標

Dragon Bot - Default ScriptDragon Script is a framework to make it as easy as possible to test your own strategies and set alerts for external execution bots.
The script has many features build in, like:
1) A ping/pong mechanism between longs and shorts
2) A stop-loss
3) Trailing Stops with several ways to calculate them.
4) 2 different ways to flip from long to short.
The script is divided into several parts.
The first part of the script is used to set all the variables. You should normally never change the first part except for the comments at the top.
The second part of the script is the part where you initialise all your indicators. Several indicators can be found on Tradingview and on other sites. Please keep in mind that all the variable names used in the indicator should be unique. (all the … = … parts)
The third part of the script, is the most important part of the script. Here you can create the entry and exit points.
Let’s look at the OPENLONG function to explain this part: The first variables are all the possible entries; These are longentry1 till longentry5. You can add many more if you like.
The variables are all initialised as being false. This way the script can set a value to true if an entry happens.
The if function is the actual logic: You could say “if this is true” then (the line below the if function) longentry1 := (becomes) true.
In this case we have said: “if this is true” then (the line below the if function) longentry1 := (becomes) true when the current close is larger than the close that is 1 back.
The last part is the makelong_funct. This part says that if any of the entries are true, the whole function is true.
The last part of the script is the actual execution. Here the alerts are plotted and the back test strategies are opened and closed.
We hope you guys like it and all feedback is welcome!
Pine Script®策略

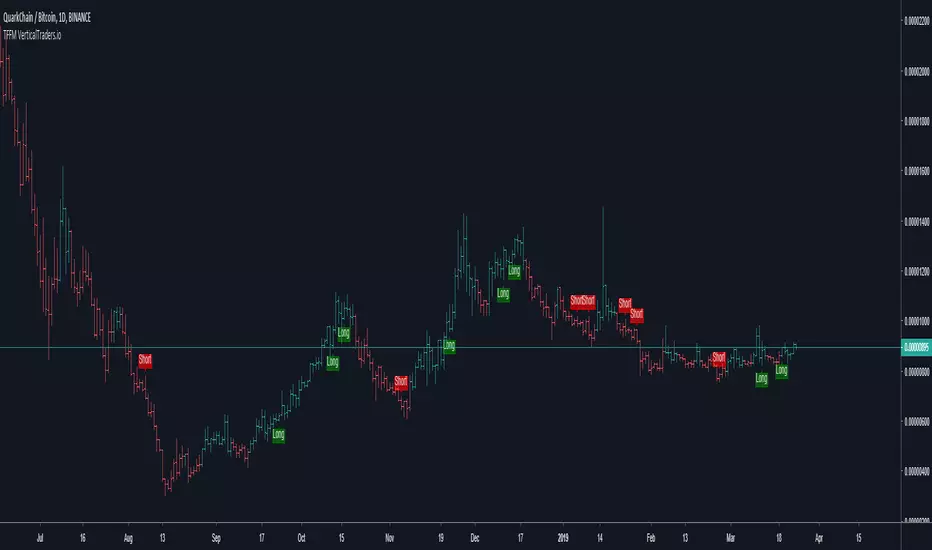
TFFM-This algorithm takes in consideration Media averages, Volatility Movements, trend direction and other Mathematical Properties.
-After adding this signal on TradingView, you will get notified every of potential long and short points triggered by the indicator.
-This signal alerts you anytime bars form a bullish or bearish pattern and price start to move in the suggested direction.
-It works in any time frame or market like Forex, Crypto, Commodities even Stocks.
-Recommended for bots or manual trading.
Do you need an Script or an expert adviser for Forex, contact our coding service:
Get this indicator today! contact us
Pine Script®指標
Entry Bars -This algorithm takes in consideration Media averages, Volatility Movements and other Mathematical Properties.
-After adding this signal on TradingView, you will get notified every of potential long and short points triggered by the indicator.
-This signal alerts you anytime bars form a bullish or bearish pattern and price start to move in the suggested direction.
-It works in any time frame or market like Forex, Crypto, Commodities even Stocks.
-Recommended for bots or manual trading.
Do you need an Script or an expert adviser for Forex, contact our coding service
Get this indicator today! contact us
Pine Script®指標

Premium 2-This algorithm takes in consideration Media averages, Volatility Movements, trend direction and other Mathematical Properties.
-After adding this signal on TradingView, you will get notified every of potential long and short points triggered by the indicator.
-This signal alerts you anytime bars form a bullish or bearish pattern and price start to move in the suggested direction.
-It works in any time frame or market like Forex, Crypto, Commodities even Stocks.
-Recommended for bots or manual trading.
Do you need an Script or an expert adviser for Forex, contact our coding service: coding@verticaltraders.io
Get this indicator today! contact us
Pine Script®指標

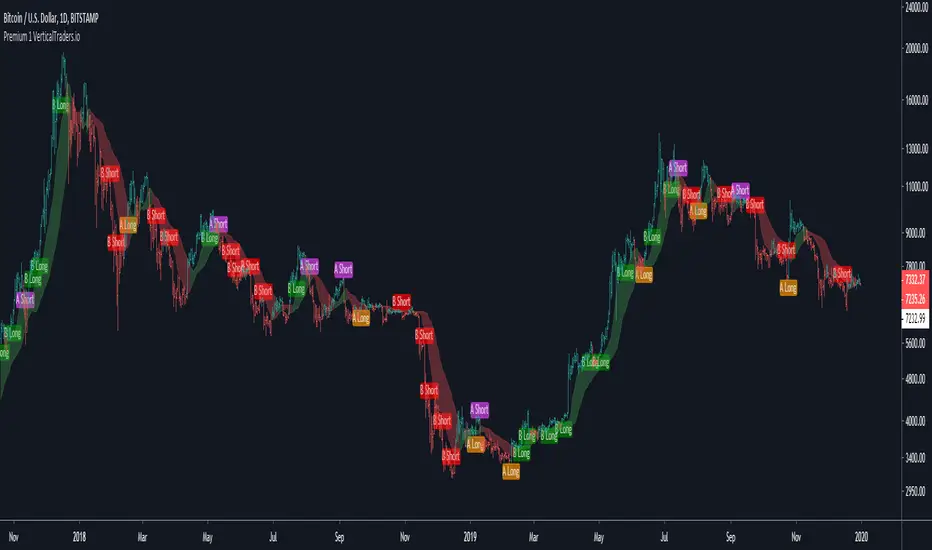
Premium 1-This algorithm takes in consideration Media averages, Volatility Movements and other Mathematical Properties.
-After adding this signal on TradingView, you will get notified every of potential long and short points triggered by the indicator.
-This signal alerts you anytime bars form a bullish or bearish pattern and price start to move in the suggested direction.
-It works in any time frame or market like Forex, Crypto, Commodities even Stocks.
-Recommended for bots or manual trading.
Do you need an Script or an expert adviser for Forex, contact our coding service:
Get this indicator today! contact us
Pine Script®指標
Bitmex HunterBitmex Liquidation Hunter advise you with all the liquidation level from 100x 50x and 25x
so you can be a head of Bitmex market and trade each liquidation Bounce and take your profits
you will see how Bitmex bot and Bitmex Price its all the time moving from one liquidation level to the next
liquidation level hunting all the greedy and retail traders that FOMO in !!
Pine Script®指標

Pivot Point Bot BacktestHello Fellow Traders!
-------------------------------------------
This is the newest addition to Gnome Alerts PRO!
This Bot Script written for leverage Crypto exchanges like BITMEX & Deribit but also works with Forex.
FEATURES
------------------------
*Autoview Ready*
- Easy to Use
- Backtesting Included
- Stop Loss
More info on how gain access in my profile!
Pine Script®策略

Pivot Point BotHello Fellow Traders!
-------------------------------------------
This is the newest addition to Gnome Alerts PRO!
This Bot Script written for leverage Crypto exchanges like BITMEX & Deribit but also works with Forex.
FEATURES
------------------------
*Autoview Ready*
- Easy to Use
- Backtesting Included
- Stop Loss
More info on how gain access in my profile!
Pine Script®指標

Cyatophilum Crypto Trader 1H [ALERTSETUP]A strategy specificaly engineered for trading altcoins.
Crypto pairs configurations already available: ADA/BTC, BNB/BTC, EOS/BTC, ETH/BTC, ICX/BTC, NEO/BTC, TRX/BTC, XLM/BTC, XMR/BTC, XRP/BTC.
This version allows to create automated alerts for buy and sell signals that can be used for manual or bot trading.
Note: You can use the backtest version for finding the best configuration for your pair if it isn't in the list. I will also be there to help you.
How it Works
The strategy is based upon two Exponential Moving Averages, it captures trend reversals, fakeouts, has a stop loss option and more (see the presentation page for input parameters description).
It should be used in 1 Hour timeframe and on any pair of cryptocurrency.
Backtest
The Net Profit (Gross profit - Gross loss) is calculated with a commission of 0.05% on each order.
Each trade is made with 100 % of equity
Get the indicator today!
Purchase on my website : blockchainfiesta.com
Pine Script®指標

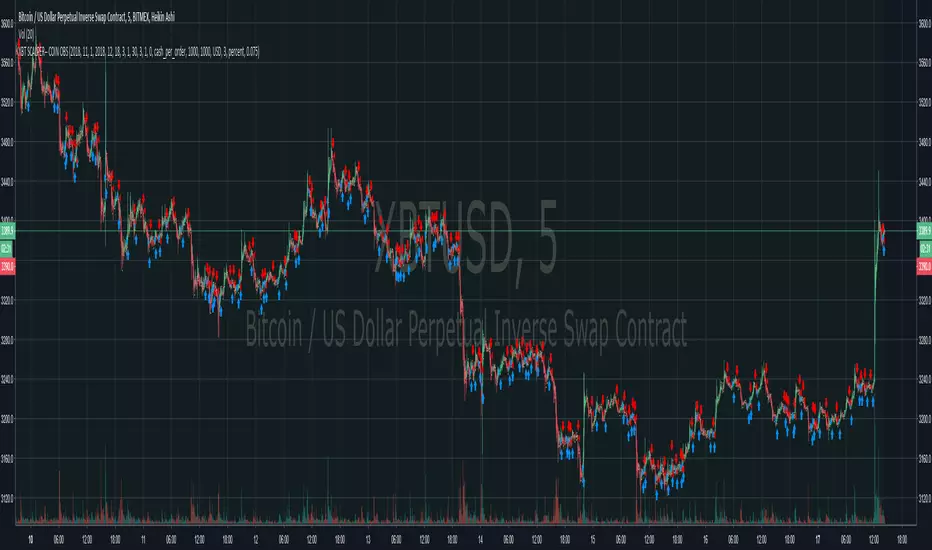
XBT swing-SCALPER-- with alerts-- COIN OBSFor backtested strategy:
This is the same strategy, with alerts for bots.
strategy takes much into consideration,
swings, rsi, mfi, with some safety nets.
For actual use, send me a DM.
Pine Script®指標

BITCOIN DOMINATOR-- BOT-- Bitmex Ready!ladies and gentlemen,
We cracked the XBT code.
For more information, visit the website in my bio.
Moon Bound! god speed!
Pine Script®策略
[Alerts]QQE Cross v6.0 by JustUncleLDescription:
This is a major upgrade of my original QQE indicator Tool, this version is directed at Forex and Crypto Margin trading. This version can also be used with AutoView/ProfitView Chrome add-on in a semi-automatic (turn on only when conditions are favorable) or automatic way, with Signal to Signal or Signal to Close trading.
This is a Trend following indicator that uses fast QQE crosses to capture swings in direction of the main Trend. Alerts are filtered with Two Moving Average Ribbons and/or Direction of MAs. The QQE or Qualitative Quantitative Estimation is based on the relative strength index (RSI), but uses a smoothing technique as an additional transformation. Three crosses can be selected (all selected by default):
Smooth RSI signal crossing ZERO (XZ)
Smooth RSI signal crossing Fast QQE line (XQ), this is like an early warning swing signal.
Smooth RSI signal exiting the RSI Threshhold Channel (XC), this is like a confirmed swing signal. An optimal Smooth RSI threshold level is between 5% and 10% (default=10), it helps reduce the false swings.
These signals can be selected to Open Short/Long and/or Close a trade, default is XC open trade and XQ (or opposite open) to Close trade.
The (LONG/SHORT) alerts can be optionally filtered by the Moving Average Ribbons:
For LONG alert the Close must be above the fast MA Ribbon and fast MA Ribbon must be above the slow MA Ribbon.
For SHORT alert the Close must be below the fast MA Ribbon and fast MA Ribbon must be below the slow MA Ribbon.
and/or directional filter:
For LONG alert the Close must be above the medium MA and the directional of both MA ribbons must be Bullish.
For SELL alert the Close must be below the medium MA and the directional of both MA ribbons must be Bearish.
This indicator is designed to be used as a Signal to Signal trading BOT in automatic or semi-automatic way (start and stop when conditions are suitable).
For LONG and SHORT alerts I recommend you use "Once per Bar" alarm option
For CLOSE alerts I recommend you use "Once per Bar Close" alarm option
(* The script has been designed so that long/short signals come at start of candles *)
(* and close signals come at the end of candles *)
Pine Script®指標

My AlgoTraderFirst, please find it in your heart to donate to my broke college student fund. I am in the final stages of making an algorithmic trading bot in Python, which hooks up to this particular exchange, but I do not have the disposable income to really test it out, so any donation helps. Comment below to let me know you donated so others can see your support!
Please send BTC Donations to: 13ZJ3xTLgJ6hNrv7e5eyEqhabxivYnuu8p
Please send LTC Donations to: LYeFrR9faLaAxJdB1anqVu3mCNxADZDHND
Anyway, on the the program.
I made an algorithmic trader which uses a set of self made indicators. This algorithm was written in pine version 3 and does not calculate_on_tick , therefore it does not repaint . The numbers you see are, to the best of my understanding, accurate.
Because I was concerned about overfitting, I created this algorithm with the intention of being generalizable to many different trading pairs. This program is generalizable to most trading pairs -- both crypto and normal stocks. This algorithm works best on shorter time frames for crypto markets, and longer timeframes for the conventional stock market.
Please let me know what you think and what I could do better!
Pine Script®策略
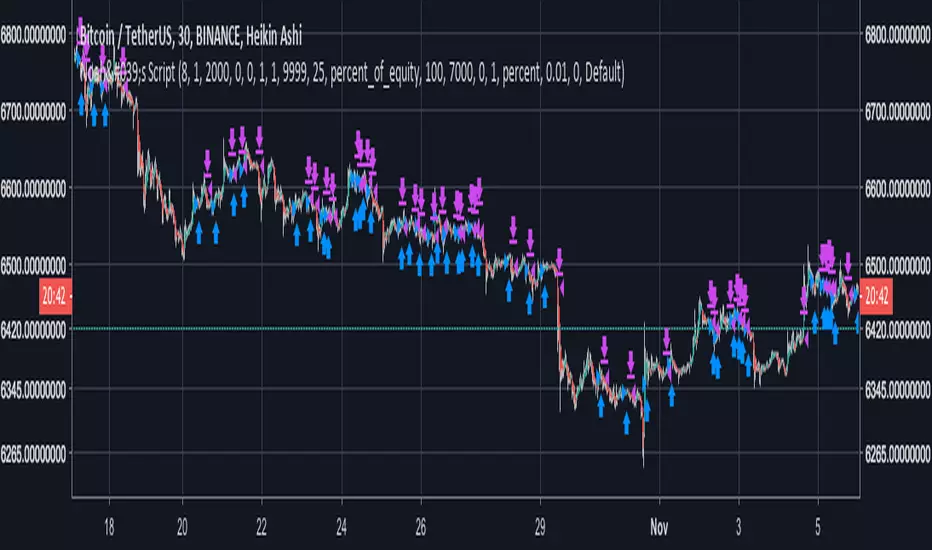
Loop mediaThis bot should be used to enhaned trading of beginner-intermediate traders and not elliminate human analysis.
Please use it wisely.
Use Heikin Ashi and 4H candles and you are good to go
Pine Script®策略

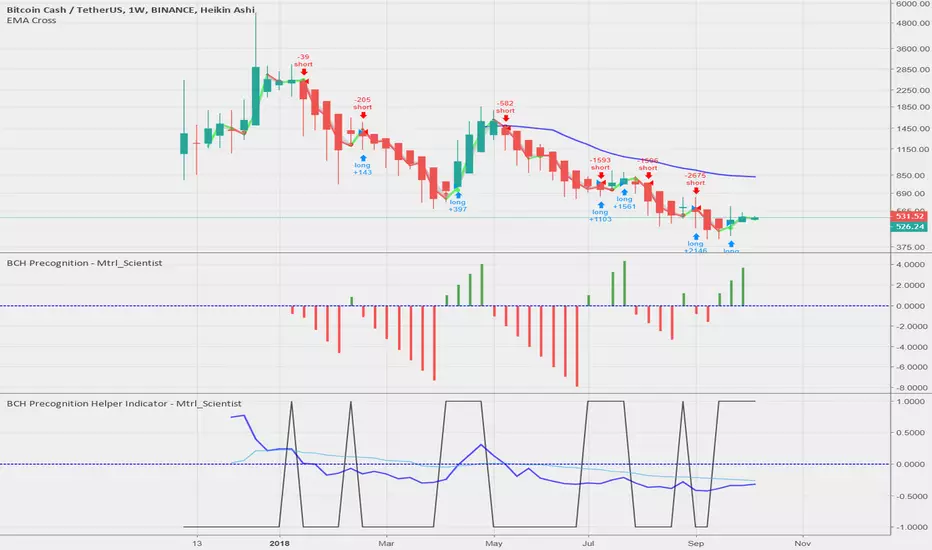
BCH Precognition - Mtrl_ScientistHello everyone,
Following up on my first bot, I've tuned my algorithm to work with Bitcoin Cash. In order to get rid of these nasty (and sometimes costly) indecision points, I've just enabled the 'Recalculated After Order Fill' option, which... well, recalculates the algorithm on the spot (instead of waiting for 1 additional bar) for situations where a signal is immediately followed by a conflicting signal, effectively cancelling it out. Obviously you have to rely on your own judgement if that happens in a real world scenario. However, in this simulated environment, this change resulted in a 0% risk, whereas the gain exceeded 800% with an initial capital of $100'000.
Again, in order for the results to be as accurate as possible, I've averaged the date from all major exchanges.
All of this is free to use for you, and you are welcome to share it.
If you like it, please give me a follow on Trading View & Twitter.
If you have any requests or suggestions/concerns, please let me know!
Note:
- This algorithm works best for Heikn Ashi candles, but I'm working on improving it for normal candles
- This is not financial advice (I'm in chemistry, not finance), so do your own research
Mtrl_Scientist
Pine Script®策略