Nick2k Trend Tracker MT botNick2k Trend Tracker MT bot
Type: Indicator (signals + PineConnector alerts for EAs)
Markets: Designed for XAUUSD (gold), adaptable to other symbols
Timeframes: Optimized for M5/M15
---
What it does
Nick2k Trend Tracker MT bot identifies trend flips using a percentile-normalized SMA slope with hysteresis, then applies a multi-layer filter suite to avoid false signals in low-quality conditions.
It can optionally auto-manage trades via PineConnector:
Send open orders with SL/TP (ATR- or pip-based)
Breakeven activation
Dual trailing stops (pip-based or ATR-based)
Staged partial closes (up to 3 levels)
The indicator also:
Highlights chop zones in the background
Provides diagnostic labels showing which filters passed/failed
Lets you disable all alerts with one checkbox (visual testing mode)
---
Core logic (simplified)
Trend Engine: SMA slope normalized by a rolling percentile; flips with hysteresis at +0.1/–0.1.
Filters: optional checks for slope strength, ADX, narrow range ratio, ATR squeeze, higher-timeframe slope.
Sessions: entry/management can be gated to London, NY, Tokyo, Sydney sessions and weekdays.
Chop highlight: background shading when ranges/low-volatility are detected for consecutive bars.
---
Visuals
Colored SMA line (gradient by slope)
BUY/SELL labels at valid flip bars
Chop background (yellow overlay)
Filter score/diagnostic label (optional)
---
Alerts & PineConnector integration
Open orders: sent at valid BUY/SELL flips with embedded SL/TP + BE/trailing if enabled
Partial closes: 3 configurable milestones (ATR or pip based, % or fixed lots)
Master toggle: switch all alerts ON/OFF instantly
Alerts are formatted in PineConnector EA syntax for compatibility with MetaTrader auto-trading.
---
Inputs (organized by group)
SMA & Theme (length, colors)
Auto Trading (license, symbol, lots, master toggle)
SL/TP Target Type (prices vs pips)
ATR SL/TP (length, multipliers, rounding)
Breakeven (trigger/offset)
Pip Trailing (trigger/dist/step)
ATR Trailing (TF, period, multiplier, trigger)
Partial Closes (mode, lots or %)
Time Filters (sessions, weekdays)
Filters (Slope, ADX, NRR, ATR squeeze, HTF confirm)
Chop Zone Highlight (on/off, hold bars, color)
---
Why this script is unique (and closed-source)
This is not a simple moving-average crossover. It combines several custom-built methods that are rarely seen in public scripts:
Normalized SMA slope with hysteresis: avoids whipsaws, adapts to volatility regimes.
Multi-filter confirmation: ADX, NRR, ATR squeeze, HTF slope — stacked to improve quality.
Chop detection with persistence: custom counter/hold logic to highlight ranging markets.
Integrated trade management: PineConnector-ready messages with SL/TP, breakeven, dual trailing stops, staged partial closes.
EA-compatible syntax: formatted exactly for PineConnector EAs, including safety toggles.
This represents a full trading framework designed for semi-automated gold scalping, not just a “signal indicator.”
The source is protected to prevent clones and preserve development effort invested in unique logic and PineConnector integration.
---
Recommended starting settings (XAUUSD M5/M15)
Pip size: 0.10
Slope threshold: 0.20 (M5), 0.16–0.20 (M15)
ADX min: 18–22
NRR floor: 2.0–2.4
ATR ratio: 0.65–0.75
ATR SL/TP: SL = 1.5×ATR, TP = 2.5×ATR
Sessions: London & NY
---
Limitations & disclaimer
Not financial advice. Test on demo before live trading.
Performance depends on broker symbols, spread, and volatility regime.
Auto-trading requires PineConnector EA set up correctly.
---
Changelog
v1.0 – Initial release (trend engine, filters, sessions, chop highlight, PineConnector alerts, BE/trailing, partial closes, diagnostics)
在腳本中搜尋"bot"

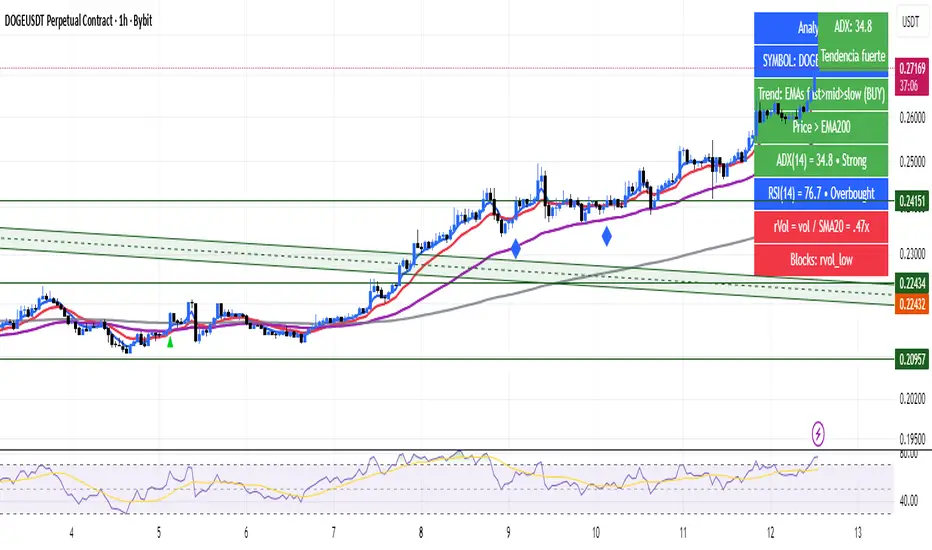
Analyst HUD — Side / ADX / RSI / rVol (bot thresholds)Analyst HUD — Side / ADX / RSI / rVol (bot thresholds)
A clean heads-up display that puts the essentials right on your chart:
✅ Side – quick trend bias (bullish/bearish)
✅ ADX – trend strength, color-coded
✅ RSI – momentum zones (overbought/oversold/neutral)
✅ rVol – relative volume vs average
Built with bot-style thresholds for instant clarity.
No signals, no clutter — just the key metrics you need to spot strong trends and momentum at a glance.
3X Sniper BotThe 3X Sniper Bot is built for traders who demand clarity, precision, and confidence in their decision-making. This tool isn’t just another crossover script—it’s a full multi-confirmation system that helps you spot momentum shifts, identify high-probability entries, and filter out the noise.
🔥 Why traders love it:
Triple confirmation engine: Only fires when multiple conditions align, reducing false signals.
Strong vs. Regular vs. Possible setups: Get nuanced alerts that distinguish between high-conviction moves and early opportunities.
Both Buy & Sell coverage: Stay prepared in any market environment.
Smart flexibility: Works across strict or sequenced signal modes, giving you control over how conservative or aggressive you want to trade.
Visual clarity: Clean chart markers and optional regime shading keep your screen easy to read at a glance.
Alert-ready: Set and forget—never miss a move with real-time TradingView alerts.
This indicator was designed to make complex multi-factor analysis simple, giving traders a clear visual edge without clutter or guesswork. Whether you scalp intraday or swing multi-day, the 3X Sniper Bot adapts to your style.

JeropasMG v17This bot uses a martingale strategy applied to simple moving average crossover signals.
When a buy or sell signal is generated, it opens a position with the configured base size.
If the trade is a loser, the bot increases the size of the next entry by multiplying it by the defined factor (for example, x2), repeating the process until the maximum number of steps allowed is reached.

Ultimate Bot v5 (Full Visual + Reversal + Sustained Signals)Ultimate Bot v5 is a powerful, all-in-one Pine Script strategy designed for traders who want both clarity and precision in their charts. It combines classic momentum indicators, volatility filters, and reversal logic to highlight high-probability trade opportunities.
🔹 Key Features
Full Visual Mode – Clean and easy-to-read buy/sell markers with large arrows and labels.
EMA Trend Detection – Fast & slow EMA crossovers for trend direction.
RSI + MACD Confirmation – Confirms entries with momentum & strength checks.
Reversal Alerts – Detects sharp drops or spikes for rebound/reversal plays.
Sustained Signal Mode – Highlights stronger continuation trends, not just short-term flips.
ADX Strength Filter (optional) – Filters out weak/noisy signals during sideways markets.
ATR Dynamic Positioning – Arrows adapt to volatility so they’re always visible.
Custom Alerts – Works with TradingView alerts for buy, sell, and reversal signals.
🔹 Why Use It?
This bot is designed to help traders:
✅ Spot early reversals and potential bounce opportunities
✅ Confirm strong momentum moves with multi-indicator checks
✅ Avoid false signals in choppy markets
✅ Trade with confidence using visual clarity

AMOGH smc bo/bd - Delta Bot IntegrationAMOGH SMC BO/BD – Delta Bot Integration ek advanced Pine Script indicator hai jo CHoCH ke baad breakout/breakdown (BO/BD) entries detect karta hai. Ye structure flip, SL, aur smart alerts ke sath auto-trading bots ke liye optimized hai. Entry precision aur exit logic strategy-grade hai.

HF Crypto Scalping BotHigh-Frequency Crypto Scalping Bot for ETHUSDT
This bot is designed for scalping ETHUSDT on a 1-minute chart using a blend of technical indicators and market structure logic.
🔍 Strategy Highlights:
Range Mode: Uses RSI and MFI to identify overbought/oversold zones near support/resistance.
Trend Mode: Detects MACD momentum combined with confirmed S/R breakouts.
Smart Risk Management: Dynamic stop loss and take profit based on risk:reward ratio.
Adaptive Market Logic: Automatically switches between trend and range conditions.
Real-Time Table: Displays RSI, MFI, MACD trend, market mode, entry/exit prices, and stop/target levels.
Visual Cues: Buy/Sell/Exit signals plotted directly on the chart with color-coded levels.
Alerts: Integrated long/short entry and exit alerts with live price and indicator values.
Customize the input parameters to fit your risk profile and asset volatility. Ideal for fast-paced scalping with dynamic conditions.

UT Bot + Cooldown + Visual FVGSynopsis – UT Bot + Cooldown + Visual FVG
This TradingView script combines:
✅ UT Bot Reversal Signals
Based on ATR and volatility logic
BUY when trend flips from bearish to bullish
SELL when trend flips from bullish to bearish
✅ Cooldown Filter
Limits signals to 1 per X bars (default 30)
Prevents overtrading during choppy price action
✅ Optional FVG Markers (Fair Value Gaps)
Visually shows bullish or bearish imbalances (3-bar gaps)
Does not affect signal generation — only for confluence
🔍 Ideal for traders who want clean, time-filtered signals with visual price-action context. Suitable for futures, crypto, or forex on intraday charts.

Grid Bot BacktestingBinance, Bybit, Bitget, and other cross-exchange (grid) trading bot backtesting.
Auto bound: Automatically setting upper and lower price bounds.
Manual: Setting upper and lower price bounds manually.
The graph below represents the overall asset changes (initial investment amount + current position profit + grid profit).
Try using backtesting when setting up a grid bot on the exchange!
바이낸스, 바이비트, 비트겟 등 교차거래(그리드) 봇 백테스팅
Auto bound : 자동으로 상,하단 가격 설정
Manual : 직접 상,하단 가격 설정
아래 그래프는 총 자산 변화입니다.(초기투자금액 + 현재 포지션 수익 + 그리드 수익)
거래소에서 그리드 봇 설정할 때 백테스팅 유용하게 써보세요!

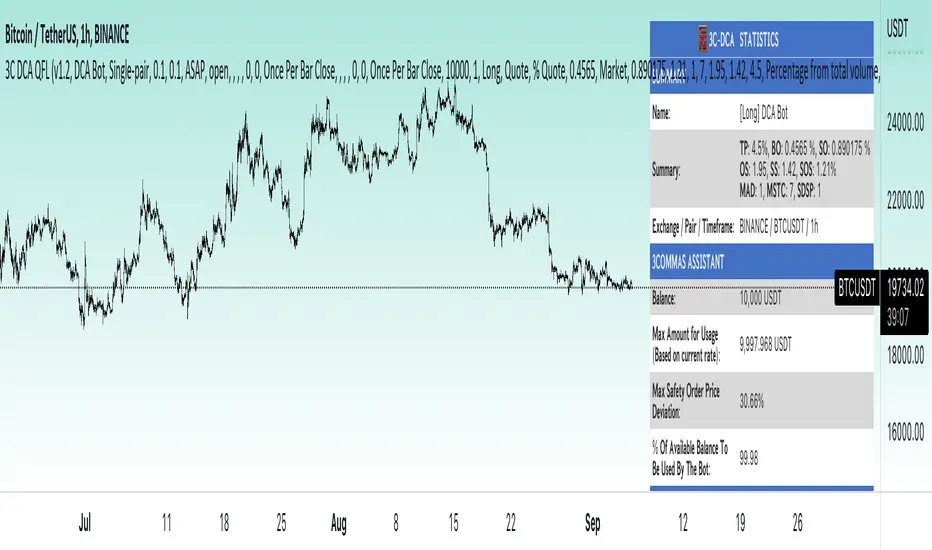
DCA Liquidation Calculation [ChartPrime]The DCA Liquidation Calculator is a powerful table indicator designed for both manual and bot-assisted traders who practice Dollar Cost Averaging (DCA). Its primary objective is to help traders avoid getting liquidated and make informed decisions when managing their positions. This comprehensive table indicator provides essential information to DCA traders, enabling them to plan their trades effectively and mitigate potential risks of liquidation.
Key Features:
Liquidation Price Awareness: The DCA Liquidation Calculator calculates and displays the liquidation price for each trade within your position. This critical information empowers traders to set appropriate stop-loss levels and avoid being liquidated in adverse market conditions, especially in leveraged trading scenarios.
DCA Recommendations: Whether you are executing DCA manually or using a trading bot, the DCA Liquidation Calculator offers valuable guidance. It suggests optimal entry prices and provides insights into the percentage deviation from the current market price, helping traders make well-timed and well-informed DCA decisions.
Position Sizing: Proper position sizing is essential for risk management. The DCA Liquidation Calculator helps traders determine the percentage of capital to allocate to each trade based on the provided insights. By using the recommended position sizing, traders can protect their capital and potentially maximize profits.
Profit and Loss Visualization: Gain real-time visibility into your Profit and Loss (PnL) with the DCA Liquidation Calculator. This feature allows you to monitor your trades' performance, enabling you to adapt your strategies as needed and make data-driven decisions.
Margin Call Indicators: Anticipating potential margin calls is crucial for maintaining a healthy trading account. The DCA Liquidation Calculator's smart analysis helps you identify and manage potential margin call situations, reducing the risk of account liquidation.
Capital Requirements: Before entering a trade, it's vital to know the required capital. The DCA Liquidation Calculator provides you with this information, ensuring you are adequately prepared to execute your trades without overextending your resources.
Maximum Trade Limit: Considering your available capital, the DCA Liquidation Calculator helps you determine the maximum number of trades you can enter. This feature ensures you maintain a disciplined and sustainable trading approach aligned with your financial capabilities.
Color-Coded Risk Indicators:
Green Liquidation Price Cell: Indicates that the position is considered safe from liquidation at the given parameters.
Yellow Liquidation Price Cell: Warns traders of potential liquidation risk. Exercise caution and monitor the trade closely to avoid undesirable outcomes.
Purple Liquidation Price Cell: Shows the liquidation price, but it does not necessarily indicate an imminent liquidation. Use this information to make prudent risk management decisions.
Red Row: Signals that the trade cannot be executed due to insufficient capital. Consider alternative strategies or ensure adequate capitalization before proceeding.
Settings explained:
In conclusion, the DCA Liquidation Calculator equips traders with essential tools to make well-calculated decisions, minimize liquidation risks, and optimize their Dollar Cost Averaging strategy. By offering comprehensive insights into your trading position, this indicator empowers you to navigate the markets with confidence and increase your potential for successful and sustainable trading.

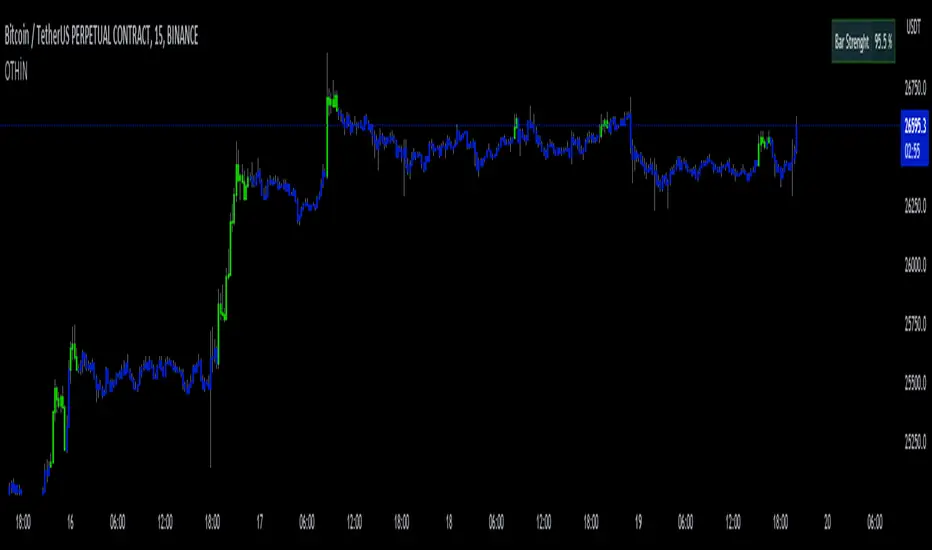
D-Bot Alpha All in One BarsThis indicator, known as "D-Bot Alpha All in One Bars," combines various technical analysis methodologies. It amalgamates a range of oscillator-based and moving average-based measures to determine the 'strength' or 'effectiveness' of a particular bar. This could potentially provide investors with an idea of the direction the market is moving.
Each indicator (such as RSI, Stochastic, WPR, MFI, CCI, ADX, RVI, and Volatility) measures a different market condition, and these conditions are combined to form an overall 'bar strength' value. This value is color-coded based on set threshold values (Lower Threshold and Upper Threshold) to indicate a bullish (green) and bearish (red) market condition.
4h
*The indicator works best on timeframes of 4 hours and below. For higher timeframes, you'll need to perform optimization.
The strength of this indicator lies in its ability to provide a broad market view by combining a range of analytical methods. However, its weakness is that each measurement carries equal weight, which can sometimes result in misleading signals.
15m
This indicator is typically used in conjunction with other technical analysis tools. For example, tools that provide a broader market structure, such as trend lines, support and resistance levels, or Fibonacci retracement levels, can be used alongside this indicator.
5m
An example trading strategy could involve monitoring the bar strength of the indicator and making buy trades during green (bullish) bars and sell trades during red (bearish) bars. However, as always, it's important to thoroughly test any trading strategy before implementing it.
***Please follow my profile to access indicators full of original ideas. Happy trading...
1m
Türkçe açıklama:
"D-Bot Alpha All in One Bars" indikatörü çok çeşitli teknik analiz metodolojilerini bir araya getiriyor. İndikatör, bir dizi farklı osilatör ve hareketli ortalama tabanlı ölçütü birleştirerek, belirli bir barın 'gücünü' veya 'etkililiğini' belirlemek için kullanılıyor. Bu, potansiyel olarak yatırımcılara marketin hangi yönde ilerlemek istediğine dair bir fikir verebilir.
Her bir gösterge (RSI, Stokastik, WPR, MFI, CCI, ADX, RVI ve volatilite gibi) kendi başına farklı bir piyasa durumunu ölçüyor ve bu durumlar birleştirilerek genel bir 'bar gücü' değeri elde ediliyor. Bu değer, belirlenen eşik değerlere (Lower Threshold ve Upper Threshold) göre renklendirilerek piyasada bir yükseliş (yeşil) veya düşüş (kırmızı) durumu gösteriyor.
Bu indikatörün güçlü yönleri, bir dizi farklı analitik yöntemi bir araya getirerek geniş bir piyasa görünümü sağlamasıdır. Ancak zayıf yanı, her bir ölçütün ağırlığının eşit olduğu ve bazen yanıltıcı sinyaller verebilecek olmasıdır.
Bu indikatör genellikle diğer teknik analiz araçlarıyla birlikte kullanılmalıdır. Örneğin, eğilim çizgileri, destek ve direnç seviyeleri veya Fibonacci retracement seviyeleri gibi daha genel piyasa yapısı araçları bu indikatörle birlikte kullanılabilir.
Örnek bir işlem stratejisi olarak, indikatörün bar gücünü gözlemleyebilir ve yeşil (yükseliş) barlar sırasında alım, kırmızı (düşüş) barlar sırasında satış yapabilirsiniz. Ancak, her zaman olduğu gibi, herhangi bir trade stratejisi belirlenmeden önce dikkatli bir şekilde test etmek önemlidir.
TENKAN SCALPER STRATEGYTENKAN SCALP is a fully automatic trading system.
It is a continuation of our previous ichimoku release. This time however we throw out the rule book and use ICHIMOKU in a very different way.
It applies non traditional money management tactics.
While most trading strategies rely on a stop loss and a take profit target to manage risk. This strategy uses either no stop loss at all or a time based stop loss.
You might ask yourself the question why would you keep a trade open if it goes against you? Here are a phew reasons why the script does what it does.
Forex Markets consolidate most of the time. If you wait long enough your Take Profit will get hit anyways most of the time
You don't have to risk everything per trade. I keep my orders small so to keep some powder to get into some more trades
All the extra trades you take while one trade is in drawdown limit the drawdown as they provide cashflow
On lower timeframes the markets are so chaotic that a stop loss is very likely to get hit by a wick
About backtest below
This backtest uses a spread of 2 pips for entries and a default position size of 100% of equity. This is only possible on exchanges where spread is low and you have 10:1 leverage or more. It does not represent results obtainable without leverage. Do take into account that there are a lot of forex exchanges that provide this leverage, however a 2 pip spread is not always guaranteed and only applies to major pairs.
This backtest does not use the TIME BASED STOPS functionality.
Always start with small position sizing and see how the strategy performs before adding risk.
Explanation of variables:
Chikou(lagging span): pink line, this is price plotted 26 bars ago. People ignore the power of this it is crucial to see how chikou behaves towards past price action as seen in the chart below where we got an entry at red arrow because chikou bounced from past fractal bottom.
Kijun-Sen(base line): Black line or color coded line. This is the equilibrium of last 26 candles. To me this is the most important line in the system as it attracts price.
Kijun = (Highest high of 26 periods + Lowest low of 26 periods) ÷ 2
Tenkan-Sen(conversion line): Blue line. This is the equilibrium of last 9 candles. In a strong uptrend price stays above this line.
Tenkan = (Highest high of 9 periods + Lowest low of 9 periods) ÷ 2
Senkou A (Leading span A)= Pink cloud line, this is the average of the 2 components projected 26 bars in the future.
Senkou A = (Tenkan + Kijun) ÷ 2
Senkou B (Leading span B) = Green cloud line, this is the 52 day equilibrium projected 26 bars in the future.
Senkou B = (Highest high of prior 52 periods + Lowest low of prior 52 periods) ÷ 2
projection: Script uses same function for variable calculation and substracts a number on each next bar as to make a projection of where the variable will be in future bars if price stayed the same. This works as ICHIMOKU calculations use the middle point of a past set of data. The shorter that amount of bars will be in line with the data that it will be restricted to in future if price stayed the same.
Detection of Market Environment
To enter trades the script uses a lot of ICHIMOKU concepts. Contrary to how most people trade ICHIMOKU this script takes an environment that ICHIMOKU identifies as trending upwards and shorts in that environment. The same will be applied to a downtrend where it will open LONGS.
List of CRITERIA for a trend:
Grapling Hook: this is a component based on the chikou span (closing price displaced 26 bars into the past). The script will use an ATR based range to define a possible future projection to the CHIKOU line. For a market to be bullish there should be no price action happening within this area. Market is free to move upwards. Vice versa for bearish .
Kumo Cloud: script will check if price is above the cloud for bullish trend and below cloud for bearish trend .
Chikou above Kijun: script will check if the chikou line is above the KIJUN line of 26 bars ago. This is further confirmation that price is trending high enough compared to it's past data. Vice versa for downtrend.
Kijun projection: script will check if past Kijun is lower than future projected Kijun. This to ensure we get an equilibrium in our favour in the future. Vice versa for downtrend
Tenkan projection: script will check if future Tenkan-sen will be higher than Kijun-sen for an uptrend. Vice versa for downtrend.
Cloud projection: script will check if in 9 bars the Senkou Span A will be higher than Senkou Span B for an uptrend. Vice versa for downtrend.
Example:
This script does not visualise the prediction lines like I show in the example. I show them here to clarify how the script works.
Usage
Backtests are not indicative of future results, although a trader may want to use a strategy script to have a deeper understanding of how their strategy responds to varying market conditions, or as a tool for identifying possible flaws for a strategy that may be indicative of good or bad performance in the future.
Strategy Settings:
Minimum Body Size (atr): this is the minimum ATR a signal bar needs to be for entry. This is useful because our TP is based on previous bar.
Lot size per trade: this setting does not impact backtest. It is used to for the signals to let tradingconnect.com know your position size.
Direction: do you want to trade longs or shorts. I personally use both a long bot and a short bot at the same time.
Positions Allowed: the amount of positions the script will keep open as a maximum. You do not want to open too many positions, this is for risk management.
Close all positions at drawdown: if total open positions loss gets to this % target it will close all positions.
MetaTrader Prefix: when the script sends a signal it will put this text right before the symbol name from syminfo.ticker
MetaTrader Suffix: when the script sends a signal it will put this text right after the symbol name from syminfo.ticker
Charts below are some examples on how the script handles orders on default settings:
without time based SL
with time based SL
how it handles pyramiding
www.tradingview.com
Tradingconnector.com:
For full automation of the forex market the script uses this connector to execute trade on MT4. The alerts the script sends using the alerts() function call are structured in a way tradingconnector will recognise and send directly to MT4. You can find documentation about this tool on their own website.
Personal recommendation is to start with a minimum lot size and track performance, if you are comfortable scale the size up. You can do that by increasing the lot size setting in the script and making a new alert. Make sure to delete the old one.
How to access
You can see the Author's Instructions below to visit our telegram to get more information on how to get access.

Wunder Volatility botWunder Volatility bot
We have used the Average True Range (ATR) in many of its trading versions.
1. ATR with MA. This indicator includes the ATR as well as the simple moving average, which helps to restore the expected market.
2. We apply percentage based ATR to determine how volatile the market is and whether to buy or sell at that time. For trading, we will filter the market and make trades only within the specified range. This range will adjust depending on the asset, so you will need to change the settings if you are trading multiple assets.
3. A function for calculating risk on the portfolio (your deposit) has been added to the Wunder Volatility bot script. When this option is enabled, you get a calculation of the entry amount in dollars relative to your Stop Loss. In the settings, you can select the risk percentage on your portfolio. The loss will be calculated from the amount that will be displayed on the chart.
For example, if your deposit is $1000 and you set the risk to 1%, with a Stop Loss of 5%, the entry volume will be $200. The loss at SL will be $10.10, which is your 1% risk or 1% of the deposit.
**Important!** The risk per trade must be less than the Stop Loss value. If the risk is greater than SL, then you should use leverage.
The amount of funds entering the trade is calculated in dollars. This option was created if you want to send the dollar amount from Tradingview to the exchange. However, putting your volume in dollars you get the incorrect net profit and drawdown indication in the backtest results, as TradingView calculates the backtest volume in contracts.
To display the correct net profit and drawdown values in Tradingview Backtest results, use the ”Volume in contract” option.

3Commas dollar cost averaging (DCA) QFL IndicatorAs investors, we often face the dilemma of willing high stock prices when we sell, but not when we buy. There are times when this dilemma causes investors to wait for a dip in prices, thereby potentially missing out on a continual rise. This is how investors get lured away from the markets and become tangled in the slippery slope of market timing, which is not advisable to a long-term investment strategy.
Skyrex developed a complex indicator based on dollar-cost averaging in Quick Fingers Luc's interpretation. It is a combinations of strategies which allows to systematically accumulate assets by investing scaled amounts of money at defined market cycle global support levels. Dollar-cost averaging can reduce the overall impact of price volatility and lower the average cost per asset thus even during market slumps only a small bounce is required to reach take profit.
The indicator script monitors a chart price action and identifies bases as they form. When bases are reached the script provides entry alerts. During price action development an asset value can go lower and in this way the script will perform safety entries alerts at each subsequent accumulation levels. When weighted average entry price reaches target profit the script will perform a take profit action alert.
Bases are identified as pivot lows in a fractal pattern and validated by an adjustable decrease/rise percentage to ensure significancy of identified bases. To qualify a pivot low, the indicator will perform the following validation:
Validate the price rate of change on drops and bounces is above a given threshold amount.
Validate the volume at the low pivot point is above the volume moving average (using a given length).
Validate the volume amount is a given factor of magnitude above is above the volume moving average.
Validate the potential new base is not too close to the previous range by using a given price percent difference threshold amount.
A fractal pattern is a recurring pattern on a price chart that can predict reversals among larger, more chaotic price movements. These basic fractals are composed of five or more bars. The rules for identifying fractals are as follows:
A bearish turning point occurs when there is a pattern with the highest high in the middle and two lower highs on each side.
A bullish turning point occurs when there is a pattern with the lowest low in the middle and two higher lows on each side.
Basic dollar-cost averaging approach is enhances by implementation of adjustable accumulation levels in order to provide opportunity of setting them at defined global support levels and Martingale volume coefficient to increase averaging effect. According to Quick Fingers Luc's principles trading principles we added volume validation of a base because it allows to confirm that the market is resistant to further price decrease.
The indicator supports traditional and cryptocurrency spot, futures , options and marginal trading exchanges. It works accurately with BTC , USD, USDT, ETH and BNB quote currencies. Best to use with 1H timeframe charts and limit orders. The indicator can be and should be configured for each particular asset according to its global support and resistance levels and price action cycles. You can modify levels and risk management settings to receive better performance
The difference between core script and this interpretation is that this strategy is specially designed for 3Commas bots
How to use?
1. Apply indicator to a trading pair your are interested in using 1H timeframe chart
2. Configure the indicator: change layer values, order size multiple and take profit/stop loss values according to current market cycle stage
3. Set up a TradingView custom alert using the indicator settings to trigger on a condition you are interested in
4. The indicator will send alerts when to enter and when to exit positions which can be applied to your portfolio using external trading platforms
5. Update settings once market conditions are changed using backtests on a monthly period
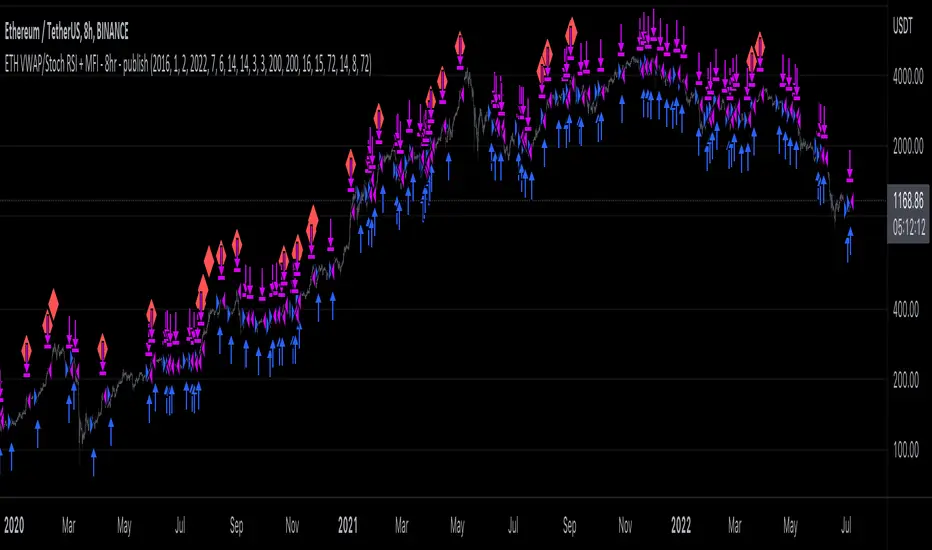
ETH long bot - 8hrThis is a high-latency algorithm, safely running on the Ethereum 8hr chart where it can execute trades on a multi-day timeframe, making it easy to enter and exit large positions and without incurring excessive commission fees.
As a long bot, this script should be ran in markets that are trending upwards. Nonetheless, the operator can be at ease knowing that the script can safely run autonomously during these extended periods. It is shown here performing full-time over a 46 month period, from January 2019 through October 2021, steadily increasing the available capital despite the asset's fluctuations. While the buy and hold return over this time was 714%, the algorithm produced a net profit 4,060%, outperforming the market by over 5.5x. This equates to a 40x return on investment in 4 years.
The strategy behind this algorithm is to always capitalize on significant jumps in the market. This is accomplished by using a simple combination of RSIs:
- One RSI uses VWAP as a source, which is primarily responsible for entering growth trends whenever they begin
- The other is a Stochastic RSI , which is primarily responsible for identifying exhausted periods of growth
These calculations are calibrated so that the bot can jump in and out of trades to improve its position when there isn't significant price action one way or the other, but is then able to remain in positions during uptrends that are backed by volume to achieve maximum gains. This strategy is reflected by the fact that while profitable trades are almost 3 times larger than losing trades, on average, they also last for an average of 6 days, whereas losing trades usually last about 2.
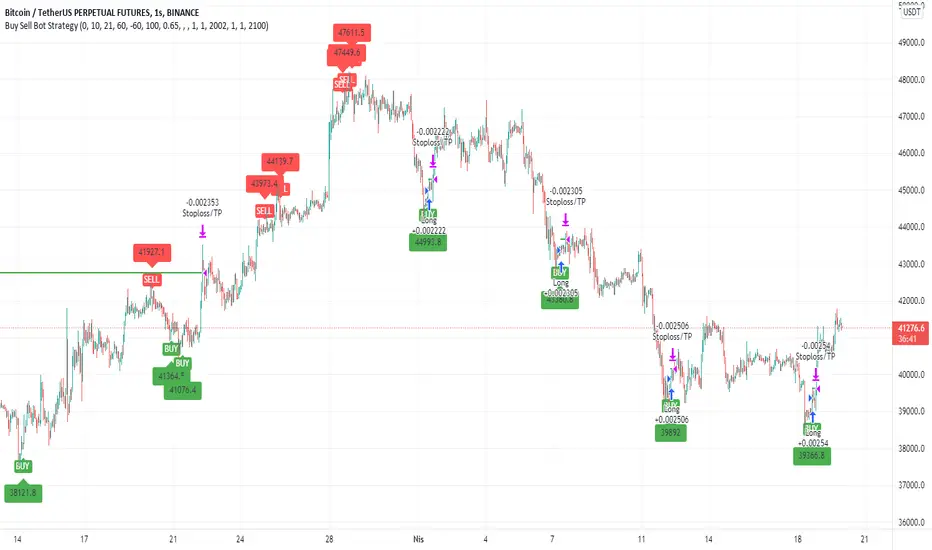
Buy Sell Bot StrategyHello Everyone,
In this strategy, I benefited from the values of RSI and wave trend indicators, which are the oldest and most used indicators in the market. I contributed to this bi-valued indicator myself with a bivariate formula. My variables are actually a simple intersection algorithm, the intersection of the wave trend indicator and the RSI indicators when they are oversold or overbought.
As you all know, we can send signals to bot sites via tradingview. You can use bot signals boxes in this strategy. You can analyze past transactions in the Date settings section. In the indicator settings section, you can change the settings of the overbought and oversold zones. Perhaps the most important feature here is the USE SELL SIGNALS section. I would like to emphasize this section in particular that when you mark the use sell signal section, the strategy will be processed in the buy section and will not be processed in the sell section. If you do not click on the USE SELL SIGNALS section, the strategy will be processed in the buy section, but this time it will be exited when the target in the take profit section is reached. THIS WAS IMPORTANT.
There is another important point here. Always in position and USE SELL SIGNALS sections do not work together. Run these two features one by one. It is a strategy that is constantly in operation through the name of the Always in position feature, I do not recommend it. The USE PERCENTAGE DECREASE feature, on the other hand, is the section where we want the share to drop as a percentage to enter the second trade after the first purchase is made in the settings section if you activate the pyramiding feature. You can use the tradingview help page for the pyramiding feature.
I found this strategy suitable to use in the 1-hour time frame in the crypto market and adjusted it that way. Of course, you can use it by changing the settings in stocks and in different time periods. big wins
GRID SPOT TRADING ALGORITHM - GRID BOT TRADING STRATEGYGRID SPOT TRADING ALGORITHM : LONG ONLY STRATEGY OPEN SOURCE
This is a long only strategy for spot assets.
HOW IT WORKS
Grid trading is a trading strategy where an investor creates a so-called "price grid". The basic idea of the strategy is to repeatedly buy at the pre-specified price and then wait for the price to rise above that level and then sell the position (and vice versa with shorting or hedging).
FEATURES
Grids: This algorithm has a total of 10 grids.
Take profit: The trader can increase or decrease the distance between the grids from the User Interface panel, the distance between one grid and another represents the take profit.
Management: The algorithm buys 10% of the capital every time the price breaks down a grid and sells during a rise to the next higher grid. The initial capital is invested in 10 sizes which represent 10% of the capital per trade.
Stop Loss: The algorithm knows no stop loss as long as it is not activated from the User Interface panel. By activating the stop loss from the User Interface panel the algorithm will insert a close condition on all trades which will be calculated from the last lower grid.
Trades: Trades are opened only if the price is within the grid. If the market leaves the grid the algorithm will not buy new positions or sell new positions.
Optimal market conditions: The favorable market for this algorithm is the sideways market.
LIMITATIONS OF THE MODEL
The trader must take into account that this is a static model. It only works perfectly well if the market is in a sideways phase and incurs heavy losses if the market takes a downward trend. The model is unusable for an uptrend. The trader must therefore carefully analyze the market where he intends to use this strategy, making sure that the price is in a sideways phase.
USES
Indispensable research and backtesting tool for those using bots for their investments. The algorithm produces a backtesting of the strategy for past history. It is used by professional traders to understand if this strategy has been profitable on a market and what parameters to use for bots using this strategy (Kucoin, Binance etc.).
If you would like to develop your own algorithm with customized conditions based on a grid strategy, please contact us.
If you need help in using this tool, please contact us without hesitation.

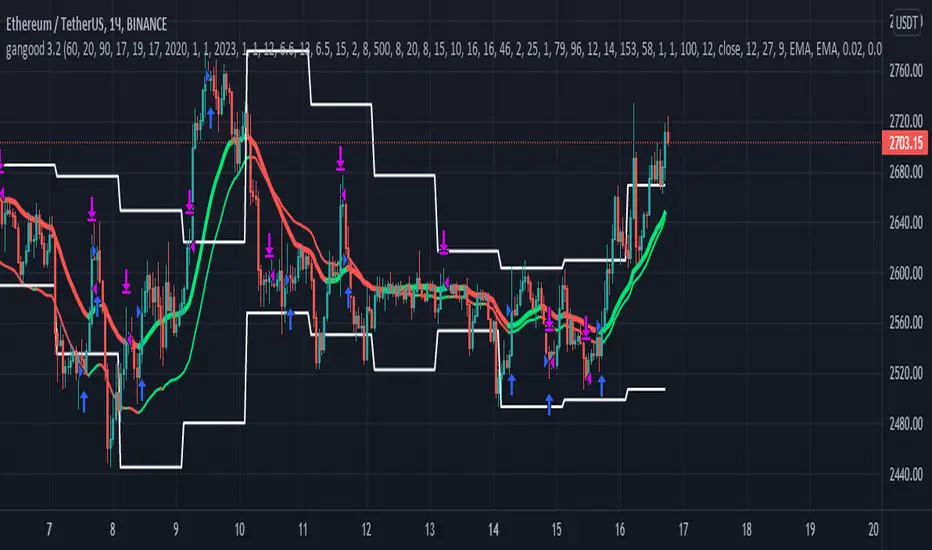
gangood bot for FinandyGangood is a mean reversion algorithm currently optimized for trading the ETH/USDT pair on the 1 hour chart time frame. All indicator inputs use the closing price of the period, and all trades are executed at the open of the period following the period in which the trading signal was generated.
To take into account slippage, the commission costs 0.15%.
Backtest result from 2020.
Result since 2019 2,500,000%, maximum drawdown 18%
This bot uses 11 indicators:
1) ADX
2) RANGE FILTER
3) SAR
4) RSI
5) TWAP
6) JMA
7) MACD
8) VOLUME DELTA
9) VOLUME WEIGHT
10) MA
11) TSI
Pattern 1:
There are 3 main components that make up Gangood: I. Trend Filter. The algorithm uses a version of the ADX indicator as a trend filter to only trade during certain time periods when price is most likely to be range-bound (i.e., average retracement). This indicator consists of a fast ADX and a slow ADX both using the same lookback period.
The ADX is smoothed with a 6-period EMA and the slow ADX is smoothed with a 12-period EMA. When the fast ADX is above the slow ADX , the algorithm does not trade because it indicates that the price is most likely trending, which is bad for a mean reversion system. Conversely, when the fast ADX is below the slow ADX, the price is likely to be in a range, so this is the only time the algorithm is allowed to trade. II. Bollinger Bands When the trend filter allows trading, the algorithm uses Bollinger Bands.
Indicator for opening long and short positions. The Bolliger Bands indicator has a 20 lookback period and a 1.5 standard deviation for both the upper and lower bands. When the price crosses the lower band, a buy signal is generated and a long position is opened. When the price crosses the upper band, a sell signal is generated and a short position is opened.
Pattern 2:
Based on RSI which is commonly used as a trend reversal indicator. However, here it is used as a trend-setting indicator, often with great success. This pattern only takes long trades, which is quite successful in a bull market.
Pattern 3:
Long or short trades are determined by the intersection of the fast EMA with the slow EMA for long positions and vice versa for short positions. Trades should only occur close to intersections. We then use the MACD for the long position. an indicator with a 10-minute time frame where we look for high peaks in negative values for longs and vice versa for shorts. They should be significantly higher than the other peaks.
Capital Management:
The maximum leverage in this strategy, I would recommend 2x, in order to trade without unnecessary risks and keep your nerves in order.
Bot setup:
I use the Finandy terminal, in which you can easily trade with this strategy.
1. We go to binance and turn on the hedging mode, this is necessary so that if tradingview sends a webhook for buying later than for selling.
2. Adding a new signal to Finandy
2.1. Open tab
2.1.1. "Order side" Strategy
2.1.2. "Amount" Balance% x Leverage
2.1.3. We set the percentage of the order two times less than the one you want
2.1.4. "Shoulder" is twice as large as the one you want
2.2.Close tab
2.2.1. "Enebaled" tick
2.2.2. "Reverse / Close" Disable
3. Set a notification for this strategy.
4. Copy "Signal URL" and paste it into webhook on tradingview
5. Copy "Signal Message" and paste it into the message on tradingview
Argo I (alerts for 3commas single bots)This script lets users create BUY/SELL alerts for 3commas single bots in a simple way, based on a built in set of indicators that can be tweaked to work together or separately through the study settings. Indicators include Bollinger Bands, Williams %R, RSI, EMA, SMA , Market Cipher, Inverse Fisher Transform.
If the user choses to create both BUY and SELL signals from the study settings, the alert created will send both BUY and SELL signals for the selected pair. Note the script will only send alerts for the pair selected in the study settings, not for the current chart (if different).
How to use:
- Add the script to the current chart
- Open the study settings , insert bot details. Pairs MUST be in capital letters or 3commas will not recognize them.
- Still in the study settings, tweak the deal start/close conditions from various indicators until happy. The study will plot the entry / exit points below the current chart (1 = buy, 2 = sell)
- Ideally, test the settings with a backtesting script. The present script is compatible with the Trading Parrot's backtester.
- When happy, right click on the "..." next to the study name, then "Add alert'".
- Under "Condition", on the second line, chose "Any alert () function call". Add the webhook from 3commas, give it a name, and "create".
Happy tweaking!

Trend Bot Signal Detector by [ToplaninKizlarUcuyoruz]- This indicator working as a detector to receive my previous indicator's (Trend Bot, below) signals and appear all of the coins' signals in one table.
- You can also set alarms to receive notifications when signals.
- The indicator allow only 4 coins and four time intervals for each coins. (15 min - 1 hour - 4 hour - 1 day)
- You can add the indicator multiple times to keep track of coins more than 4 or track different exchanges.
** You can see a more descriptive page in my website. (Link is below and on my profile) **
The indicator (Trend Bot) which signals were received:
(you can also find more information about how it works, click on this chart picture)

Zendog V2 backtest DCA bot 3commasHi everyone,
After a few iterations and additional implemented features this version of the Backtester is now open source.
The Strategy is a Backtester for 3commas DCA bots. The main usage scenario is to plugin your external indicator, and backtest it using different DCA settings.
Before using this script please make sure you read these explanations and make sure you understand how it works.
Features:
- Because of Tradingview limitations on how orders are grouped into Trades, this Strategy statistics are calculated by the script, so please ignore the Strategy Tester statistics completely
Statistics Table explained:
- Status: either all deals are closed or there is a deal still running, in which case additional info
is provided below, as when the deal started, current PnL, current SO
- Finished deals: Total number of closed deals both Winning and Losing.
A deal is comprised as the Base Order (BO) + all Safety Orders (SO) related to that deal, so this number
will be different than the Strategy Tester List of Trades
- Winning Deals: Deal ended in profit
- Losing deals: Deals ended with loss due to Stop Loss. In the future I might add a Deal Stop condition to
the script, so that will count towards this number as well.
- Total days ( Max / Avg days in Deal ):
Total Days in the Backtest given by either Tradingview limitation on the number of candles or by the
config of the script regarding "Limit Date Range".
Max Days spent in a deal + which period this happened.
Avg days spent in a deal.
- Required capital: This is the total capital required to run the Backtester and it is automatically calculated by
the script taking into consideration BO size, SO size, SO volume scale. This should be the same as 3commas.
This number overwrites strategy.initial_capital and is used to calculate Profit and other stats, so you don't need
to update strategy.initial_capital every time you change BO/SO settings
- Profit after commission
- Buy and Hold return: The PnL that could have been obtained by buying at the close of the first candle of the
backtester and selling at the last.
- Covered deviation: The % of price move from initial BO order covered by SO settings
- Max Deviation: Biggest market % price move vs BO price, in the other direction (for long
is down, for short it is up)
- Max Drawdown: Biggest market % price move vs Avg price of the whole Trade (BO + any SO), in the other
direction (for long price goes down, for short it goes up)
This is calculated for the whole Trade so it is different than List of Trades
- Max / Avg bars in deal
- Total volume / Commission calculated by the strategy. For correct commission please set Commission in the
Inputs Tab and you may ignore Properties Tab
- Close stats for deals: This is a list of how many Trades were closed at each step, including Stop Loss (if
configured), together with covered deviation for that step, the number of deals, and the percentage of this
number from all the deals
TODO: Might add deal avg value for each step
- Settings Table that can be enabled / disabled just to have an overview of your configs on the chart, this is a
drawn on bottom left
- Steps Table similar to 3commas, this is also drawn on bottom left, so please disable Settings table if you want
to see this one
TODO: Might add extra stats here
- Deal start condition: built in RSI-7 or plugin any external indicator and compare with any value the indicator plots
(main purpose of this strategy is to connect your own studies, so using external indicator is recommended)
- Base order and safety orders configs similar to 3commas (order size, percent deviation, safety orders,
percent scale and volume scale)
- Long and Short
- Stop Loss
- Support for Take profit from base order or from Total volume of the deal
- Configs help (besides self explanatory):
- Chart theme: Adjust according to the theme you run on. There is no way to detect theme at the moment.
This adjust different colors
- Deal Start Type: Either a builtin RSI7 or "External indicator"
- Indicator Source an value: If using External Indicator then select source, comparison and value.
For example you could start a deal when Volume is greater than xxxx, or code a custom indicator that plots
different values based on your conditions and test those values
- Visuals / Decimals for display: Adjust according to your symbol
- BO Entry Price for steps table: This is the BO start deal price used to calculate the steps in the table

TFi Simple Moving Average Bot V1 - PUBLICThe bot is using 2 moving averages for detecting the trend; the type of moving average is configurable; if the 2 moving averages are crossing it enters a long or short position. A stop-loss and profit-target can be configured; if reaching the profit-target, the bot is closing 50% (configurable) of the position, from this time on it is using a trailing-stop to close the position if the trailing-stop has been crossed.
The following moving-averages can be configured:
DEMA
EMA
HMA
RMA
SMA
TEMA
VWMA
WMA
Overview of features:
Optional stop-loss and profit-target/trailing-stop
Built-in backtesting engine with start balance, position size and pyramiding; each year will be evaluated separately
Inputs for a percentage entry and exit slippage, entry/exit and daily funding fees
Configurable alerts, which follow the exact position of the entry/exit marker
Alert messages contain predefined trading instruction to execute orders via TradeFab's proprietary trading server, which supports Alpaca-Markets, TD Ameritrade, Oanda, CCXT API's, or can be defined by the user
The script renders a performance/status table, which shows the current position status and result of the built-in trading simulation results. The following statistics are shown:
Current position PnL - also background turns green if position is in profit and red if in loss
Average entry price and number of positions
Current percentage distance to the optional stop-loss level
Current Maximum Draw Down
Number of wins and losses and the win/loss ratio per year and overall
Profit and loss amount, paid fees per year and overall
Profit-ratio and Maximum Draw Down per year and overall
Balance and ROI per year and overall

Zendog Backtest-DCA-Bot-3commasHi everyone,
This is a strategy that serves as a basic Backtester for 3commas DCA bots.
You can plugin your own studies into the Backtester, play around with their parameters as well with the DCA parameters and see how they can provide best result on historical data.
Features:
- Meaningful statistics that actually group orders under the same deal.
(base order + safety orders are the same deal, but Tradingview Strategy Tester shows them as separate trades)
See how many safety orders were used for each deal.
- Deal start condition: built in RSI-7 or external indicator
(main purpose of this strategy is to connect your own studies, so using external indicator is recommended)
- Base order and safety orders configs similar to 3commas
(order size, percent deviation, safety orders, percent scale and volume scale)
- Support for Long strategy for now (plan to add Short)
