inwCoin HMA AlertSimple alert to go along with the inwCoin HMA Strategy
Please not that the alerts are persistent 2.70% , if you already enter the position,
just ignore the rest of the same alert until the opposite alert show up
( long then short / or short then long , if change, just close and enter opposite position )
You can set the alert and let it tell you to iOS app via TradingView app ( yey! )
Please note that, if you don't have bot to track your trailing start/stop. you have to enter the TP/SL manually ( also tracking the position )
So... be careful to follow this alert. just try it with small amount of money first.
and make sure to set stop loss every time because OKEX is a portfolio killer if you don't have any stop loss.
** if you cannot trailing stop bot, just uncheck the "Aggressive Strategy" in both strategy and alert to reduce alert to minimum level.
在腳本中搜尋"bot"

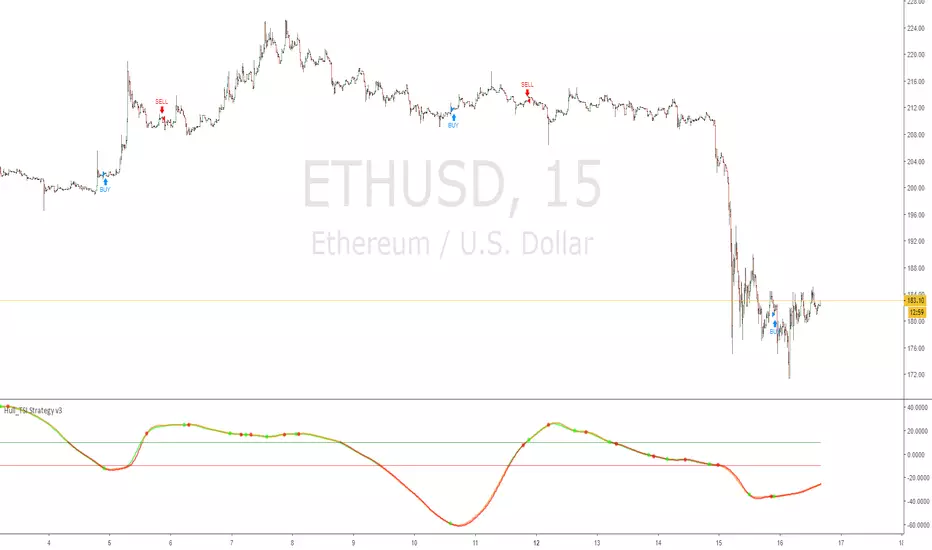
Hull_TSI Strategy v3True Strength Index, but Exponential Moving Average taken out and replaced with Hull Moving Average
this version uses 3 Hull MA's as well as the TSI value crossovers above or below the upper/lower lines
This version is the closest to the API bot featured at gekkoplus.com
Hull_TSI bot is competing in the competition
" Gekko Plus is hosting a strategy contest. Submit the best performing Gekko strategy and win 0.1 BTC! "
15 Nov 2018: Strategy contest start
10 Dec 2018: Strategy contest end
12 Dec 2018: Contest evaluation, announcement of winners!
Most Profitable HelloEpicWorld v2.0[Eric] This is the most profitable un-repaint fully support auto trading Algo on earth.
Usage:
Buy and Sell && Stop Loss
1. When it shows buy, you can buy it immediately or wait for a small dump to buy it, stop loss at the red cross below.(Both buy and stop signal support alert autoview bots auto trading)
2. When it shows sell, you can sell it immediately or wait for a small pump to sell it, stop loss at the green cross above.(Both buy and stop signal support alert autoview bots auto trading)
Background Color:
It can be turn on and off in the settings. When it is green, you have a 78% probability to get a win trade on buying the pullback. And a 73% probability to get a win trade on selling the pullback when it's red. So, even missed the buy and sell signal, you can still open a trade in the middle, but I don't recommend this kind of trades, it's no good for Risk/Reward ratio. The best ratio is when the signal show up. Background color is more suitable using to hold your trades after entering.
Forex:
Bitcoin:
Altcoin:
MarketSpeed:
RSIC:

3 HULLs & ICHIMOKU divided by PRICEBasically just another form of moving average, for quick swings, built for testing/use with API cryptobots, simple switch from buy to sell.
Hull MA(2 candles back) times 3 plus Ichimoku divided by price(1 candle back) = value1
Hull MA(3 candles back) times 3 plus Ichimoku divided by price(1 candle back) = value2
if value1>value2 then buy else sell
calculates price from 1 candle back, and calculates signal from 2nd and 3rd candle prices, so no repainting? so best on low timeframes.
for when use in bot, would not need 1 candle lag. Lag is for TV chartists to not have to suffer repainting.
Bots do not repaint. they are not "painting" anything, they simply open or close orders, which cannot be "repainted"
but here on TV chart, when you refresh the browser page, the script recalculates, and signals may be repainted.
hopefully this will not repaint. please test. thankyou

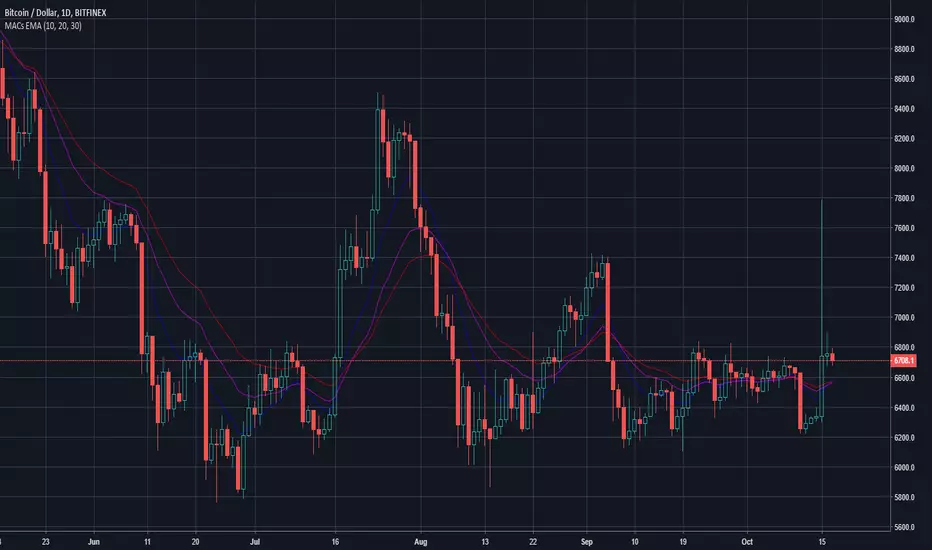
MACs EasyMoney - LongTermSignalsIntroducing " MACs EasyMoney - LongTermSignals " Indicator. Specially designed for weekly and 1 Month duration charts . Picks the calls perfectly :)
Latest other updates:
BOT Trading Integration is completed for the following indicators,
1) MACs EasyMoney - Swing Trade Signals
2) MACs EasyMoney - Scalp Trade Signals
Strategy Test Report for the BOT script shows the following results,
* Profitable Percent = 99.42%
* Profitable Factor = 93.76
Thanks,
Mac.
Pharoceus PT-V2 CryptoScalper RSI+BB+SRSI+Stochastic IndicatorThis is the updated Version of the ProfitTrailerV2 RSI+BB+StochRSI+Stochastic Oscillator Signal+Alerts
Description
This is an all-in-one indicator with alerts that most people call signals and it's designed for Cryptocurrency leverage trading. This indicator features, the most popularly used indicators in technical analysis and are the basic technical analysis indicators any successful trader should master before going into more advance technical analysis tools. The Pharoceus ProfitTrailerV2 CryptoScalper RSI+BB+SRSI+Stochastic Oscillator Signal+Alerts features the Bollinger Bands, Relative Strength Index, Stochastic RSI and Stochastic Oscillator, and it was designed for use with Pharoceus ProfitTrailerV2 CryptoScalper and can also be used with all other trading bots or on its own as a powerful market leveraging and trading indicator using alerts.
The ProfitTrailerV2 RSI+BB+SRSI+Stochastic Oscillator Signal+Alerts can be customized to any trader specific trading patterns and offers the ability to choose a combination of indicators from the featured ones to use. With the Buy and Sell Signal feature, trading on any cryptocurrency exchange can be automated and with the alerts feature, the Pharoceus ProfitTrailerV2 CryptoScalper RSI+BB+SRSI+Stochastic Oscillator Signal+Alerts will automated buying and selling signals for any crypto trading bot but I'll always recommend using for making buys only when using with any bot. This indicator/script can be used with any base pair; BTC, ETH, and USD or USDT.
As mentioned above, all four indicators can be combined to find a very safe and secure buy and profitable sell signals, which maximizes your profit margins and overall earnings over time. Also, 2 or 3 could be combined as well, depending on the traders knowledge on how to use each indicator independently to find its best settings. My recommendation would be to test all independently and or together with very little capital to find what works best for you. I recommend this because the cryptocurrency market in a very volatile market and unpredictable, some combination of indicators would work for some certain coin pairs and not all, while others would work better with a different setting and a particular coin pair.
As with all script use at your own risk and only trade what you can afford to lose, while this indicator isn't designed to lose you money and I will not be held liable for any losses due to misuse. I am also not a financial advisor and the ProfitTrailerV2 RSI+BB+SRSI+Stochastic Oscillator Signal+Alerts will be made available soon as it's still undergoing rigorous testing and it's in no way and manner affiliated with any group of individuals or bot.
Trade Smart and with only what you can afford. Donations are also welcome to encourage my work, This is a totally free to use script to help traders, small time or big time that works towards making the indicator sharing world accessible to all who will not definitely be ripped-off and support a community of sharing.
discord.gg
BTC: 199qMzu4gvr3bUXWEpLG5uS6TEKKvw5pbe
ETH: 0xf8339952a224a228f2f8c58a5666a8ffleddebfb
BCH: qqmmds8u3f8m6ek387jtefg07525dvaxzqrshd86gz

Ichimoku Cloud Strategy for CryptoVersion 1.0
This strategy uses the Ichimoku Cloud indicators and is based on a bot i developed. The bot has more entry/exit rules which will hopefully be added in the near future.
Still a profitable strategy even in it's simplest form.
Do not run this strategy on a timeframe < 1h, best timeframe will be 4h
Happy Trading!!
If you find this strategy useful, please consider a donation to:
BTC: 1PGuWcQwb4WZyFYX4ehyqcJWcbX42jW7Y6
ETH: 0x912aD30Ff9A49c69D51ECeE5A65A7E7d5321ED0C

ProfitTrailerV2 RSI+BB+SRSI+Stochastic Oscillator Signal+AlertsThis is an all-in-one indicator with alerts that most people call signals and it's designed for Cryptocurrency leverage trading. This indicator features, the most popularly used indicators in technical analysis and are the basic technical analysis indicators any successful trader should master before going into more advanced technical analysis tool. The ProfitTrailerV2 RSI+BB+SRSI+Stochastic Oscillator Signal+Alerts features the Bollinger Bands, Relative Strength Index, Stochastic RSI and Stochastic Oscillator, and it was designed for use with ProfitTrailer V2 and can also be used with all other trading bots or on its own as a powerful market leveraging and trading indicator using alerts.
The ProfitTrailerV2 RSI+BB+SRSI+Stochastic Oscillator Signal+Alerts can be customized to any trader specific trading patterns and offers the ability to choose a combination of indicators from the featured ones to use. With the Buy and Sell Signal feature, trading on any cryptocurrency exchange can be automated and with the alerts feature, the ProfitTrailerV2 RSI+BB+SRSI+Stochastic Oscillator Signal+Alerts will automated buying and selling signals for any crypto trading bot but I'll always recommend using for making buys only when using with any bot. This indicator/script can be used with any base pair; BTC, ETH, and USD or USDT.
As mentioned above, all four indicators can be combined to find a very safe and secure buy and profitable sell signals, which maximizes your profit margins and overall earnings over time. Also, 2 or 3 could be combined as well, depending on the traders knowledge on how to use each indicator independently to find its best settings. My recommendation would be to test all independently and or together with very little capital to find what works best for you. I recommend this because the cryptocurrency market in a very volatile market and unpredictable, some combination of indicators would work for some certain coin pairs and not all, while others would work better with a different setting and a particular coin pair.
As with all script use at your own risk and only trade what you can afford to lose, while this indicator isn't designed to lose you money and I will not be held liable for any losses due to misuse. I am also not a financial advisor and the ProfitTrailerV2 RSI+BB+SRSI+Stochastic Oscillator Signal+Alerts will be made available soon as it's still undergoing rigorous testing.

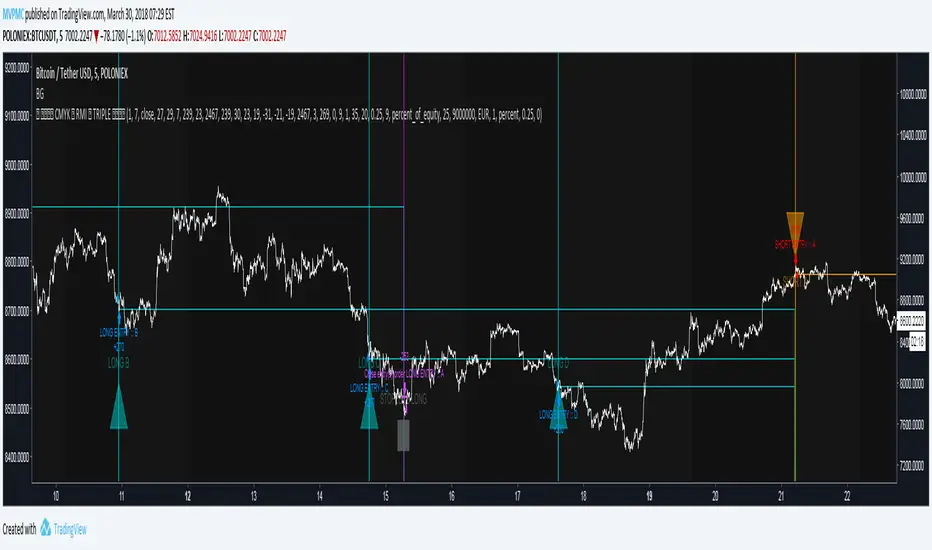
CMYK RMI TRIPLE Automated strategy▼ This is the strategy version of the script.
◊ Introduction
This script makes use of three RMI 's, that indicate Overbought/Oversold on different timescales that correspond with Frequency’s that move the market.
◊ Origin
The Relative Momentum Index was developed by Roger Altman and was introduced in his article in the February, 1993 issue of Technical Analysis of Stocks & Commodities magazine.
While RSI counts up and down ticks from close to close, the Relative Momentum Index counts up and down ticks from the close relative to a close x number of days ago.
This results in an RSI that is smoother, and has another setting for fine tuning results.
This bot originated out of Project XIAM , an investigative script that outlined my approach towards Automated Trading Strategies.
Are you interested in writing bots yourself ? check out the beta version of this script.
It has many bugs, but also most of the Skeleton.
◊ Usage
This script is intended for Automated Trading with AUTOVIEW or TVAUTOTRADER , on the 1 minute chart.
◊ Features Summary
Overlay Mode
Indicator Mode
Three RMI's
Trend adjustment
Pyramiding
Ignore first entries
Take Profit
Stop Loss
Interval between Entries
Multiring Fix
Alert signal Seperation
◊ Community
Wanna try this script out ? need help resolving a problem ?
CMYK :: discord.gg
AUTOVIEW :: discordapp.com
TRADINGVIEW UNOFFICIAL :: discord.gg
◊ Setting up Autoview Alerts
Use the study version of this script, To set up The Alerts Autoview Picks up on.
The Signals to work with are :
Open 1 Long
Use this to open one Long Position.
With quantity being : /
Once per bar
Being larger than 0
Comment example : e=exchange b=long q=amount t=market
Open 1 Short
Use this to open one Short Position.
With quantity being : /
Once per bar
Being larger than 0
Comment example : e=exchange b=short q=amount t=market
Close1 Position
Use this to Close The amount of one Open Position.
With quantity* being : /
Once per bar
Being larger than 0
Comment example : e=exchange c=position q=amount t=market
*Beware when using a percental % quantity, instead of an absolute quantity.
Percental Quantities are based on the , Not
And will change in absolute value relative to the amount of open trades.
Close All positions
Use this to Close All Open Positions.
With quantity being :
Once per bar
Being larger than 0
Comment example : e=exchange c=position t=market
For the specific Syntax used in the comment of the alert, visit Autoview .
◊ Setting up TVAutotrader
Use the strategy version of this script, And load it into TVAT .
◊ Backtesting
Use the strategy version of this script for backtesting.
◊ Contact
Wanna try this script out ? need help resolving a problem ?
CMYK :: discord.gg
PT Magic Triggers So its me again. I have decided to create Trend Trigger Script for PT Magic addon for a trading bot Profit Trailer. If you do not own this bot and Addon the following explanation will not help you.
For each Trend you define number of minutes and it then calculates the percentage change between the close price now and X candles before.
Same calculation is for all 6 Triggers i beleive that is all you need :)
Hope it helps you all.
LTC: LYHj4WDN7BPu5294cSpqK3SgWSWdDX56Qt
BTC: 1NPVzeDSsenaCS9QdPro877hkMk93nRLcD

MACD, backtest 2015+ only, cut in half and doubledThis is only a slight modification to the existing "MACD Strategy" strategy plugin!
found the default MACD strategy to be lacking, although impressive for its simplicity. I added "year>2014" to the IF buy/sell conditions so it will only backtest from 2015 and beyond ** .
I also had a problem with the standard MACD trading late, per se. To that end I modified the inputs for fast/slow/signal to double. Example: my defaults are 10, 21, 10 so I put 20, 42, 20 in. This has the effect of making a 30min interval the same as 1 hour at 10,21,10. So if you want to backtest at 4hr, you would set your time interval to 2hr on the main chart. This is a handy way to make shorter time periods more useful even regardless of strategy/testing, since you can view 15min with alot less noise but a better response.
Used on BTCCNY OKcoin, with the chart set at 45 min (so really 90min in the strategy) this gave me a percent profitable of 42% and a profit factor of 1.998 on 189 trades.
Personally, I like to set the length/signals to 30,63,30. Meaning you need to triple the time, it allows for much better use of shorter time periods and the backtests are remarkably profitable. (i.e. 15min chart view = 45min on script, 30min= 1.5hr on script)
** If you want more specific time periods you need to try plugging in different bar values: replace "year" with "n" and "2014" with "5500". The bars are based on unix time I believe so you will need to play around with the number for n, with n being the numbers of bars.

Blue Chip Strategy V5V5 Long-Term Swing Strategy (4H / Daily Trend)
This strategy is designed for traders who want consistent, rules-based swing trades without staring at screens all day. V5 focuses on high-quality long-term setups by combining:
-Higher-timeframe trend alignment
-Structured pullback entries
-Volatility confirmation
-ATR-based risk management
The goal is simple: participate in institutional trends, not noise. How the strategy works:
-Trades are taken on the 4-hour chart
-Overall bias is guided by the Daily trend
-Entries occur only after controlled pullbacks, not breakouts
-Risk is defined at entry using ATR-based stops
-Winners are allowed to run, losers are cut quickly
This creates fewer trades — but higher quality ones.
What this strategy is NOT
❌ Not a scalping system
❌ Not a high-frequency bot
❌ Not news- or hype-driven
❌ Not designed for crypto or penny stocks
V5 is built for US large-cap stocks with clean structure and institutional liquidity.

Valdes Trading Bots PRO Trend Engine EMA50 ATRThis script implements a short-term, trend-aligned strategy designed for execution on the 1-minute (1M) chart, with the objective of participating in directional moves while reducing exposure during unfavorable conditions.
Entry Logic
Trade entries are evaluated using a combination of price structure, volatility, and momentum context. Price must establish itself on the appropriate side of a primary moving average, indicating directional bias on the execution timeframe. Volatility conditions, derived from the Average True Range (ATR), are used to confirm that price has moved sufficiently away from equilibrium before an entry is considered. This helps reduce participation during low-volatility or congested market phases.
A higher-timeframe (HTF) trend reference is incorporated to provide broader directional context. Entries are filtered so that lower-timeframe participation remains aligned with the prevailing higher-timeframe direction. An RSI-based momentum filter is applied to help avoid entries during overstretched or indecisive conditions.
Additional internal filters are used to reduce entries during transitional or low-quality environments, though their specific thresholds are intentionally abstracted.
Exit Logic
The strategy does not rely on fixed take-profit targets. Instead, exits are managed using a trailing stop mechanism that becomes active only after price has moved favorably beyond an initial threshold. The trailing stop dynamically adjusts as price continues to move in the trade’s favor, allowing positions to remain open during sustained momentum while responding to adverse movement.
This adaptive exit structure is designed to balance trade extension with risk containment, particularly in fast-moving, short-term market conditions.
Timeframe Usage
This strategy is intended for use on the 1-minute chart only. The higher-timeframe input is used strictly for contextual filtering and does not generate independent signals. Applying the script to other timeframes may materially change its behavior.
Visual output is intentionally minimal. Optional EMA overlays can be toggled for reference, and a compact on-chart information panel provides high-level status visibility while remaining readable on mobile devices.
Important Notes
• Designed for use on the 1-minute chart
• ATR is used for volatility-aware entry and exit behavior
• RSI is used as a momentum and condition filter
• Trailing exits are adaptive rather than fixed
Disclaimer
This script is provided for educational and research purposes only and does not constitute financial, investment, or trading advice. Trading involves risk, and outcomes may vary depending on market conditions and instruments. Users are solely responsible for their own decisions and should thoroughly test and understand any strategy before using it in live markets.

AI Smart Money Profile v4.6
# 🕉️ AI Smart Money Profile v4.6
**by Shiv Shakti Algo Systems**
AI Smart Money Profile v4.6 is a **professional all-in-one trading indicator** designed to combine **Smart Money Concepts (SMC)**, **Market Profile**, **ICT concepts**, and **AI-based trend confirmation** into a single, powerful system.
This indicator is built for traders who want **structure-based trading**, **high-confluence setups**, and **clear visual guidance** without chart clutter.
---
## 🔥 Key Features
### 📊 Market Profile
* Daily / Weekly / Monthly Market Profile
* **POC (Point of Control)**, **VAH (Value Area High)**, **VAL (Value Area Low)**
* Historical & Live Value Areas
* Session bias visualization
### 🎯 Smart Money Concepts (SMC)
* **BOS (Break of Structure)**
* **ChoCH (Change of Character)**
* Liquidity Sweeps (Buy-side & Sell-side)
* Equal Highs & Equal Lows detection
### 📦 Volume Order Blocks
* Volume-based Bullish & Bearish Order Blocks
* Wick / Close mitigation options
* Automatic removal of mitigated blocks
### ⚡ Fair Value Gaps (FVG)
* Bullish & Bearish FVG detection
* Auto-removal after fill or expiry
* Adjustable minimum FVG size
### 🎓 ICT Concepts
* **OTE (Optimal Trade Entry) Zones**
* Structure-aligned premium & discount logic
### 🤖 Smart Trend AI (NEW in v4.6)
* Fusion of **UT Bot + Supertrend**
* Signals only when **both indicators agree**
* Confirmed BUY / SELL labels (non-repainting)
* Full candle coloring (body + wick)
### 📈 EMA Trend System
* EMA 20 / 50 / 200
* Golden Cross & Death Cross signals
* EMA trend direction shown in dashboard
### 💧 Liquidity Zones
* Buy-Side Liquidity (BSL)
* Sell-Side Liquidity (SSL)
* Auto-detection and sweep tracking
### 📊 RSI Momentum
* Positive & Negative momentum labels
* Trend-aligned RSI filtering
### 🕯️ Candlestick Patterns
* Marubozu (Bullish / Bearish)
* Engulfing patterns
* ATR-based label positioning
### 🎯 6-Point Confluence Signal Engine
Signals are generated using:
1. Market Profile position
2. Market Structure (SMC)
3. Order Block presence
4. Fair Value Gap
5. OTE Zone
6. Liquidity Sweep
Only **high-probability, multi-confirmation setups** are highlighted.
### 📊 Smart Dashboard
* Market Structure bias
* Trend direction
* Confluence scores
* OB, FVG, OTE, Liquidity & AI trend status
* Clean and professional UI
---
## 🧠 HOW TO USE (STEP-BY-STEP)
### 1️⃣ Determine Market Bias (Top-Down)
* Check **Market Structure (SMC)**:
* Bullish = Higher Highs & Higher Lows
* Bearish = Lower Highs & Lower Lows
* Use **EMA 20 / 50 / 200** alignment:
* EMA20 > EMA50 > EMA200 → Bullish bias
* EMA20 < EMA50 < EMA200 → Bearish bias
* Confirm bias using **Smart Trend AI** (Green = Bullish, Red = Bearish)
---
### 2️⃣ Identify High-Probability Zones
Look for price interaction with:
* **Value Area (VAH / VAL / POC)**
* **Volume Order Blocks**
* **Fair Value Gaps (FVG)**
* **OTE Zones**
* **Liquidity Levels (BSL / SSL)**
👉 Best trades happen when **multiple zones overlap**.
---
### 3️⃣ Wait for Liquidity & Structure Confirmation
* Price sweeps **liquidity** (BSL or SSL)
* Market prints **BOS or ChoCH**
* Confirms direction with bullish or bearish candle
This avoids early or emotional entries.
---
### 4️⃣ Confirm with AI & Momentum
* **Smart Trend AI** must agree with trade direction
* **RSI Momentum**:
* Positive = bullish strength
* Negative = bearish strength
* Avoid trades when AI shows “MIX” or RSI is neutral
---
### 5️⃣ Enter Trade
* Use **BUY / SELL labels** only when:
* Confluence score ≥ minimum setting
* Candle closes with structure confirmation
* Entry can be taken:
* At candle close, or
* On pullback into OB / FVG
---
### 6️⃣ Risk Management (Very Important)
* Always use **Stop Loss**:
* Below swing low (BUY)
* Above swing high (SELL)
* Risk only **1–2% per trade**
* Targets:
* Previous high/low
* Liquidity levels
* Opposite Value Area
---
## ⚙️ Recommended Settings
* Timeframes: **5m, 15m, 30m, 1H**
* Works best on:
* Indices
* Forex
* Crypto
* Enable **ATR filter** for volatile markets
---
## ⚠️ DISCLAIMER (IMPORTANT)
⚠️ **DISCLAIMER:**
This indicator is provided for **educational and informational purposes only**.
It does **NOT** constitute financial advice, investment advice, or trading recommendations.
Trading in financial markets involves **substantial risk**, and you may lose part or all of your capital.
Past performance is **not indicative of future results**.
The creator of this indicator is **not responsible for any losses** resulting from the use of this tool.
Always:
* Apply proper risk management
* Test strategies on demo or paper trading
* Seek professional financial advice if required
**You are solely responsible for your trading decisions.**
---
## 🙏 JAI SHIV SHAKTI 🙏
**Trade Smart. Trade Disciplined.**

WaveTrend & RSI Combined (v-final)# RSI Divergence + WaveTrend Combined
## Overview
This indicator combines RSI Divergence detection with WaveTrend crosses to generate high-probability trading signals. It filters out noise by only showing divergences when confirmed by WaveTrend momentum crosses in the same direction.
## Key Features
### 1. Smart Divergence Detection
- Detects both bullish and bearish RSI divergences
- Uses **price pivot validation** to ensure divergences start from significant chart highs/lows, not just RSI extremes
- Divergence endpoints must be in the **neutral zone (20-80)** to avoid overbought/oversold traps
### 2. WaveTrend Cross Confirmation
- **Golden Cross**: WaveTrend crossover in oversold territory (below -60)
- **Dead Cross**: WaveTrend crossover in overbought territory (above +60)
- Crosses are displayed at RSI 20 (golden) and RSI 80 (dead) levels for easy visualization
### 3. Combined Signal Logic
- **LONG Signal**: Bullish RSI Divergence + Golden Cross within the divergence period
- **SHORT Signal**: Bearish RSI Divergence + Dead Cross within the divergence period
- Divergences are **only displayed** when a matching cross exists in the same period
### 4. Visual Elements
- **Yellow lines**: Divergence connections between master point and current point
- **Small diamonds**: Divergence markers (green for bullish, red for bearish)
- **Triangles**: Confirmed entry signals (▲ for LONG, ▼ for SHORT)
- **Circles**: WaveTrend crosses (green at bottom for golden, red at top for dead)
- **Background color**: Highlights signal bars (green for LONG, red for SHORT)
- **Debug table**: Shows real-time RSI, divergence count, WaveTrend values, and cross status
## Settings
### RSI Divergence
- RSI Length (default: 14)
- Overbuy/Oversell levels
- Divergence detection parameters (loopback, confirmation, limits)
### WaveTrend
- Channel Length (default: 10)
- Average Length (default: 21)
- Overbought/Oversold levels
- Cross Detection Level (default: 60)
### Pivot Detection
- Pivot Left/Right Bars (default: 5) - Controls sensitivity for price pivot validation
## How to Use
1. **Wait for signal**: Look for the triangle markers (▲/▼) with background color
2. **Confirm with crosses**: Ensure the corresponding WaveTrend cross (circle) is visible
3. **Check divergence line**: The yellow line should connect meaningful price pivots
## Alerts
- Built-in alert conditions for both LONG and SHORT signals
- Webhook-ready format for automation (Telegram, Discord, auto-trading bots)
## Best Practices
- Works well on higher timeframes (1H, 4H, Daily)
- Combine with support/resistance levels for better entries
- Use proper risk management - not every signal is a winner
## Credits
- RSI Divergence logic inspired by K-zax
- WaveTrend calculation based on LazyBear's implementation
- Combined and enhanced by sondengs
---
*This indicator is for educational purposes only. Always do your own research and manage your risk appropriately.*

Mine Shaft + Drift + Ore Pocket Detector (Gap+Touch)Mine Shaft + Drift + Ore Pocket Detector (Gap+Touch) — Full Description (v1.6.1, Pine v6)
*Experimental - *Test Phase*
1) What this indicator is intended to do
This indicator attempts to algorithmically discover “mine shaft” price structure on a chart by:
Collecting structural anchor points (gaps and optionally pivots),
Generating candidate trend “rails” (centerline + parallel upper/lower borders) from pairs of anchors,
Fitting an optimal channel width around each candidate centerline,
Scoring candidates based on how well price action conforms to the channel (touches + containment),
Selecting and rendering:
the main shaft channel (primary),
additional drifts (secondary shafts per direction),
And then detecting Ore Pockets: time locations where multiple selected lines intersect (time confluence / intersection clustering).
The conceptual model is:
A shaft = a best-fit channel that price respects over time (the “main tunnel”).
Drifts = alternate channels close in quality to the main shaft (secondary tunnels).
Ore pockets = future/past time coordinates where multiple channels’ centerlines intersect densely (confluence in time, not necessarily in price).
2) What it is doing right now (current behavior)
In its current form, the script does a bounded, performance-limited scan:
It stores a limited number of anchor points in arrays.
It only considers a bounded number of recent anchors per direction.
It constructs candidate lines from anchor pairs and evaluates channel fitness using sampled bars.
On the last bar, it selects top candidates per direction and draws:
a “main” channel per mode (single best overall, or separate up/down),
plus optional drift channels,
plus ore pocket markers.
It is producing meaningful channels and drifts, but it is currently more likely to lock onto a strong “local” shaft than the one macro shaft spanning the entire market structure.
3) Core mechanics (how the script finds shafts)
3.1 Anchor generation (what points it uses)
Anchors are the “support points” used to build candidate shaft centerlines.
Two anchor families are supported:
A) Gap anchors (from your selected gap mode)
These attempt to capture “displacement events” and their boundaries/mids.
B) Pivot anchors (optional structural anchors)
These use pivots to inject macro structure points that are not strictly gap-based.
All anchors are stored as:
anchorX: bar_index of anchor
anchorY: price of anchor
anchorD: direction flag (+1 for up, -1 for down)
Anchors are capped by maxAnchors with FIFO trimming.
3.2 Candidate generation (how it produces centerlines)
For each direction (+1 and -1):
Collect “recent” anchors of that direction within lookbackBars (bounded to maxDirAnchors).
For each pair of anchors (x1,y1) and (x2,y2) that satisfy:
spacing within ,
slope sign consistent with direction,
Construct the line equation:
slope m and intercept b
Fit a channel width w around that line (via width mode).
Score it (touches + inside count minus width penalty).
Keep the top K rails (K = driftCount+1 typically).
3.3 Scoring model (what “best” means right now)
For a candidate centerline:
At sampled bars (stride sampling), compute:
channel top = y(x) + w
channel bot = y(x) - w
Evaluate:
Inside: candle range fits within the channel ± tolerance
Touches: high near top border, low near bottom border (within tolerance)
Score formula:
score = insideCount * insideWeight
+ touchCount * touchWeight
- (w / ATR) * widthPenalty
So:
Higher inside and touch counts increase score
Wider channels are penalized (in ATR units) to avoid “cheating” via enormous width
3.4 Width fitting (how the channel thickness is chosen)
Width is either:
Fit (scan widths): scans widths between a min width and a max deviation cap and selects the best scoring width.
Fixed ATR Envelope: uses a fixed width derived from ATR (currently hard-coded to a 2.0 ATR envelope in your present draft).
Fixed Max Deviation: width is max observed deviation from line in sampled window.
This matters because “macro shaft” detection is strongly influenced by whether the width-fitting is allowed to expand enough to contain large historical moves, without being penalized into losing to a smaller local shaft.
3.5 Rendering (what gets drawn)
For any selected rail, it draws:
Upper border line (top rail)
Lower border line (bottom rail)
Optional centerline (main only)
Optional fill between borders (main only)
Label at current bar with touches and inside count
Drifts render similarly but without main-only features (depending on flags).
3.6 Ore Pocket detection (time confluence)
Ore pockets are not “price zones” directly.
They are computed as follows:
Collect selected centerlines (m,b) for:
the main selected shaft(s),
and all drift centerlines (both directions if present)
For each pair of selected lines, compute intersection x-coordinate:
x* = (b2 - b1) / (m1 - m2)
Only keep intersections within:
Cluster intersections by time proximity (clusterBars)
Mark the strongest clusters (highest counts) as “Ore Pocket” vertical dotted lines with labels.
Interpretation:
A dense cluster indicates many selected rails converge around a similar time coordinate.
It is a “time confluence” hypothesis point.
4) Full settings reference (what each setting is for)
01) Gap Anchors
Gap Mode
FVG (3-candle)
Uses a classic 3-candle fair value gap pattern:
Up gap if low > high
Down gap if high < low
Anchors are derived from the gap boundaries.
Candle Gap (open-close)
Gap based on open vs close of the same bar with a tick threshold.
Candle Gap (open-prev close)
Gap based on open vs close with a tick threshold.
Gap Threshold (ticks)
Only used for the candle gap modes.
Controls the minimum gap size required to register an anchor.
Anchor Price
Boundary: anchors at one gap boundary (more “structural edge”)
Mid: anchors at midpoint of the gap (more “center of displacement”)
Include Pivot Anchors (structure)
When enabled, adds pivots as additional anchors to stabilize macro detection.
Pivot Length
Pivot sensitivity (how many bars left/right define a pivot).
Larger values = fewer, more structural pivots.
02) Channel Fit + Touch Scoring
Lookback Bars
The historical window used to:
filter which anchors are considered “recent enough”
evaluate channel fitness (sampled evaluation)
Larger lookback tends to favor macro shafts, but also increases computational risk (mitigated by evalBars and stride).
ATR Length
ATR period used for tolerance and width penalty scaling.
Tolerance (ATR mult)
Defines how close price must be to a rail to count as “touch” and how strict the “inside channel” containment is.
Higher tolerance = easier to score high on touch/inside.
Min Border Touches (keep rail)
Minimum number of border touches required before a candidate is even eligible.
Score: Inside Weight
Weight of inside count in score.
Score: Border Touch Weight
Weight of border touches in score.
This is a strong driver of “shaft-like” behavior.
Score: Width Penalty (in ATRs)
Penalizes wide channels relative to ATR.
Higher penalty biases toward narrow/local shafts.
03) Performance Controls
Max Stored Anchors (global)
Maximum anchor points kept in memory arrays.
Too low can cause loss of macro structure; too high increases candidate noise.
Max Anchors / Direction (scan)
Hard cap on how many anchors are used in candidate generation per direction.
Critical: this strongly influences whether macro shaft can be found, because if you only keep the most recent anchors, you lose the early-structure anchor points.
Eval Bars (max)
Maximum historical bars actually evaluated for scoring.
Even if lookbackBars is large, evaluation is capped here.
Eval Stride (sample every N bars)
Sampling step for evaluation.
Larger stride = faster but less accurate scoring.
04) Candidate Generation
Min Anchor Spacing (bars)
Minimum distance between the two anchors used to define a candidate line.
Prevents micro-noise lines from being evaluated.
Max Anchor Spacing (bars)
Maximum distance between the two anchors used to define a candidate line.
If this is too low, you cannot generate truly macro candidate lines.
05) Shaft + Drift Display
Main Shaft Mode
Best Overall (Single Shaft): chooses one best rail among Up/Down and draws it as main.
Up Only: show only the best upward rail.
Down Only: show only the best downward rail.
Up + Down: show both main up rail and main down rail simultaneously.
Show Ascending Shaft
Toggles rendering for the “up” main shaft (when mode allows it).
Show Descending Shaft
Toggles rendering for the “down” main shaft (when mode allows it).
Drifts per Direction
Number of additional top-ranked rails to draw per direction (after the best one).
Extend Lines
Right: extend lines to the right only.
Both: extend both left and right.
Fill Main Shaft Channel
Fill between upper and lower borders for main shaft.
Main Shaft Fill Transparency
Transparency level for main fill.
Show Main Shaft Centerline
Draw the dashed centerline for the main shaft.
06) Ore Pocket (Intersection-Time Confluence)
Show Ore Pockets (Time Confluence)
Enables ore pocket discovery and rendering.
Intersection Window Forward (bars)
How far into the future intersections are considered.
Intersection Window Backward (bars)
How far into the past intersections are considered.
Cluster Radius (bars)
How close in time intersections must be to merge into a cluster.
Min Intersections per Cluster
Minimum cluster count required before a pocket is shown.
Max Pocket Markers
Limit how many pocket clusters are drawn.
07) Visual Controls
Show Gap Anchors
Displays the gap anchor dots for debugging.
Show Pivot Anchors
Displays pivot anchor dots for debugging.
5) How to use it (practical workflow)
Step A — Confirm anchor behavior
Turn on Show Gap Anchors.
Choose your Gap Mode.
Verify you are seeing anchors where you expect (displacement boundaries).
If anchors are sparse:
Reduce gap threshold (ticks) for candle-gap modes
Enable pivots to inject structure
Increase lookbackBars and maxAnchors so early anchors are not dropped
Step B — Get stable main shaft candidate discovery
Enable Include Pivot Anchors with a medium pivotLen.
Use Fit (scan widths) initially.
Increase Max Anchors / Direction (scan) so you’re not only using recent anchors.
Increase Max Anchor Spacing so macro pairs are eligible.
If you keep getting only local shafts:
That is usually because the candidate pool does not include enough old anchors, or the maxSpacing prevents long-span lines.
Step C — Tune scoring so the “whole-structure” shaft wins
If the script picks a small local channel instead of the macro channel:
Increase insideWeight relative to touchWeight (macro channels tend to contain longer structure even with fewer perfect “touches”)
Reduce widthPenalty, because macro channels may need to be wider to accommodate historical volatility
Increase lookbackBars and evalBars to make “whole-structure fit” matter
Step D — Drifts as secondary shafts
Once main shaft is good:
Increase Drifts per Direction
Validate that drifts represent meaningful alternate sub-shafts rather than noisy duplicates.
If drifts look too similar:
This is expected if many candidates differ only slightly; future refinements should diversify drift selection (see “what still needs done”).
Step E — Ore pockets interpretation
Ore pockets indicate time confluence of multiple rails.
Use them as:
“Time windows to watch”
Not as deterministic price levels
Tune:
clusterBars (cluster tightness)
minClusterSize (signal strength)
6) What still needs done (explicit backlog)
The macro “main mining shaft channel” spanning the entire market structure, and
Smaller shafts/drifts nested inside the macro structure.
To accomplish that, the current algorithm needs additional architecture. Concretely:
A) True multi-scale / hierarchical discovery (primary missing feature)
Right now: one pass, one lookback, one score objective.
Still Needed:
Macro pass: discover a primary shaft using a very long evaluation window and anchor set.
Micro pass(es): discover drifts/secondary shafts using:
residuals (distance from macro centerline),
or segmented time windows (regime partitions),
or anchor subsets constrained to local regions.
This is the single biggest reason we are not consistently getting the full-structure shaft.
B) Anchor retention strategy for macro detection
Right now:
anchors are FIFO capped and direction scanning uses “recent anchors only.”
To reliably find 10-year shafts we need:
an option to store/retain representative anchors across the entire history, not only the most recent ones.
Examples of necessary improvements:
“Stratified anchor sampling” across time (keep some old anchors even when maxAnchors is hit)
“Macro anchor bank” (separate storage for pivots or major gaps)
C) Candidate generation constraints must support macro lines
If we want a shaft spanning the whole structure:
maxSpacing must allow it
the candidate pool must contain anchors far apart in time
So the algorithm needs:
better selection of anchor pairs for long-span candidates (e.g., include earliest/oldest anchors + newest anchors deliberately, not accidentally)
D) Drift diversification
Right now drifts are “next best by score,” which often yields near-duplicates.
We want:
“diverse” secondary shafts:
enforce minimum angular difference,
enforce minimum offset difference,
or penalize candidates too similar to the already-selected shaft.
E) Width fitting logic for macro channels
Macro channels often require:
either a higher width cap,
or a different penalty profile.
Current width penalty is simple and can bias against macro channels.
Needed:
width penalty that scales by timescale or by total evaluated bars,
or separate macro/micro scoring.
F) Ore pocket semantics enhancement (optional but aligned)
Currently pockets are time intersections only.
If you want “pocket zones,” improvements could include:
projecting intersection price and drawing a zone box,
clustering in (time, price) space instead of only time,
adding “importance” weighting based on which lines intersect (macro line intersections weighted higher).
7) Known limitations (current version)
Heavy compute only runs on last bar (good for performance), but means:
changes in anchors/parameters can reselect rails abruptly
Candidate set is bounded; macro shaft can be missed if not in pool
Drift selection can be redundant
Ore pockets are time clusters, not price clusters

1-Min Gold Taylor Technique# 🟡 1-Minute Gold Taylor Trading Technique - Professional Strategy
## 📊 OVERVIEW
The **1-Minute Gold Taylor Trading Technique** is a sophisticated intraday scalping strategy specifically designed for XAUUSD (Gold) on the 1-minute timeframe. This strategy implements George Douglas Taylor's classic 3-Day Trading Cycle adapted for modern algorithmic trading with precise entry and exit rules.
**Best For:** Gold traders, scalpers, and intraday momentum traders
**Timeframe:** 1-minute (optimal), can work on 3-5 minute
**Instrument:** XAUUSD, GC futures
**Trading Sessions:** London and New York sessions (GMT-based)
---
## 🎯 STRATEGY CONCEPT
### Taylor's 3-Day Cycle (Modernized)
This strategy identifies and trades three distinct market phases:
1. **Accumulation Day** - Range-bound consolidation where smart money accumulates positions
2. **Manipulation Day** - Liquidity sweeps and stop-hunts creating high-probability reversal setups
3. **Distribution Day** - Trending continuation where positions are distributed
The strategy automatically detects these phases through price action and provides clear entry signals during the highest-probability setups.
---
## 🔧 KEY FEATURES
### ✅ Automated Session Tracking
- **Asian Session** (00:00-05:00 GMT) - Range identification only, no trades
- **London Session** (06:00-13:00 GMT) - Primary trading window for manipulation setups
- **NY Session** (13:00-17:00 GMT) - Continuation and distribution trades
### ✅ Liquidity Sweep Detection
- Identifies sweeps of Asian High/Low
- Detects Previous Day High/Low violations
- Configurable sweep buffer to filter noise
- Visual confirmation on chart
### ✅ Multi-Indicator Confirmation
- **VWAP** - Session-based volume-weighted average price
- **20 EMA** - Dynamic support/resistance confirmation
- **SuperTrend** - Trend direction and reversal signals (dot indicators)
- **ATR-based** - Adaptive to volatility
### ✅ Professional Risk Management
- 3-tier profit taking system (33% / 33% / 34% position splits)
- Configurable Risk:Reward ratio (default 1:3)
- Adaptive stop-loss based on volatility
- Automatic end-of-day position closure
- No pyramiding (one position at a time)
### ✅ Visual Trading Environment
- **Asian Range Box** - Yellow box showing consolidation zone
- **Session Backgrounds** - Color-coded trading sessions
- **Previous Day Levels** - High/Low reference lines
- **Entry Signals** - Clear green (long) and red (short) markers
- **SuperTrend Dots** - Visual trend confirmation
---
## 📈 ENTRY RULES
### 🟢 LONG ENTRY (All Conditions Required)
1. **Liquidity Sweep** - Price sweeps below Asian Low OR Previous Day Low
2. **Rejection** - Candle forms lower wick and closes back above the level
3. **Trend Confirmation** - SuperTrend flips bullish (green dot appears below price)
4. **VWAP/EMA Reclaim** - Price closes above VWAP or 20 EMA
5. **Session Timing** - Must be during London or NY session
6. **Automated Signal** - Green triangle appears below candle
### 🔴 SHORT ENTRY (Mirror Logic)
1. **Liquidity Sweep** - Price sweeps above Asian High OR Previous Day High
2. **Rejection** - Candle forms upper wick and closes back below the level
3. **Trend Confirmation** - SuperTrend flips bearish (red dot appears above price)
4. **VWAP/EMA Reject** - Price closes below VWAP or 20 EMA
5. **Session Timing** - Must be during London or NY session
6. **Automated Signal** - Red triangle appears above candle
---
## 💰 EXIT STRATEGY
### 3-Tier Profit System
**TP1 (33% of position):**
- Target: 1:1 Risk:Reward
- Typically at VWAP or Asian range midpoint
- Secures base profit
**TP2 (33% of position):**
- Target: 1:2 Risk:Reward
- Typically at Asian range opposite boundary
- Locks in substantial gain
**TP3 (34% of position - Runner):**
- Target: 1:3 Risk:Reward (default)
- Typically at Previous Day High/Low or beyond
- Maximizes winners
### Stop Loss
- Fixed points below/above entry (default: 6 points)
- Can be adjusted based on ATR for volatility adaptation
- Tight enough for 1-minute scalping, wide enough to avoid noise
### End-of-Day Close
- All positions automatically closed at 17:00 GMT
- No overnight risk
- Clean slate for next trading day
---
## ⚙️ CUSTOMIZABLE PARAMETERS
### Risk Management
- **Risk:Reward Ratio** (1.0 - 10.0) - Default: 3.0
- **Stop Loss Points** (1.0 - 20.0) - Default: 6.0
- **Trailing Stop** - Optional for trend days
### Session Times (Adjustable for Your Timezone)
- Asian Start/End
- London Start
- NY Start/End
- Fully customizable to match your broker's daily close
### Indicators
- **ATR Length** - Default: 14
- **ATR Multiplier** - Default: 2.0 (SuperTrend sensitivity)
- **EMA Length** - Default: 20
- **Sweep Buffer** - Default: 2.0 points (filters false sweeps)
### Visuals (Toggle On/Off)
- Asian Range Box
- VWAP Line
- 20 EMA Line
- Previous Day Levels
- Session Background Colors
---
## 📊 PERFORMANCE EXPECTATIONS
### Realistic Statistics
- **Win Rate:** 40-60% (varies by market condition)
- **Average R:R:** 1:2.5 to 1:3.5 (with partial profits)
- **Trades Per Day:** 1-4 high-quality setups
- **Best Performance:** During manipulation days (sweeps + reversals)
### Ideal Market Conditions
✅ Medium to high volatility (ATR > 1.0)
✅ Clear trending sessions
✅ Strong liquidity sweeps
✅ Clean support/resistance at Asian range
### Challenging Conditions
⚠️ Very low volatility (ATR < 0.5)
⚠️ Major news events (NFP, FOMC)
⚠️ Extreme ranging days with no sweeps
⚠️ Asian session overlap confusion
---
## 🎓 HOW TO USE
### Setup
1. Add strategy to **1-minute XAUUSD chart**
2. Adjust session times to match your timezone/broker
3. Start with default settings
4. Enable alerts for entry signals
### Trading Workflow
1. **Pre-Market:** Identify Asian range when it forms
2. **London Open:** Watch for sweeps of Asian high/low
3. **Wait for Signal:** All 4-5 conditions must align (automatic)
4. **Enter on Signal:** Green/red triangle appears
5. **Let Strategy Manage:** Automatic TP1, TP2, TP3 exits
6. **Review Daily:** Journal which day type occurred
### Optimization
- Backtest on 3+ months of data
- Adjust stop loss based on recent ATR
- Fine-tune sweep buffer for your trading style
- Test different R:R ratios for your risk tolerance
---
## 🚨 ALERTS INCLUDED
The strategy includes 4 alert types:
1. **Long Entry Signal** - All conditions met for buy
2. **Short Entry Signal** - All conditions met for sell
3. **Bullish Sweep Detected** - Asian/PDL swept, prepare for long
4. **Bearish Sweep Detected** - Asian/PDH swept, prepare for short
Set up alerts to receive notifications via:
- TradingView mobile app
- Email
- SMS (via webhook)
- Discord/Telegram (via webhook)
---
## ⚡ UNIQUE ADVANTAGES
### Why This Strategy Stands Out
1. **Session-Aware Logic** - Trades only during optimal liquidity windows
2. **Institutional Approach** - Based on liquidity sweeps and order flow concepts
3. **Risk-Conscious** - 3-tier exits ensure you capture profits while letting winners run
4. **Clean Visuals** - Everything you need on the chart, nothing you don't
5. **No Repainting** - All calculations are based on closed candles
6. **Fully Automated** - Once configured, strategy handles entries and exits
### Gold-Specific Optimizations
- Designed specifically for Gold's unique volatility patterns
- Session times optimized for XAUUSD trading hours
- Stop loss and targets calibrated for typical Gold 1-min movements
- Sweep detection tuned to Gold's tendency for liquidity grabs
---
## 📖 STRATEGY LOGIC (For Developers)
### Technical Implementation
- **Language:** Pine Script v6
- **Type:** Strategy (not just indicator)
- **Calculation:** On bar close (no repainting)
- **Lookback:** Minimal (efficient on 1-minute data)
### Key Components
```
1. Session Detection → Hour-based GMT logic
2. Asian Range → var float tracking daily high/low
3. Sweep Detection → Price breach + reversal confirmation
4. SuperTrend → ATR-based trend filter
5. Entry Logic → Boolean combination of all conditions
6. Exit Management → strategy.exit() with multiple targets
```
---
## ⚠️ IMPORTANT DISCLAIMERS
### Risk Warning
- This strategy is for **educational purposes**
- **Past performance does not guarantee future results**
- Trading Gold on 1-minute timeframe is **high risk**
- Always use proper risk management (1-2% per trade max)
- Test thoroughly on **paper trading** before live implementation
### Recommended Prerequisites
- Understanding of support/resistance
- Familiarity with session-based trading
- Knowledge of liquidity concepts
- Experience with 1-minute scalping
- Proper broker with tight spreads on Gold
### Not Recommended For
- Complete beginners to trading
- Accounts under $1,000
- Traders unable to monitor during London/NY sessions
- High-spread brokers
- Emotional/impulsive traders
---
## 🔄 VERSION HISTORY
**v1.0** (Current)
- Initial release
- Core Taylor 3-Day Cycle implementation
- Asian range tracking
- Liquidity sweep detection
- 3-tier exit system
- Full visual suite
- Alert integration
---
## 💡 TIPS FOR SUCCESS
### Best Practices
1. **Trade the manipulation days** - Highest win rate on sweep-and-reverse setups
2. **Respect the session times** - Don't force trades outside London/NY
3. **Journal your trades** - Note which day type (Accumulation/Manipulation/Distribution)
4. **Scale position size** - Bigger on high-conviction setups
5. **Monitor ATR** - Adjust stop loss on volatile days
### Common Mistakes to Avoid
❌ Trading during Asian session
❌ Entering without all 5 conditions met
❌ Moving stops closer "to protect profit"
❌ Removing the partial profit system
❌ Over-trading on range days
❌ Ignoring the session backgrounds
---
## 📞 SUPPORT & FEEDBACK
### How to Provide Feedback
- Use TradingView's comment section below
- Report bugs with chart screenshots
- Share your optimization results
- Suggest improvements
### Future Updates May Include
- Multi-timeframe confirmation option
- Volume profile integration
- Machine learning day-type classifier
- Advanced trailing stop algorithms
- Telegram bot integration
---
## 🏆 CONCLUSION
The **1-Minute Gold Taylor Trading Technique** brings together classical market theory and modern algorithmic execution. By focusing on institutional liquidity sweeps during optimal trading sessions, this strategy provides a systematic approach to Gold scalping.
**Remember:** Consistency comes from following the rules, not from finding "perfect" entries. Let the strategy do the work.
---
## 📚 RECOMMENDED READING
To deepen your understanding:
- George Douglas Taylor - "The Taylor Trading Technique"
- Mark Fisher - "The Logical Trader"
- Al Brooks - "Trading Price Action Trends"
- ICT Concepts - Liquidity and Order Flow
---
## 🎯 QUICK START CHECKLIST
Before going live:
- ☐ Backtested on 3+ months
- ☐ Paper traded for 2+ weeks
- ☐ Session times match broker
- ☐ Stop loss appropriate for account size
- ☐ Alerts configured
- ☐ Trading journal ready
- ☐ Risk per trade ≤ 2%
- ☐ Understand all entry conditions
- ☐ Know how to disable during news
---
**Strategy Type:** Scalping, Mean Reversion, Liquidity Trading
**Complexity:** Intermediate to Advanced
**Maintenance:** Low (once configured)
**Recommended Chart:** 1-minute XAUUSD
**Optimal Spread:** < 0.3 points
---
## 📈 KEYWORDS
Gold Trading, XAUUSD Strategy, Taylor Trading Technique, 1-Minute Scalping, Liquidity Sweep, Session Trading, Intraday Strategy, Gold Scalping, Smart Money Concepts, Institutional Trading, Asian Range, VWAP Trading, Risk Management, Automated Trading
---
**Developed with:** Pine Script v6
**Compatible with:** TradingView Pro, Pro+, Premium
**License:** Open Source (modify as needed)
---
*Happy Trading! May your sweeps be clean and your reversals be profitable.* 🟡📈
---
### 🔗 SUPPORT THIS WORK
If you find this strategy helpful:
- ⭐ Leave a review
- 💬 Share your results in comments
- 🔄 Share with fellow Gold traders
- 📊 Post your optimized settings
Your feedback helps improve future versions!

Deep Early Pullback ScannerIdentifies high-probability early entry setups in trending stocks. It high lights small-bodied red pullback candles within an uptrend, signaling potential continuation moves before conventional UT Bot buy signal triggers

EMA 9 & 26 Crossover by SN TraderEMA 9 & 26 Crossover by SN Trader – Clean Trend Signal Indicator |
The EMA 9 & 26 Cross (+ Marker) indicator is a lightweight and effective trend-direction and momentum-shift tool that visually marks EMA crossover events using simple “+” symbols placed directly above or below price candles.
This indicator is ideal for scalping, intraday trading, and swing trading across Forex, Crypto, Stocks, Indices, and Commodities.
🔹 Indicator Logic
EMA 9 (Green) → Fast momentum
EMA 26 (Red) → Trend direction
🟢 Green “+” (Below Candle)
Appears when EMA 9 crosses ABOVE EMA 26
Indicates bullish momentum or trend continuation
🔴 Red “+” (Above Candle)
Appears when EMA 26 crosses ABOVE EMA 9
Indicates bearish momentum or potential trend reversal
📈 How to Use
✔ Look for Green “+” for bullish bias
✔ Look for Red “+” for bearish bias
✔ Trade in the direction of higher-timeframe trend
✔ Combine with RSI, UT Bot, VWAP, MACD, Support & Resistance for confirmation
✅ Best For
Trend identification
Momentum confirmation
Scalping & intraday entries
Swing trade timing
Multi-timeframe analysis
⚙️ Features
✔ Clean & minimal design
✔ Non-repainting crossover signals
✔ Works on all timeframes & markets
✔ Pine Script v6 compliant
✔ Beginner & professional friendly
⚠️ Disclaimer
This indicator is for educational purposes only and does not provide financial advice. Always use risk management and additional confirmation before trading.

EMA 9 & 26 Crossover By SN TraderEMA 9 & 26 Crossover – Trend & Momentum Indicator For Scalpers
The EMA 9 & EMA 26 Crossover Indicator is a simple yet powerful trend-following tool designed to identify high-probability buy and sell signals based on short-term and medium-term momentum shifts.
This indicator is widely used by scalpers, intraday traders, and swing traders across Forex, Crypto, Stocks, Indices, and Commodities.
🔹 Indicator Logic
EMA 9 (Green) → Fast momentum
EMA 26 (Red) → Trend direction
BUY Signal
When EMA 9 crosses above EMA 26
Indicates bullish momentum and possible trend reversal or continuation
SELL Signal
When EMA 9 crosses below EMA 26
Indicates bearish momentum and potential downside movement
Clear BUY / SELL labels are plotted directly on the chart for easy visual confirmation.
📈 How to Trade Using This Indicator
✔ Enter BUY trades after EMA 9 crosses above EMA 26
✔ Enter SELL trades after EMA 9 crosses below EMA 26
✔ Use higher timeframes (15m, 1H, 4H) for stronger signals
✔ Combine with RSI, MACD, UT Bot, VWAP, Support & Resistance for confirmation
✅ Best Use Cases
Trend reversal identification
Momentum-based entries
Scalping & intraday strategies
Swing trading trend confirmation
Works on all timeframes
⚙️ Features
✔ Lightweight & fast
✔ Beginner-friendly
✔ Non-repainting signals
✔ Pine Script v6 compatible
✔ Clean visual design
⚠️ Disclaimer
This indicator is for educational purposes only and should not be considered financial advice. Always apply proper risk management and confirm signals with additional analysis.

EMA 9 / 15 / 20 / 26EMA 9 / 15 / 20 / 26 – Multi EMA Trend Indicator (Pine Script v6)
This indicator plots four Exponential Moving Averages (EMAs) — 9, 15, 20, and 26 — on the price chart to help traders identify trend direction, momentum strength, and dynamic support/resistance zones.
Designed for scalping, intraday trading, and swing trading, this script works across Forex, Crypto, Stocks, Indices, and Commodities on all timeframes.
🔹 EMA Settings & Color Coding
EMA 9 (Red) → Very fast momentum
EMA 15 (Green) → Short-term trend
EMA 20 (Yellow) → Intermediate trend filter
EMA 26 (Blue) → Trend confirmation & pullback zone
📈 How to Use
Bullish Trend
EMA 9 > EMA 15 > EMA 20 > EMA 26
Price holding above EMAs
Buy on pullbacks toward EMA 15 / EMA 20
Bearish Trend
EMA 9 < EMA 15 < EMA 20 < EMA 26
Price below EMAs
Sell on pullbacks toward EMA 15 / EMA 20
Sideways Market
EMAs tangled together
Avoid trades or switch to range strategies
✅ Best Use Cases
EMA crossover confirmation
Trend filtering for scalping strategies
Pullback entries
Support & resistance mapping
Works perfectly with UT Bot, RSI, MACD, VWAP, Price Action
⚙️ Features
✔ Lightweight & non-repainting
✔ Pine Script Version 6 compliant
✔ Works on all symbols & timeframes
✔ Beginner-friendly & professional-grade
⚠️ Disclaimer
This indicator is for educational purposes only. It does not provide financial advice. Always use proper risk management and confirm signals with additional indicators or price action.

Sniper HA Strategy (V7 Institutional)Here is a professional, institutional-grade description for your Pine Script. You can copy and paste this directly into the TradingView "Description" box when you publish or use it for your own documentation.
Sniper HA Strategy (V7 Institutional)
Sniper HA V7 is a robust, risk-first trend-following strategy designed to capture high-probability breakouts while aggressively filtering out market noise and "chop."
Unlike standard Heikin Ashi scripts that suffer from repainting or excessive signaling, V7 utilizes a "Native Non-Repainting" engine that calculates Heikin Ashi values internally based on confirmed closed candles. It combines this signal engine with institutional-grade risk management protocols—including dynamic circuit breakers, volatility regime filters, and a "Banker/Runner" split-exit system—to ensure capital preservation during drawdown periods.
1. Core Logic & Signal Generation
Native Heikin Ashi Engine: Calculates HA candles manually using (Open+High+Low+Close)/4 logic on confirmed bars. This eliminates the "flicker" often seen when using standard request.security HA calls.
Volatility Regime Filter ("Dead Zone"): Uses a 14-period ATR relative to its historical median (default 50th percentile) to filter out entries during low-volatility consolidations. If the market is sleeping, the bot stays flat.
Trend Confirmation Protocol: A signal does not trigger an immediate market entry. Instead, it places a Stop Order at a defined percentage (default 1.5%) beyond the signal candle. If price does not break through this level within a set timeout (default 48h), the signal expires. This prevents buying tops or selling bottoms during weak reversals.
2. Institutional Risk Management
Breathing Room Phase (0-48h): Recognizes that new trends need room to breathe. The stop loss is wider (default 5%) during the first 48 hours to survive initial volatility.
Circuit Breaker Phase (48h+): Once the trade matures, the stop tightens to a hard cap (default 8%) to prevent catastrophic loss on failed trends.
Cooldown Period: Enforces a mandatory "cool-off" (default 5 days) after a trade closes to prevent over-trading and "revenge trading" during choppy market conditions.
3. Dynamic Exit System (Banker + Runner)
This strategy employs a hybrid exit mechanism to smooth the equity curve:
The Banker (50%): Exits half the position at a fixed profit target (default 12%).
The Risk-Free Runner (50%): The moment the Banker target is hit, the stop loss for the remaining 50% is automatically moved to Breakeven. This creates a "Risk-Free" trade that trails price using an ATR-based Chandelier Stop (3x ATR), allowing you to catch massive outliers without giving back principal.
4. The Trader's Dashboard
A built-in heads-up display (HUD) in the top-right corner provides real-time state tracking:
Vol Regime: Shows PASS/FAIL based on current volatility.
Pending Orders: Displays the exact price level required to trigger an entry.
Expires In: Countdown timer for pending signals.
Trade Phase: Indicates if the trade is in "Breathing Room," "Circuit Breaker," or "Risk-Free Runner" mode.
Settings & Inputs
Exit Logic: Adjust Banker % and Runner ATR Multipliers.
Risk Management: Configure Stop percentages for initial and mature phases.
Filters: Tune the Trend Confirmation % and Volatility Percentile.
Backtest Window: Restrict testing to specific date ranges.

ETH Multi-Strategy Hybrid SystemETH Multi-Strategy Hybrid System
This strategy is a multi-strategy composite trading system designed for the ETH perpetual futures market.
It integrates trend-based and range-based trading logic under a unified execution and risk management framework, aiming to present the overall structure and performance characteristics of a systematic trading approach.
The public version is provided for backtesting display and structural illustration only.
Core execution details and parameter optimization logic are not disclosed.
📌 System Structure
The system consists of three independent strategy modules and strictly follows the principle of holding only a single directional position at any given time:
Strategy A: Trend-Following Long Module
• Designed for medium- to long-term bullish trends
• Confirms trend validity through multiple layers of conditions
• Employs volatility-driven stop-loss mechanisms and multi-stage profit-taking
• Aims to capture trend continuation while controlling drawdowns
Strategy B: Trend-Following Short Module
• Designed for bearish trends or accelerated downside phases
• Combines trend confirmation with momentum filtering to avoid false rebounds
• Utilizes fixed risk control combined with dynamic exit mechanisms, including trailing exits and profit retracement protection
• Focuses on fast-moving and sentiment-driven downside volatility
Strategy C: Range-Based Long Module
• Activated only in non-trending, low trend-strength market conditions
• Applies mean-reversion logic based on price range and volatility structure
• Automatically exits or becomes inactive when trend strength increases
• Serves as a supplementary module during non-trending market phases
⚙️ Risk Management & Execution Principles
• The system prohibits holding positions in multiple directions simultaneously
• Position allocation follows a predefined and fixed structure
• All risk control is based on market volatility characteristics; no averaging down, pyramiding, or martingale logic is used
• Execution is fully rule-based with no discretionary intervention
🔍 Public Version Notes
• This script is intended solely for backtesting observation and structural reference
• Parameters are fixed and simplified and do not represent the full live-trading version
• Live trading results may differ from backtests due to fees, slippage, and latency
• Not recommended for direct live trading use
🔗 OKX Signal Strategy Follow Link
The live signal execution version of this system has been deployed on the OKX Signal Trading platform for reference and optional follow trading:
👉 OKX Signal Trading
www.okx.com
Please fully understand the strategy’s positioning, risk characteristics, and your own risk tolerance before following.
⚠️ Risk Disclaimer
This strategy does not guarantee profits.
Historical backtest results do not represent future performance.
Please carefully assess suitability and risks before use.
