gangood bot for FinandyGangood is a mean reversion algorithm currently optimized for trading the ETH/USDT pair on the 1 hour chart time frame. All indicator inputs use the closing price of the period, and all trades are executed at the open of the period following the period in which the trading signal was generated.
To take into account slippage, the commission costs 0.15%.
Backtest result from 2020.
Result since 2019 2,500,000%, maximum drawdown 18%
This bot uses 11 indicators:
1) ADX
2) RANGE FILTER
3) SAR
4) RSI
5) TWAP
6) JMA
7) MACD
8) VOLUME DELTA
9) VOLUME WEIGHT
10) MA
11) TSI
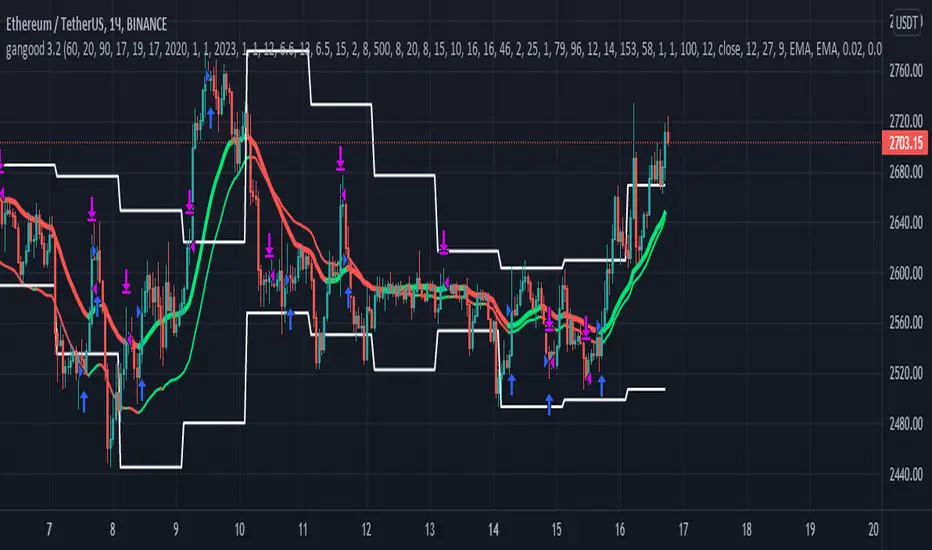
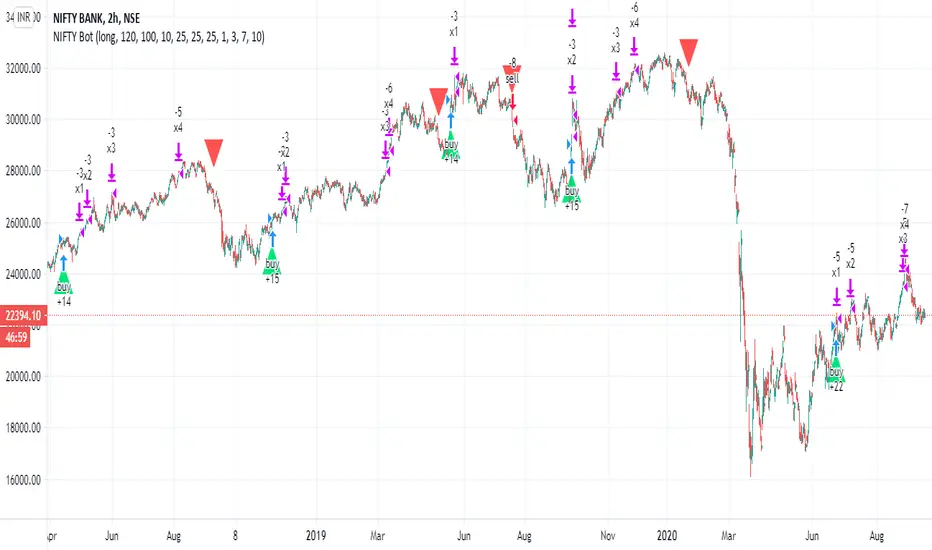
Pattern 1:
There are 3 main components that make up Gangood: I. Trend Filter. The algorithm uses a version of the ADX indicator as a trend filter to only trade during certain time periods when price is most likely to be range-bound (i.e., average retracement). This indicator consists of a fast ADX and a slow ADX both using the same lookback period.
The ADX is smoothed with a 6-period EMA and the slow ADX is smoothed with a 12-period EMA. When the fast ADX is above the slow ADX , the algorithm does not trade because it indicates that the price is most likely trending, which is bad for a mean reversion system. Conversely, when the fast ADX is below the slow ADX, the price is likely to be in a range, so this is the only time the algorithm is allowed to trade. II. Bollinger Bands When the trend filter allows trading, the algorithm uses Bollinger Bands.
Indicator for opening long and short positions. The Bolliger Bands indicator has a 20 lookback period and a 1.5 standard deviation for both the upper and lower bands. When the price crosses the lower band, a buy signal is generated and a long position is opened. When the price crosses the upper band, a sell signal is generated and a short position is opened.
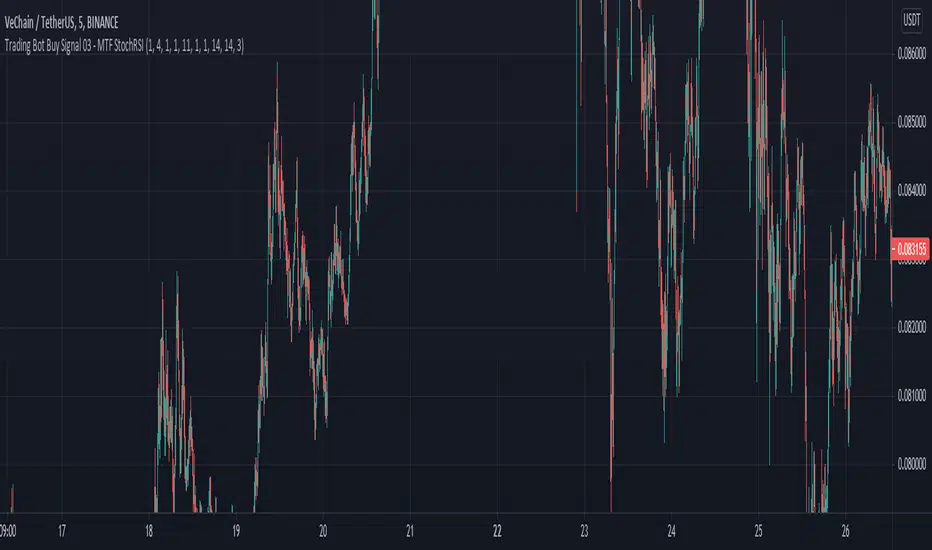
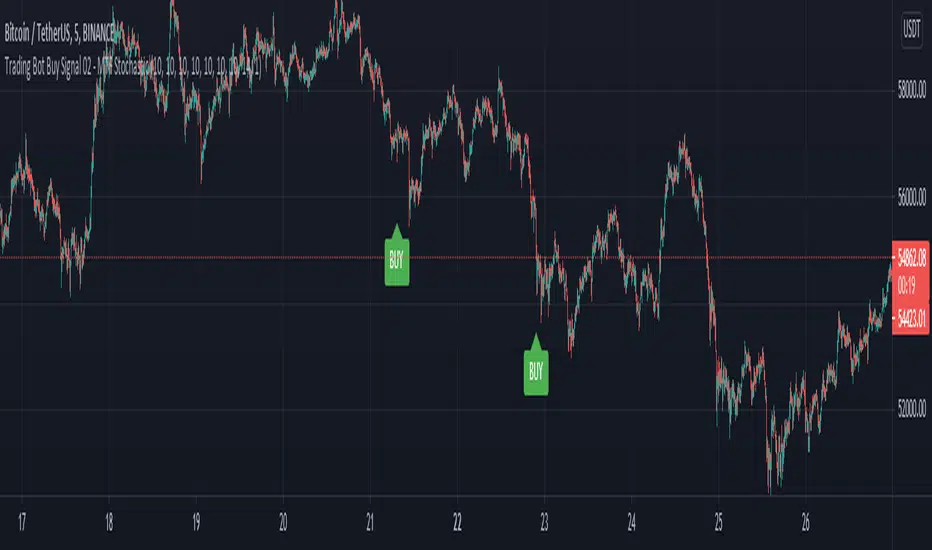
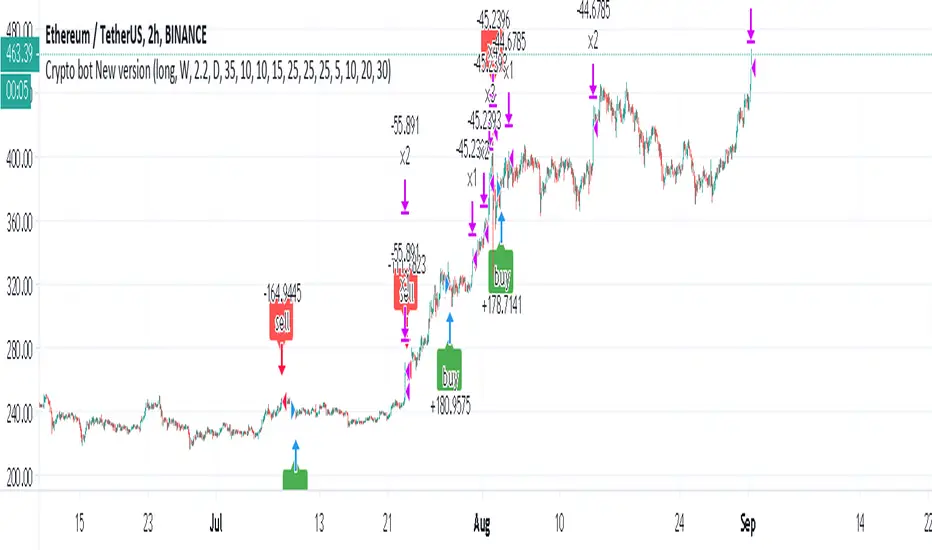
Pattern 2:
Based on RSI which is commonly used as a trend reversal indicator. However, here it is used as a trend-setting indicator, often with great success. This pattern only takes long trades, which is quite successful in a bull market.
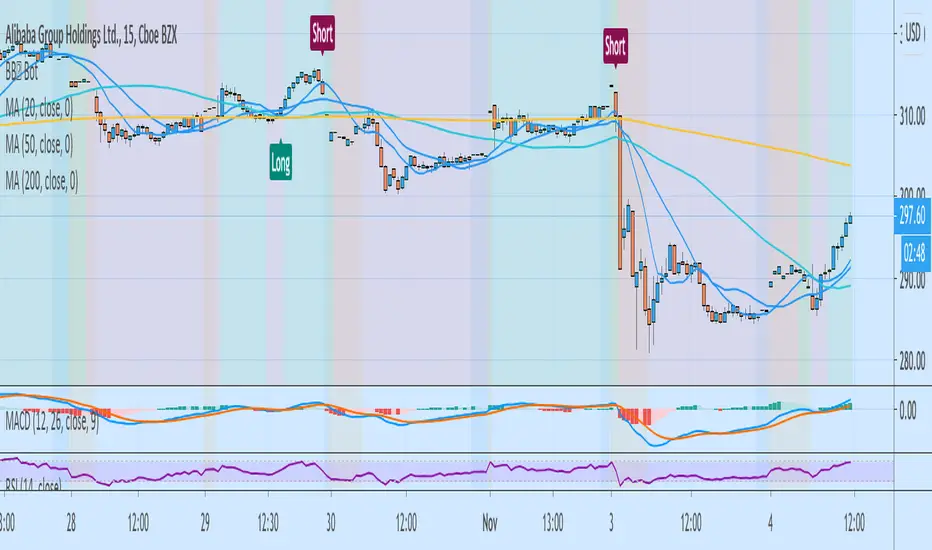
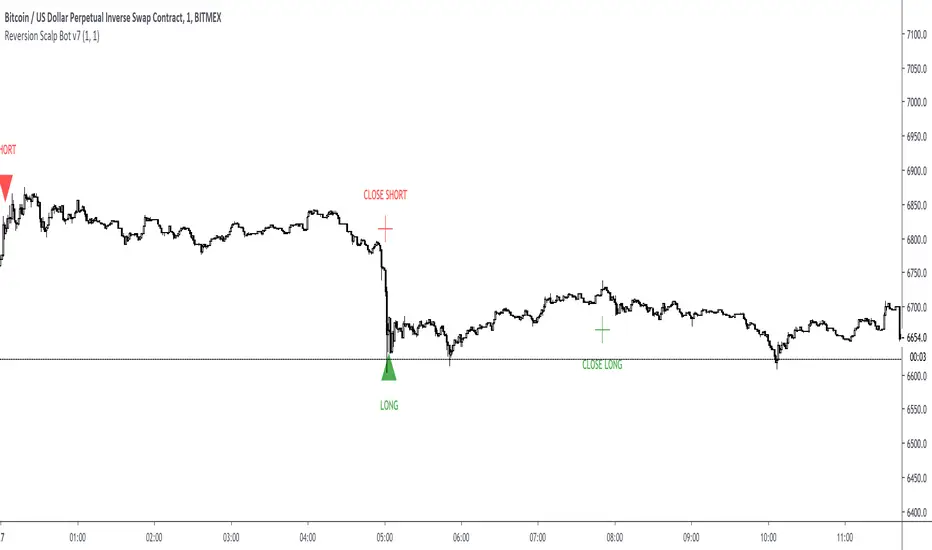
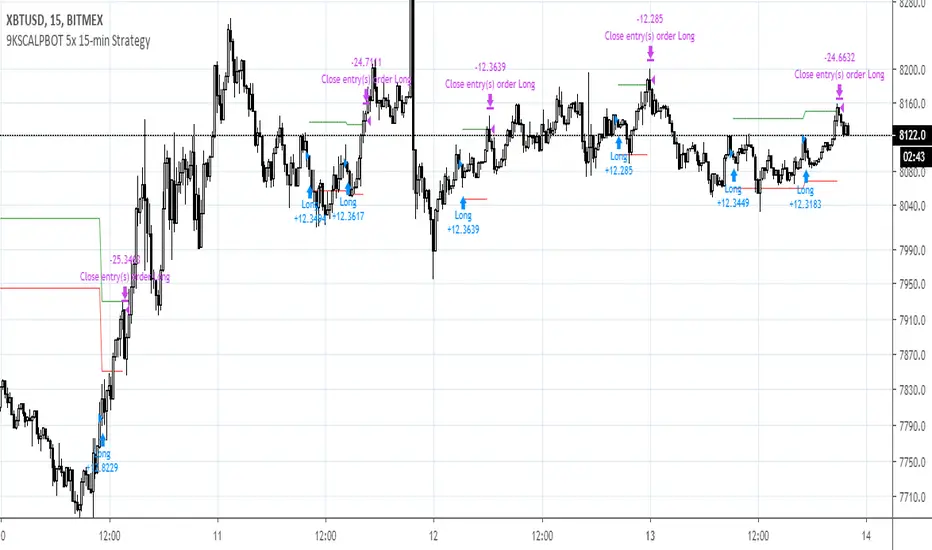
Pattern 3:
Long or short trades are determined by the intersection of the fast EMA with the slow EMA for long positions and vice versa for short positions. Trades should only occur close to intersections. We then use the MACD for the long position. an indicator with a 10-minute time frame where we look for high peaks in negative values for longs and vice versa for shorts. They should be significantly higher than the other peaks.
Capital Management:
The maximum leverage in this strategy, I would recommend 2x, in order to trade without unnecessary risks and keep your nerves in order.
Bot setup:
I use the Finandy terminal, in which you can easily trade with this strategy.
1. We go to binance and turn on the hedging mode, this is necessary so that if tradingview sends a webhook for buying later than for selling.
2. Adding a new signal to Finandy
2.1. Open tab
2.1.1. "Order side" Strategy
2.1.2. "Amount" Balance% x Leverage
2.1.3. We set the percentage of the order two times less than the one you want
2.1.4. "Shoulder" is twice as large as the one you want
2.2.Close tab
2.2.1. "Enebaled" tick
2.2.2. "Reverse / Close" Disable
3. Set a notification for this strategy.
4. Copy "Signal URL" and paste it into webhook on tradingview
5. Copy "Signal Message" and paste it into the message on tradingview
Pine Script®策略