rsi sma/ema cuCustom RSI with SMA 9, EMA 45 and Bull/Bear Control Zones from Krown and Constance Brown.
在腳本中搜尋"rsi"

Rsi momentum experimentalThis is RSI momentum , I try to make it as experiment so I hope it not bad:)
the up strength is in blue and the down momentum is in red

RSI simple Long ShortSimple indicator when RSI goes above 75 or below 25. It gives signal at next proper candle.

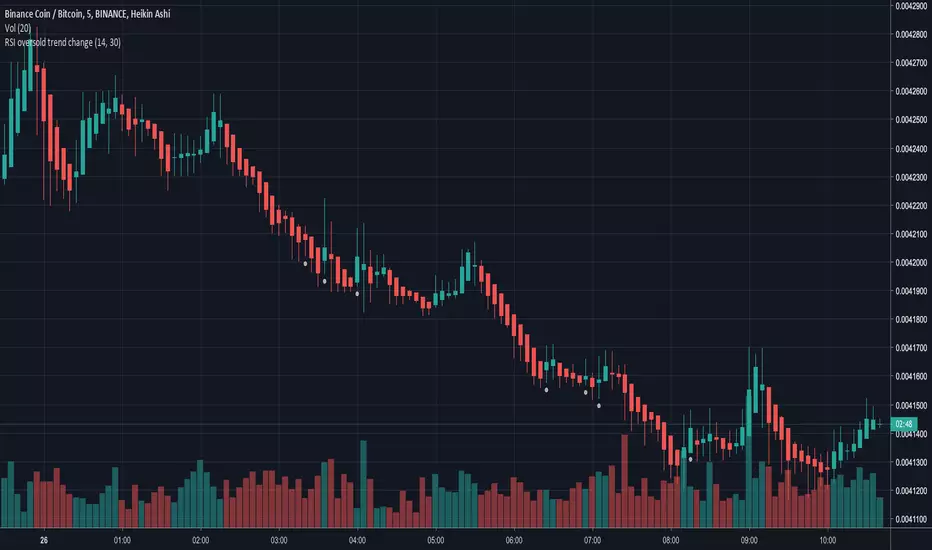
RSI oversold trend changeSimple script that will plot a circle indication on the chart when RSI returns above 30 from oversold position.
Also allows you to create a custom alert.


RSI ST MTFUsing this script with some changes
I try to build the RSI SUPERTREND model with MTF function
I think its need more work to refine it but as idea its nice

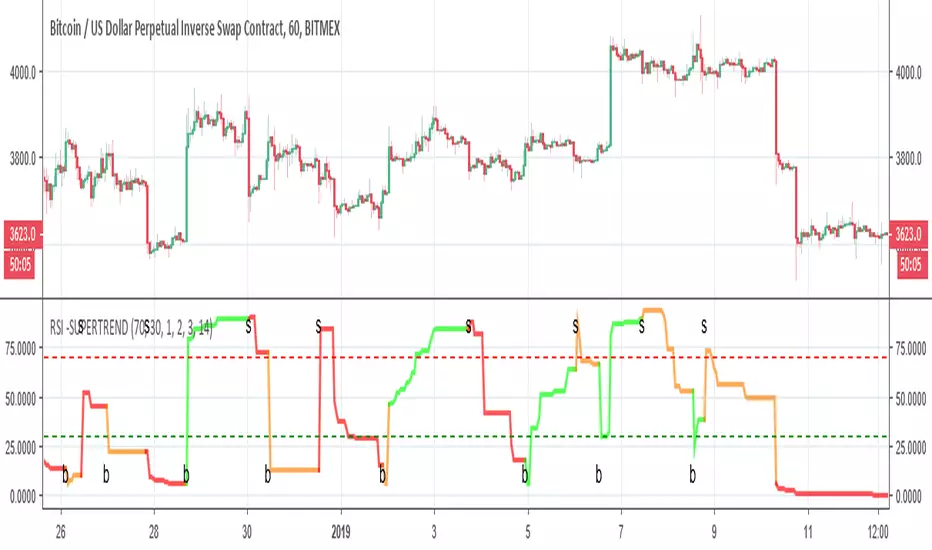
RSI -SUPERTRENDThis is hybrid of Super trend and RSI
the green and red zones are by the supertrend
so it seems the two indicator can compleemnt each other
RSI candlesnice RSI candles , so you can use to see where the real trend is
in next update i will make buy and sell points


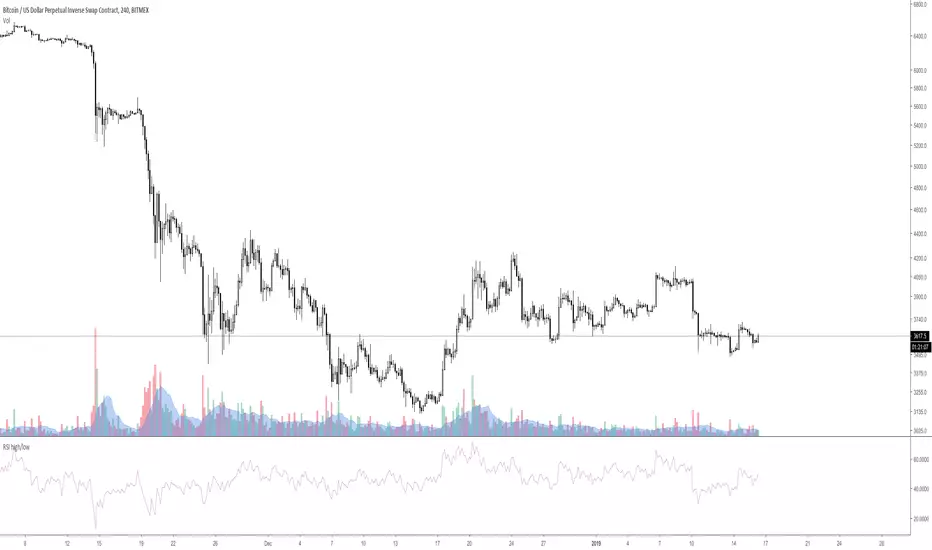
RSI high/low [experiment]This is an experiment.
This is a RSI based on candle high / low instead of close.
If the candle is up / green then the high is used.
If the candle is down / red then the low is used.
Feel free to ask if you have any question.

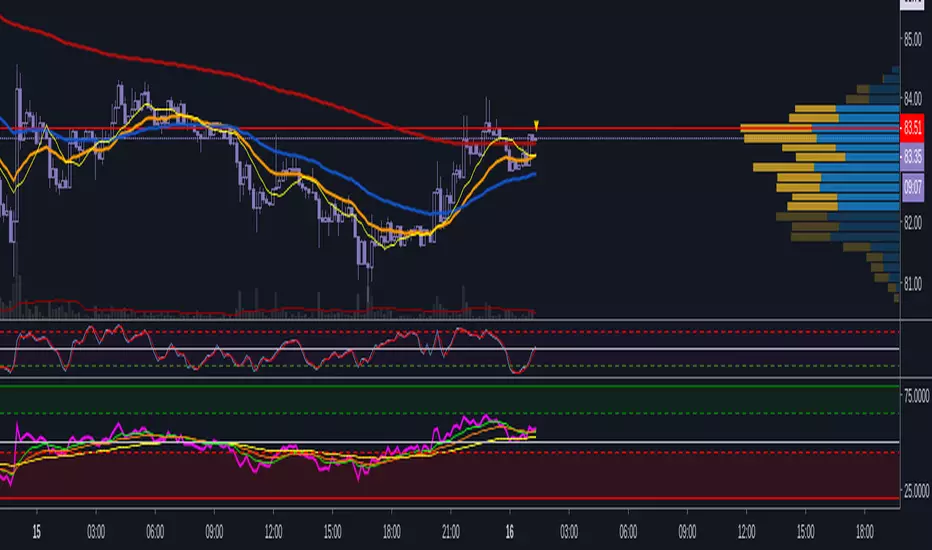
RSI & EMAx3_SushiThis indicator is mostly the same as other RSI+EMA indicators, the relevant difference is that it uses three EMAs instead of one.
The additional two EMAs can act as support/resistance and tell how strong a move is (eg. 'Williams Alligator'). It provides the same utility any MA does.

RSI BackgoundPlots a Green/Red strip on the price chart to highlight when RSI goes overbought or oversold.
You can optimize it by yourself on the source code, just change "70" or "30" for your desired value.
Cheers!

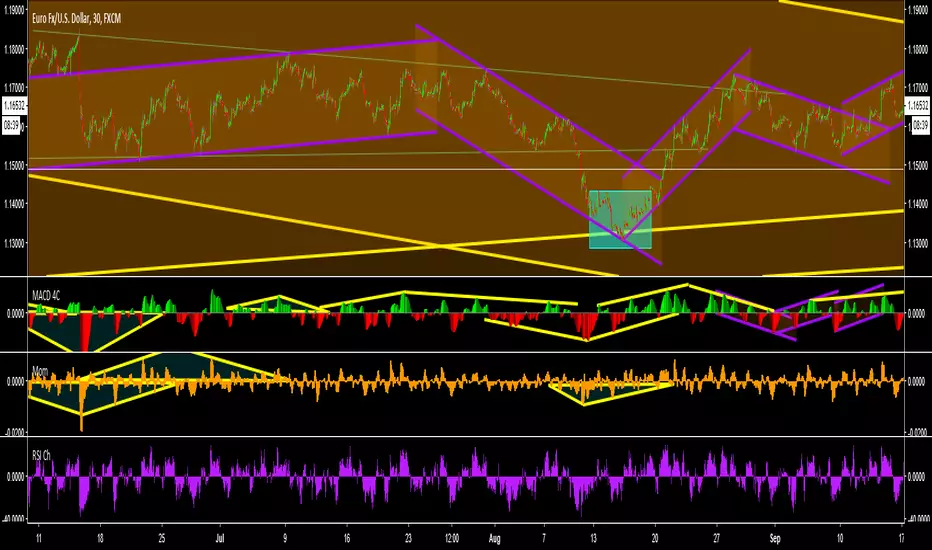
RSI Bollinger WaveTrend Cycle Multi Free TSPMulti indicator
Bollinger Band x RSI
Wave Trend
Cycles
Free users will like it :)
Fell free to like share comments... and check my other stuff :]

Combined RSI and MA Alert Triggersrsi indicator whith conditional moving average settings for swing trading when market price is above certain moving averages
testing a simple for fun, not intended to be financial advise, do your own research :)
enjoy!