在腳本中搜尋"rsi"

RSI TRI With Mid Point and HighlightsRSI that has the 50 line plotted plus it highlights overbought and oversold conditions.


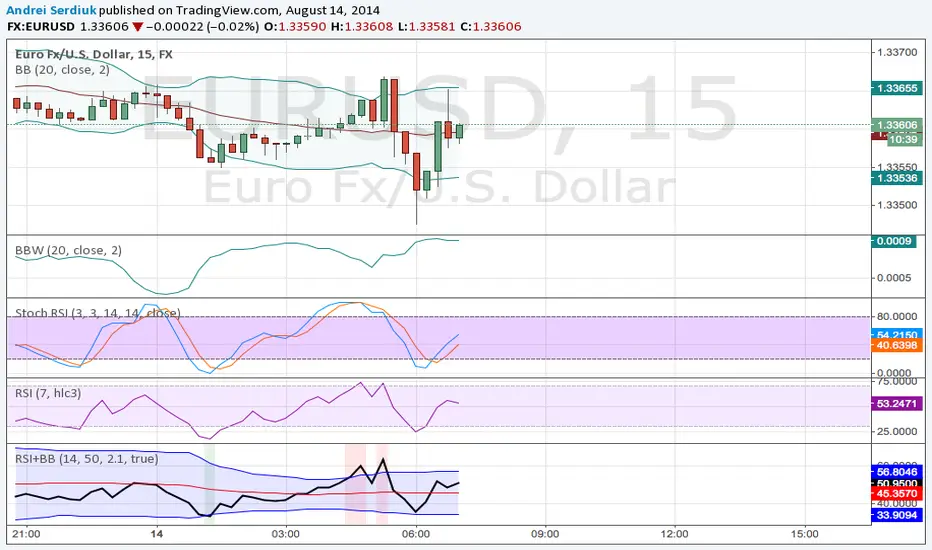
RSI+Bollinger Bands+ EMARSI on pivot points (you can chose the source) with Bollinger Bands and a EMA


RSI Currency Strength IndicatorRSI based currency strength indicator. Other indicators only give 7 currencies, leaving NZD. This one is an updated version which gives all 8 major currencies.


RSI with Bollinger Bands [Erionis]RSI + Bollinger Bands. Usefull to see possible reversal points. Use it accordingly.
rsi with bb [or]rsi has 2 line. 30 and 70.
but we can use BB instead of that.
i dont know it is good idea or not.
cause i rarely use rsi.
anyway if you are interested in it, you can try :)
enjoy and earn money.
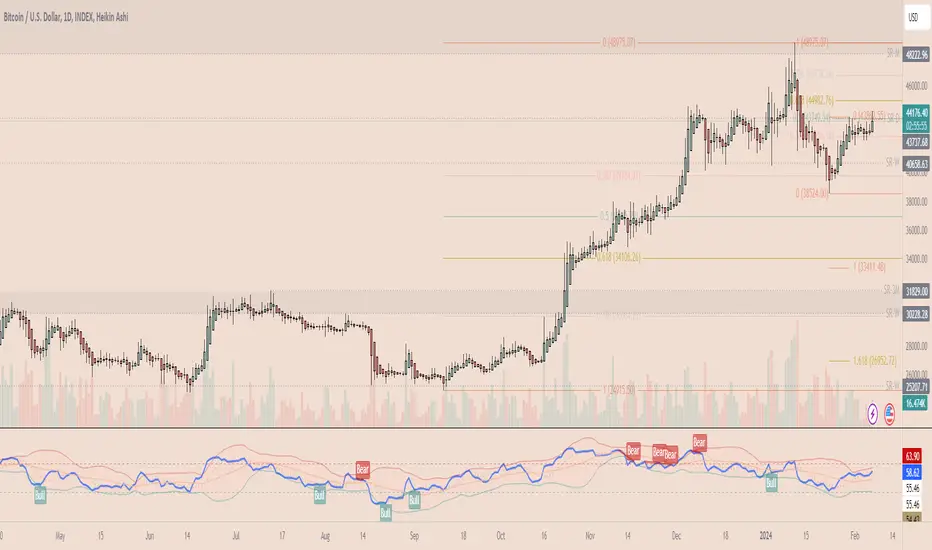
RSI in Bull and Bear Market V2.0RSI oversold at 60/40 in bullish market
And Overbought at 40/60 in Bearish market
for more info of this Strategy


RSI مبسط//@version=5
indicator("RSI مبسط", overlay=false)
// حساب RSI
rsiValue = ta.rsi(close, 14)
// رسم خط RSI
plot(rsiValue)
// رسم المستويات
plot(95, "Level 95")
plot(78.6, "Level 78.6")
plot(61.8, "Level 61.8")
plot(38.2, "Level 38.2")
plot(21.4, "Level 21.4")
plot(5, "Level 5")
