Trend and RSI Bias FusionTrend and RSI Bias Fusion Indicator
This is my first ever indicator. I created this indicator for myself. I was inspired by the indicators created by Bjorgum, Duyck and QuantTherapy and decided to create multiple indicators that either work well combined with their indicators or something new that applies some of their indicator concepts. I decided to share this because I believe in learning and earing together as a community. I will later share the rest of the indicators I have created. This is my first time ever sharing any indicator so if you guys have any questions or suggestions write them.
Overview
The "Trend and RSI Bias Fusion" indicator is a versatile tool designed to help traders identify key market trends, potential reversals, momentum shifts, and RSI-based pullbacks. This indicator fuses trend analysis and RSI bias into a single, comprehensive visual, making it easier to make informed trading decisions across various timeframes and market conditions.
Features
Dual Timeframe Analysis: Combines trend analysis on a higher timeframe (e.g., Daily) with RSI analysis on a lower timeframe (e.g., 4-Hour), providing a more granular view of market conditions. You can, however, choose any timeframe you want for instance 12hr with trend and 2hr RSI analysis.
Trend and Momentum Visualization: The indicator uses Exponential Moving Averages (EMAs) to determine trend direction and colors the chart background to reflect bullish or bearish trends, along with momentum strength.
RSI Bias Detection: Automatically identifies overbought and oversold conditions using the RSI, providing a clear indication of potential market reversals or continuations.
Color-Coded Bars: Optionally color codes bars based on either trend direction or RSI bias, giving you a quick visual cue of the market's state.
Reversal Markers: Displays trend reversal markers on the chart when the short-term EMA crosses over or under the long-term EMA.
Calculation Details
Exponential Moving Averages (EMAs): The indicator calculates short-term and long-term EMAs using the closing prices.
The crossover between these EMAs is used to determine the trend direction:
Short-Term EMA: Typically a 14-period EMA.
Long-Term EMA: Typically a 50-period EMA.
Momentum: Calculated using the RSI and then centered around zero by subtracting 50. This allows the indicator to distinguish between positive and negative momentum.
RSI Bias: The RSI is calculated on a lower timeframe to detect overbought (above 60) and oversold (below 40) conditions, which are used to determine the bias:
RSI Above 60: Indicates potential overbought conditions (bearish bias).
RSI Below 40: Indicates potential oversold conditions (bullish bias).
How to Use the Indicator
Select Your Timeframes: Choose your preferred trend timeframe (e.g., Daily) and RSI timeframe (e.g., 4-2 Hour) in the indicator settings. These should match your trading strategy and the asset class you're analyzing.
Interpret Trend and Momentum
Background Color: The background color reflects the current trend direction:
Green/Lime: Uptrend, with lime indicating positive momentum.
Red/Maroon: Downtrend, with maroon indicating positive momentum within a downtrend.
Momentum Histogram: The histogram plot shows momentum, color-coded by the trend. A histogram above zero with green/lime indicates bullish momentum, while below zero with red/maroon indicates bearish momentum.
Image above: Both RSI and Trend are set to daily, uses RSI bar color
Read RSI Bias:
The RSI bias line helps identify the current market state relative to overbought or oversold levels. The RSI value is plotted on the chart, with lines at 60 and 40 to mark these levels.
When the RSI crosses above 60, it suggests a bearish bias; crossing below 40 suggests a bullish bias.
Use Reversal Markers: The indicator places small circles on the chart at points where the short-term EMA crosses the long-term EMA, signaling potential trend reversals.
Bar Color Customization:
You can choose to color the bars based on either the trend or the RSI bias in the indicator settings. In the Images below I have changed the colors to fit my personal style , Blue for uptrend and Pink for downtrend:
Trend-Based: Bars will reflect the trend direction (green for uptrend or in this case blue, red for downtrend or in this case pink).
RSI-Based: Bars will reflect RSI conditions (yellow for overbought, maroon for oversold).
Image above: RSI is set to 4hr and Trend is set to daily, uses RSI bar color
Image above: RSI is set to 4hr and Trend is set to daily, uses Trend bar color
Image above: Both RSI and Trend are set to daily, uses RSI bar color
Image above: Both RSI and Trend are set to daily, uses Trend bar color
Image above: Both RSI and Trend are set to daily, without bar color
Image above: Both RSI and Trend are set to daily, how it looks on a clean chart
Example Use Case Swing Traders:
For instance, if you're trading a 4-hour chart of USDCHF:
Set the trend timeframe to Daily and the RSI timeframe to 4-Hour.
Watch for background color shifts and reversal markers to determine trend direction.
Use RSI bias to time your entries and exits, especially around overbought/oversold levels.
Enable bar coloring to quickly see when conditions favor either trend continuation or reversal.
This indicator is particularly effective for swing traders and those who want to align their trades with higher timeframe trends while using momentum and RSI for entry and exit signals.
For Day Traders
Timeframe Selection:
Trend Timeframe: Set to a higher intraday timeframe such as the 1 or 2 Hour chart.
RSI Timeframe: Set to a shorter timeframe like 15-10 Minutes or 5-Minutes to capture finer details of intraday momentum shifts.
Using the Indicator:
Trend Identification: Day traders can use the background color to quickly identify whether the market is in a bullish or bearish trend on the 1-Hour chart. A green background suggests looking for long opportunities, while a red background suggests short opportunities.
Momentum Analysis: The histogram can help day traders gauge the strength of the current trend. For example, if the histogram is green and above zero, the trader may consider buying pullbacks within the trend.
RSI Bias: Monitor RSI levels on the lower timeframe (e.g., 15-Minutes). If the RSI crosses below 40, it indicates an oversold condition, potentially signaling a buying opportunity, especially if it aligns with a bullish trend on the higher timeframe.
Trade Execution:
Look for entries when the RSI shows a reversal or pullback in the direction of the higher timeframe trend.
Use the trend reversal markers to confirm potential intraday reversals, adding extra confidence to trade setups.
For Scalpers
Timeframe Selection:
Trend Timeframe: Set to a short intraday timeframe like 15-Minutes or 5-Minutes.
RSI Timeframe: Use an even shorter timeframe, such as 1-Minute, to capture rapid price movements.
Final Notes:
The "Trend and RSI Bias Fusion" indicator is a powerful tool that combines trend analysis, momentum assessment, and RSI insights into one cohesive package. By integrating these different aspects, the indicator helps traders navigate complex market environments with greater clarity and confidence. Customize the settings to fit your specific trading style and market and use it to stay ahead of market trends and potential reversals.
My Scripts/Indicators/Ideas /Systems that I share are only for educational purposes!
在腳本中搜尋"rsi"

Uptrick: RSI Histogram
1. **Introduction to the RSI and Moving Averages**
2. **Detailed Breakdown of the Uptrick: RSI Histogram**
3. **Calculation and Formula**
4. **Visual Representation**
5. **Customization and User Settings**
6. **Trading Strategies and Applications**
7. **Risk Management**
8. **Case Studies and Examples**
9. **Comparison with Other Indicators**
10. **Advanced Usage and Tips**
---
## 1. Introduction to the RSI and Moving Averages
### **1.1 Relative Strength Index (RSI)**
The Relative Strength Index (RSI) is a momentum oscillator developed by J. Welles Wilder and introduced in his 1978 book "New Concepts in Technical Trading Systems." It is widely used in technical analysis to measure the speed and change of price movements.
**Purpose of RSI:**
- **Identify Overbought/Oversold Conditions:** RSI values range from 0 to 100. Traditionally, values above 70 are considered overbought, while values below 30 are considered oversold. These thresholds help traders identify potential reversal points in the market.
- **Trend Strength Measurement:** RSI also indicates the strength of a trend. High RSI values suggest strong bullish momentum, while low values indicate bearish momentum.
**Calculation of RSI:**
1. **Calculate the Average Gain and Loss:** Over a specified period (e.g., 14 days), calculate the average gain and loss.
2. **Compute the Relative Strength (RS):** RS is the ratio of average gain to average loss.
3. **RSI Formula:** RSI = 100 - (100 / (1 + RS))
### **1.2 Moving Averages (MA)**
Moving Averages are used to smooth out price data and identify trends by filtering out short-term fluctuations. Two common types are:
**Simple Moving Average (SMA):** The average of prices over a specified number of periods.
**Exponential Moving Average (EMA):** A type of moving average that gives more weight to recent prices, making it more responsive to recent price changes.
**Smoothed Moving Average (SMA):** Used to reduce the impact of volatility and provide a clearer view of the underlying trend. The RMA, or Running Moving Average, used in the USH script is similar to an EMA but based on the average of RSI values.
## 2. Detailed Breakdown of the Uptrick: RSI Histogram
### **2.1 Indicator Overview**
The Uptrick: RSI Histogram (USH) is a technical analysis tool that combines the RSI with a moving average to create a histogram that reflects momentum and trend strength.
**Key Components:**
- **RSI Calculation:** Determines the relative strength of price movements.
- **Moving Average Application:** Smooths the RSI values to provide a clearer trend indication.
- **Histogram Plotting:** Visualizes the deviation of the smoothed RSI from a neutral level.
### **2.2 Indicator Purpose**
The primary purpose of the USH is to provide a clear visual representation of the market's momentum and trend strength. It helps traders identify:
- **Bullish and Bearish Trends:** By showing how far the smoothed RSI is from the neutral 50 level.
- **Potential Reversal Points:** By highlighting changes in momentum.
### **2.3 Indicator Design**
**RSI Moving Average (RSI MA):** The RSI MA is a smoothed version of the RSI, calculated using a running moving average. This smooths out short-term fluctuations and provides a clearer indication of the underlying trend.
**Histogram Calculation:**
- **Neutral Level:** The histogram is plotted relative to the neutral level of 50. This level represents a balanced market where neither bulls nor bears have dominance.
- **Histogram Values:** The histogram bars show the difference between the RSI MA and the neutral level. Positive values indicate bullish momentum, while negative values indicate bearish momentum.
## 3. Calculation and Formula
### **3.1 RSI Calculation**
The RSI calculation involves:
1. **Average Gain and Loss:** Calculated over the specified length (e.g., 14 periods).
2. **Relative Strength (RS):** RS = Average Gain / Average Loss.
3. **RSI Formula:** RSI = 100 - (100 / (1 + RS)).
### **3.2 Moving Average Calculation**
For the USH indicator, the RSI is smoothed using a running moving average (RMA). The RMA formula is similar to that of the EMA but is based on averaging RSI values over the specified length.
### **3.3 Histogram Calculation**
The histogram value is calculated as:
- **Histogram Value = RSI MA - 50**
**Plotting the Histogram:**
- **Positive Histogram Values:** Indicate that the RSI MA is above the neutral level, suggesting bullish momentum.
- **Negative Histogram Values:** Indicate that the RSI MA is below the neutral level, suggesting bearish momentum.
## 4. Visual Representation
### **4.1 Histogram Bars**
The histogram is plotted as bars on the chart:
- **Bullish Bars:** Colored green when the RSI MA is above 50.
- **Bearish Bars:** Colored red when the RSI MA is below 50.
### **4.2 Customization Options**
Traders can customize:
- **RSI Length:** Adjust the length of the RSI calculation to match their trading style.
- **Bull and Bear Colors:** Choose colors for histogram bars to enhance visual clarity.
### **4.3 Interpretation**
**Bullish Signal:** A histogram bar that moves from red to green indicates a potential shift to a bullish trend.
**Bearish Signal:** A histogram bar that moves from green to red indicates a potential shift to a bearish trend.
## 5. Customization and User Settings
### **5.1 Adjusting RSI Length**
The length parameter determines the number of periods over which the RSI is calculated and smoothed. Shorter lengths make the RSI more sensitive to price changes, while longer lengths provide a smoother view of trends.
### **5.2 Color Settings**
Traders can adjust:
- **Bull Color:** Color of histogram bars indicating bullish momentum.
- **Bear Color:** Color of histogram bars indicating bearish momentum.
**Customization Benefits:**
- **Visual Clarity:** Traders can choose colors that stand out against their chart’s background.
- **Personal Preference:** Adjust settings to match individual trading styles and preferences.
## 6. Trading Strategies and Applications
### **6.1 Trend Following**
**Identifying Entry Points:**
- **Bullish Entry:** When the histogram changes from red to green, it signals a potential entry point for long positions.
- **Bearish Entry:** When the histogram changes from green to red, it signals a potential entry point for short positions.
**Trend Confirmation:** The histogram helps confirm the strength of a trend. Strong, consistent green bars indicate robust bullish momentum, while strong, consistent red bars indicate robust bearish momentum.
### **6.2 Swing Trading**
**Momentum Analysis:**
- **Entry Signals:** Look for significant shifts in the histogram to time entries. A shift from bearish to bullish (red to green) indicates potential for upward movement.
- **Exit Signals:** A shift from bullish to bearish (green to red) suggests a potential weakening of the trend, signaling an exit or reversal point.
### **6.3 Range Trading**
**Market Conditions:**
- **Consolidation:** The histogram close to zero suggests a range-bound market. Traders can use this information to identify support and resistance levels.
- **Breakout Potential:** A significant move away from the neutral level may indicate a potential breakout from the range.
### **6.4 Risk Management**
**Stop-Loss Placement:**
- **Bullish Positions:** Place stop-loss orders below recent support levels when the histogram is green.
- **Bearish Positions:** Place stop-loss orders above recent resistance levels when the histogram is red.
**Position Sizing:** Adjust position sizes based on the strength of the histogram signals. Strong trends (indicated by larger histogram bars) may warrant larger positions, while weaker signals suggest smaller positions.
## 7. Risk Management
### **7.1 Importance of Risk Management**
Effective risk management is crucial for long-term trading success. It involves protecting capital, managing losses, and optimizing trade setups.
### **7.2 Using USH for Risk Management**
**Stop-Loss and Take-Profit Levels:**
- **Stop-Loss Orders:** Use the histogram to set stop-loss levels based on trend strength. For instance, place stops below support levels in bullish trends and above resistance levels in bearish trends.
- **Take-Profit Targets:** Adjust take-profit levels based on histogram changes. For example, lock in profits as the histogram starts to shift from green to red.
**Position Sizing:**
- **Trend Strength:** Scale position sizes based on the strength of histogram signals. Larger histogram bars indicate stronger trends, which may justify larger positions.
- **Volatility:** Consider market volatility and adjust position sizes to mitigate risk.
## 8. Case Studies and Examples
### **8.1 Example 1: Bullish Trend**
**Scenario:** A trader notices a transition from red to green histogram bars.
**Analysis:**
- **Entry Point:** The transition indicates a potential bullish trend. The trader decides to enter a long position.
- **Stop-Loss:** Set stop-loss below recent support levels.
- **Take-Profit:** Consider taking profits as the histogram moves back towards zero or turns red.
**Outcome:** The bullish trend continues, and the histogram remains green, providing a profitable trade setup.
### **8.2 Example 2: Bearish Trend**
**Scenario:** A trader observes a transition from green to red histogram bars.
**Analysis:**
- **Entry Point:** The transition suggests a potential
bearish trend. The trader decides to enter a short position.
- **Stop-Loss:** Set stop-loss above recent resistance levels.
- **Take-Profit:** Consider taking profits as the histogram approaches zero or shifts to green.
**Outcome:** The bearish trend continues, and the histogram remains red, resulting in a successful trade.
## 9. Comparison with Other Indicators
### **9.1 RSI vs. USH**
**RSI:** Measures momentum and identifies overbought/oversold conditions.
**USH:** Builds on RSI by incorporating a moving average and histogram to provide a clearer view of trend strength and momentum.
### **9.2 RSI vs. MACD**
**MACD (Moving Average Convergence Divergence):** A trend-following momentum indicator that uses moving averages to identify changes in trend direction.
**Comparison:**
- **USH:** Provides a smoothed RSI perspective and visual histogram for trend strength.
- **MACD:** Offers signals based on the convergence and divergence of moving averages.
### **9.3 RSI vs. Stochastic Oscillator**
**Stochastic Oscillator:** Measures the level of the closing price relative to the high-low range over a specified period.
**Comparison:**
- **USH:** Focuses on smoothed RSI values and histogram representation.
- **Stochastic Oscillator:** Provides overbought/oversold signals and potential reversals based on price levels.
## 10. Advanced Usage and Tips
### **10.1 Combining Indicators**
**Multi-Indicator Strategies:** Combine the USH with other technical indicators (e.g., Moving Averages, Bollinger Bands) for a comprehensive trading strategy.
**Confirmation Signals:** Use the USH to confirm signals from other indicators. For instance, a bullish histogram combined with a moving average crossover may provide a stronger buy signal.
### **10.2 Customization Tips**
**Adjust RSI Length:** Experiment with different RSI lengths to match various market conditions and trading styles.
**Color Preferences:** Choose histogram colors that enhance visibility and align with personal preferences.
### **10.3 Continuous Learning**
**Backtesting:** Regularly backtest the USH with historical data to refine strategies and improve accuracy.
**Education:** Stay updated with trading education and adapt strategies based on market changes and personal experiences.

Advanced Dynamic Threshold RSI [Elysian_Mind]Advanced Dynamic Threshold RSI Indicator
Overview
The Advanced Dynamic Threshold RSI Indicator is a powerful tool designed for traders seeking a unique approach to RSI-based signals. This indicator combines traditional RSI analysis with dynamic threshold calculation and optional Bollinger Bands to generate weighted buy and sell signals.
Features
Dynamic Thresholds: The indicator calculates dynamic thresholds based on market volatility, providing more adaptive signal generation.
Performance Analysis: Users can evaluate recent price performance to further refine signals. The script calculates the percentage change over a specified lookback period.
Bollinger Bands Integration: Optional integration of Bollinger Bands for additional confirmation and visualization of potential overbought or oversold conditions.
Customizable Settings: Traders can easily customize key parameters, including RSI length, SMA length, lookback bars, threshold multiplier, and Bollinger Bands parameters.
Weighted Signals: The script introduces a unique weighting mechanism for signals, reducing false positives and improving overall reliability.
Underlying Calculations and Methods
1. Dynamic Threshold Calculation:
The heart of the Advanced Dynamic Threshold RSI Indicator lies in its ability to dynamically calculate thresholds based on multiple timeframes. Let's delve into the technical details:
RSI Calculation:
For each specified timeframe (1-hour, 4-hour, 1-day, 1-week), the Relative Strength Index (RSI) is calculated using the standard 14-period formula.
SMA of RSI:
The Simple Moving Average (SMA) is applied to each RSI, resulting in the smoothing of RSI values. This smoothed RSI becomes the basis for dynamic threshold calculations.
Dynamic Adjustment:
The dynamically adjusted threshold for each timeframe is computed by adding a constant value (5 in this case) to the respective SMA of RSI. This dynamic adjustment ensures that the threshold reflects changing market conditions.
2. Weighted Signal System:
To enhance the precision of buy and sell signals, the script introduces a weighted signal system. Here's how it works technically:
Signal Weighting:
The script assigns weights to buy and sell signals based on the crossover and crossunder events between RSI and the dynamically adjusted thresholds. If a crossover event occurs, the weight is set to 2; otherwise, it remains at 1.
Signal Combination:
The weighted buy and sell signals from different timeframes are combined using logical operations. A buy signal is generated if the product of weights from all timeframes is equal to 2, indicating alignment across timeframe.
3. Experimental Enhancements:
The Advanced Dynamic Threshold RSI Indicator incorporates experimental features for educational exploration. While not intended as proven strategies, these features aim to offer users a glimpse into unconventional analysis. Some of these features include Performance Calculation, Volatility Calculation, Dynamic Threshold Calculation Using Volatility, Bollinger Bands Module, Weighted Signal System Incorporating New Features.
3.1 Performance Calculation:
The script calculates the percentage change in the price over a specified lookback period (variable lookbackBars). This provides a measure of recent performance.
pctChange(src, length) =>
change = src - src
pctChange = (change / src ) * 100
recentPerformance1H = pctChange(close, lookbackBars)
recentPerformance4H = pctChange(request.security(syminfo.tickerid, "240", close), lookbackBars)
recentPerformance1D = pctChange(request.security(syminfo.tickerid, "1D", close), lookbackBars)
3.2 Volatility Calculation:
The script computes the standard deviation of the closing price to measure volatility.
volatility1H = ta.stdev(close, 20)
volatility4H = ta.stdev(request.security(syminfo.tickerid, "240", close), 20)
volatility1D = ta.stdev(request.security(syminfo.tickerid, "1D", close), 20)
3.3 Dynamic Threshold Calculation Using Volatility:
The dynamic thresholds for RSI are calculated by adding a multiplier of volatility to 50.
dynamicThreshold1H = 50 + thresholdMultiplier * volatility1H
dynamicThreshold4H = 50 + thresholdMultiplier * volatility4H
dynamicThreshold1D = 50 + thresholdMultiplier * volatility1D
3.4 Bollinger Bands Module:
An additional module for Bollinger Bands is introduced, providing an option to enable or disable it.
// Additional Module: Bollinger Bands
bbLength = input(20, title="Bollinger Bands Length")
bbMultiplier = input(2.0, title="Bollinger Bands Multiplier")
upperBand = ta.sma(close, bbLength) + bbMultiplier * ta.stdev(close, bbLength)
lowerBand = ta.sma(close, bbLength) - bbMultiplier * ta.stdev(close, bbLength)
3.5 Weighted Signal System Incorporating New Features:
Buy and sell signals are generated based on the dynamic threshold, recent performance, and Bollinger Bands.
weightedBuySignal = rsi1H > dynamicThreshold1H and rsi4H > dynamicThreshold4H and rsi1D > dynamicThreshold1D and crossOver1H
weightedSellSignal = rsi1H < dynamicThreshold1H and rsi4H < dynamicThreshold4H and rsi1D < dynamicThreshold1D and crossUnder1H
These features collectively aim to provide users with a more comprehensive view of market dynamics by incorporating recent performance and volatility considerations into the RSI analysis. Users can experiment with these features to explore their impact on signal accuracy and overall indicator performance.
Indicator Placement for Enhanced Visibility
Overview
The design choice to position the "Advanced Dynamic Threshold RSI" indicator both on the main chart and beneath it has been carefully considered to address specific challenges related to visibility and scaling, providing users with an improved analytical experience.
Challenges Faced
1. Differing Scaling of RSI Results:
RSI values for different timeframes (1-hour, 4-hour, and 1-day) often exhibit different scales, especially in markets like gold.
Attempting to display these RSIs on the same chart can lead to visibility issues, as the scaling differences may cause certain RSI lines to appear compressed or nearly invisible.
2. Candlestick Visibility vs. RSI Scaling:
Balancing the visibility of candlestick patterns with that of RSI values posed a unique challenge.
A single pane for both candlesticks and RSIs may compromise the clarity of either, particularly when dealing with assets that exhibit distinct volatility patterns.
Design Solution
Placing the buy/sell signals above/below the candles helps to maintain a clear association between the signals and price movements.
By allocating RSIs beneath the main chart, users can better distinguish and analyze the RSI values without interference from candlestick scaling.
Doubling the scaling of the 1-hour RSI (displayed in blue) addresses visibility concerns and ensures that it remains discernible even when compared to the other two RSIs: 4-hour RSI (orange) and 1-day RSI (green).
Bollinger Bands Module is optional, but is turned on as default. When the module is turned on, the users can see the upper Bollinger Band (green) and lower Bollinger Band (red) on the main chart to gain more insight into price actions of the candles.
User Flexibility
This dual-placement approach offers users the flexibility to choose their preferred visualization:
The main chart provides a comprehensive view of buy/sell signals in relation to candlestick patterns.
The area beneath the chart accommodates a detailed examination of RSI values, each in its own timeframe, without compromising visibility.
The chosen design optimizes visibility and usability, addressing the unique challenges posed by differing RSI scales and ensuring users can make informed decisions based on both price action and RSI dynamics.
Usage
Installation
To ensure you receive updates and enhancements seamlessly, follow these steps:
Open the TradingView platform.
Navigate to the "Indicators" tab in the top menu.
Click on "Community Scripts" and search for "Advanced Dynamic Threshold RSI Indicator."
Select the indicator from the search results and click on it to add to your chart.
This ensures that any future updates to the indicator can be easily applied, keeping you up-to-date with the latest features and improvements.
Review Code
Open TradingView and navigate to the Pine Editor.
Copy the provided script.
Paste the script into the Pine Editor.
Click "Add to Chart."
Configuration
The indicator offers several customizable settings:
RSI Length: Defines the length of the RSI calculation.
SMA Length: Sets the length of the SMA applied to the RSI.
Lookback Bars: Determines the number of bars used for recent performance analysis.
Threshold Multiplier: Adjusts the multiplier for dynamic threshold calculation.
Enable Bollinger Bands: Allows users to enable or disable Bollinger Bands integration.
Interpreting Signals
Buy Signal: Generated when RSI values are above dynamic thresholds and a crossover occurs.
Sell Signal: Generated when RSI values are below dynamic thresholds and a crossunder occurs.
Additional Information
The indicator plots scaled RSI lines for 1-hour, 4-hour, and 1-day timeframes.
Users can experiment with additional modules, such as machine-learning simulation, dynamic real-life improvements, or experimental signal filtering, depending on personal preferences.
Conclusion
The Advanced Dynamic Threshold RSI Indicator provides traders with a sophisticated tool for RSI-based analysis, offering a unique combination of dynamic thresholds, performance analysis, and optional Bollinger Bands integration. Traders can customize settings and experiment with additional modules to tailor the indicator to their trading strategy.
Disclaimer: Use of the Advanced Dynamic Threshold RSI Indicator
The Advanced Dynamic Threshold RSI Indicator is provided for educational and experimental purposes only. The indicator is not intended to be used as financial or investment advice. Trading and investing in financial markets involve risk, and past performance is not indicative of future results.
The creator of this indicator is not a financial advisor, and the use of this indicator does not guarantee profitability or specific trading outcomes. Users are encouraged to conduct their own research and analysis and, if necessary, consult with a qualified financial professional before making any investment decisions.
It is important to recognize that all trading involves risk, and users should only trade with capital that they can afford to lose. The Advanced Dynamic Threshold RSI Indicator is an experimental tool that may not be suitable for all individuals, and its effectiveness may vary under different market conditions.
By using this indicator, you acknowledge that you are doing so at your own risk and discretion. The creator of this indicator shall not be held responsible for any financial losses or damages incurred as a result of using the indicator.
Kind regards,
Ely

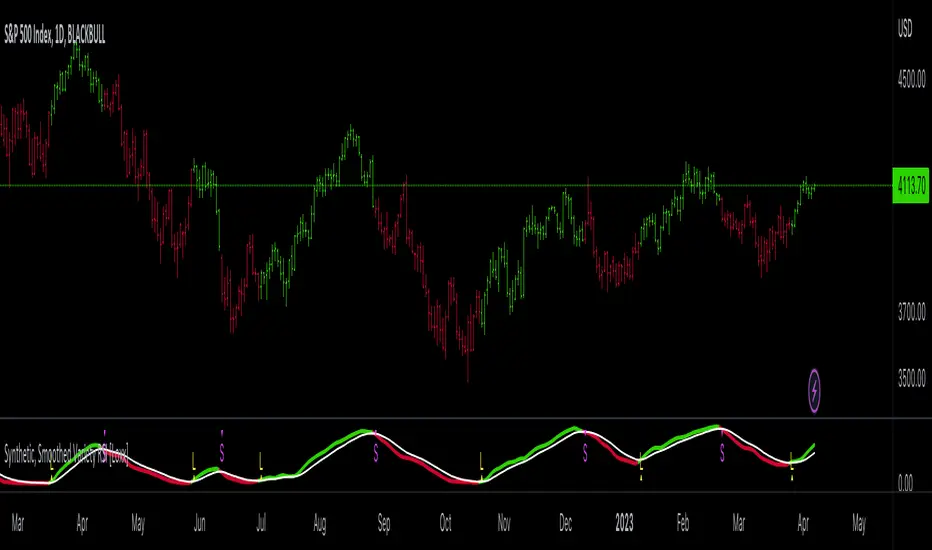
Synthetic, Smoothed Variety RSI [Loxx]Synthetic, Smoothed Variety RSI is an RSI indicator that combines three RSI calculations into one to create a synthetic RSI output.
How this is done:
1. Three EMAs are created using different period inputs
2. Three RSIs are created using different period inputs and the EMA output from the first step
3. These three RSIs are averaged to create the Synthetic, Smoothed Variety RSI
This indicator contains 7 different types of RSI:
RSX
Regular
Slow
Rapid
Harris
Cuttler
Ehlers Smoothed
What is RSI?
RSI stands for Relative Strength Index . It is a technical indicator used to measure the strength or weakness of a financial instrument's price action.
The RSI is calculated based on the price movement of an asset over a specified period of time, typically 14 days, and is expressed on a scale of 0 to 100. The RSI is considered overbought when it is above 70 and oversold when it is below 30.
Traders and investors use the RSI to identify potential buy and sell signals. When the RSI indicates that an asset is oversold, it may be considered a buying opportunity, while an overbought RSI may signal that it is time to sell or take profits.
It's important to note that the RSI should not be used in isolation and should be used in conjunction with other technical and fundamental analysis tools to make informed trading decisions.
What is RSX?
Jurik RSX is a technical analysis indicator that is a variation of the Relative Strength Index Smoothed ( RSX ) indicator. It was developed by Mark Jurik and is designed to help traders identify trends and momentum in the market.
The Jurik RSX uses a combination of the RSX indicator and an adaptive moving average (AMA) to smooth out the price data and reduce the number of false signals. The adaptive moving average is designed to adjust the smoothing period based on the current market conditions, which makes the indicator more responsive to changes in price.
The Jurik RSX can be used to identify potential trend reversals and momentum shifts in the market. It oscillates between 0 and 100, with values above 50 indicating a bullish trend and values below 50 indicating a bearish trend . Traders can use these levels to make trading decisions, such as buying when the indicator crosses above 50 and selling when it crosses below 50.
The Jurik RSX is a more advanced version of the RSX indicator, and while it can be useful in identifying potential trade opportunities, it should not be used in isolation. It is best used in conjunction with other technical and fundamental analysis tools to make informed trading decisions.
What is Slow RSI?
Slow RSI is a variation of the traditional Relative Strength Index ( RSI ) indicator. It is a more smoothed version of the RSI and is designed to filter out some of the noise and short-term price fluctuations that can occur with the standard RSI .
The Slow RSI uses a longer period of time than the traditional RSI , typically 21 periods instead of 14. This longer period helps to smooth out the price data and makes the indicator less reactive to short-term price fluctuations.
Like the traditional RSI , the Slow RSI is used to identify potential overbought and oversold conditions in the market. It oscillates between 0 and 100, with values above 70 indicating overbought conditions and values below 30 indicating oversold conditions. Traders often use these levels as potential buy and sell signals.
The Slow RSI is a more conservative version of the RSI and can be useful in identifying longer-term trends in the market. However, it can also be slower to respond to changes in price, which may result in missed trading opportunities. Traders may choose to use a combination of both the Slow RSI and the traditional RSI to make informed trading decisions.
What is Rapid RSI?
Same as regular RSI but with a faster calculation method
What is Harris RSI?
Harris RSI is a technical analysis indicator that is a variation of the Relative Strength Index ( RSI ). It was developed by Larry Harris and is designed to help traders identify potential trend changes and momentum shifts in the market.
The Harris RSI uses a different calculation formula compared to the traditional RSI . It takes into account both the opening and closing prices of a financial instrument, as well as the high and low prices. The Harris RSI is also normalized to a range of 0 to 100, with values above 50 indicating a bullish trend and values below 50 indicating a bearish trend .
Like the traditional RSI , the Harris RSI is used to identify potential overbought and oversold conditions in the market. It oscillates between 0 and 100, with values above 70 indicating overbought conditions and values below 30 indicating oversold conditions. Traders often use these levels as potential buy and sell signals.
The Harris RSI is a more advanced version of the RSI and can be useful in identifying longer-term trends in the market. However, it can also generate more false signals than the standard RSI . Traders may choose to use a combination of both the Harris RSI and the traditional RSI to make informed trading decisions.
What is Cuttler RSI?
Cuttler RSI is a technical analysis indicator that is a variation of the Relative Strength Index ( RSI ). It was developed by Curt Cuttler and is designed to help traders identify potential trend changes and momentum shifts in the market.
The Cuttler RSI uses a different calculation formula compared to the traditional RSI . It takes into account the difference between the closing price of a financial instrument and the average of the high and low prices over a specified period of time. This difference is then normalized to a range of 0 to 100, with values above 50 indicating a bullish trend and values below 50 indicating a bearish trend .
Like the traditional RSI , the Cuttler RSI is used to identify potential overbought and oversold conditions in the market. It oscillates between 0 and 100, with values above 70 indicating overbought conditions and values below 30 indicating oversold conditions. Traders often use these levels as potential buy and sell signals.
The Cuttler RSI is a more advanced version of the RSI and can be useful in identifying longer-term trends in the market. However, it can also generate more false signals than the standard RSI . Traders may choose to use a combination of both the Cuttler RSI and the traditional RSI to make informed trading decisions.
What is Ehlers Smoothed RSI?
Ehlers smoothed RSI is a technical analysis indicator that is a variation of the Relative Strength Index ( RSI ). It was developed by John Ehlers and is designed to help traders identify potential trend changes and momentum shifts in the market.
The Ehlers smoothed RSI uses a different calculation formula compared to the traditional RSI . It uses a smoothing algorithm that is designed to reduce the noise and random fluctuations that can occur with the standard RSI . The smoothing algorithm is based on a concept called "digital signal processing" and is intended to improve the accuracy of the indicator.
Like the traditional RSI , the Ehlers smoothed RSI is used to identify potential overbought and oversold conditions in the market. It oscillates between 0 and 100, with values above 70 indicating overbought conditions and values below 30 indicating oversold conditions. Traders often use these levels as potential buy and sell signals.
The Ehlers smoothed RSI can be useful in identifying longer-term trends and momentum shifts in the market. However, it can also generate more false signals than the standard RSI . Traders may choose to use a combination of both the Ehlers smoothed RSI and the traditional RSI to make informed trading decisions.
Extras
Alerts
Signals
Loxx's Expanded Source Types, see here:
MTF RSI — Centered at Zero# 🌟 **MTF RSI — Centered at Zero(英語版 Description)**
**A multi–timeframe RSI tool designed for trend-filtered entries and safer reversal timing.
This script transforms both the current timeframe RSI and the 4H RSI by centering them at zero (RSI − 50), giving a clean, intuitive regime view.**
---
## 🔍 **Core Concept**
Traditional RSI fluctuates between 0–100, but the true trend cue lies in the relationship to 50.
By centering RSI at zero, you instantly see:
* **Above 0 → bullish pressure**
* **Below 0 → bearish pressure**
On top of this, the script plots the **4H RSI as a histogram**, allowing you to visually confirm whether the market is in a BUY-ONLY or SELL-ONLY environment before taking any signals.
---
## 🎯 **What This Script Helps You Do**
* Avoid dangerous counter-trend trades
* Identify high-quality reversal points only when aligned with the 4H trend
* Enter pullbacks or bounces with noticeably higher accuracy
* Visually detect regime strength and extreme conditions (RSI >70 / <30)
Even during aggressive trending markets, the combined filter
**(4H regime + local RSI extreme + initial reversal signal)**
keeps you only in high-probability opportunities.
---
## 💡 **Color Logic**
### Vertical stripe (per-bar):
* 🔴 **Overbought (RSI >70)** — red / pink
* 🔵 **Oversold (RSI <30)** — blue
* Colors become stronger when the 4H and current RSI extremes align
* Option to show history or only the most recent bar
### Histogram (4H RSI – 50):
* Pink column above 0 → bullish bias
* Blue column below 0 → bearish bias
### Pivot Signals:
* 🟠 **Buy Signal**: RSI crosses up from local weakness *AND* 4H is BUY-ONLY
* 🔴 **Sell Signal**: RSI crosses down from local strength *AND* 4H is SELL-ONLY
These signals often align with classical **Granville #4 / #8** (deep pullback reversals).
---
## ⏱️ **Timeframe Usage**
Works well on:
* **5m** for active traders
* **15m** for conservative entries
* **1H** for swing confirmation
All of them rely on the same principle:
**“Let the 4H trend guide the direction, and take only high-probability reversals.”**
---
## 🚀 **Best Use Case**
Enter only when:
1. 4H histogram clearly shows BUY-ONLY or SELL-ONLY
2. Local RSI hits extreme zones
3. A bounce or breakdown occurs
4. Your stop-loss is clearly defined beneath the reversal structure
This combination creates consistently **small losses, larger wins** —
ideal for systematic short-term trading.
---
---
# 🌟 **MTF RSI — Centered at Zero(日本語版 Description)**
**RSIを 50 でセンタリングすることで、
“相場が上に傾いているのか / 下に傾いているのか” を一瞬で判別できる、
マルチタイムフレーム対応のRSIトレンド・フィルタースクリプトです。**
---
## 🔍 **スクリプトの核心**
RSIの本質は「50を境に強弱が決まる」ことにあります。
そこで **RSI − 50** を使い、
* **0より上 → 上昇バイアス**
* **0より下 → 下降バイアス**
となるように変換しています。
4時間足RSIも同様にゼロ基準でヒストグラム化するため、
**いま市場の“支配方向(BUY ONLY / SELL ONLY)”がひと目で分かる仕様** にしています。
---
## 🎯 **このスクリプトが解決する課題**
* トレンドに逆らった“危険な逆張り”を避けられる
* 4時間足トレンドと一致したときだけ反転シグナルが出る
* 押し目買い・戻り売りの精度が高まる
* 極端ゾーン(RSI >70 / <30)を自動で縦ストライプ表示
特に、
**4時間足のトレンド + 極端ゾーン + 初動シグナル(RSI反転)**
のセットアップは実戦での成功率が非常に高いです。
---
## 🎨 **カラーの意味**
### ◆ 縦ストライプ(バー単位)
* 🔴 RSI > 70 → オーバーボート(赤/ピンク)
* 🔵 RSI < 30 → オーバーソールド(青)
* 4Hも同方向の極端であれば濃く表示
* 「過去の塗りを消すモード」搭載(今バーのみ表示)
### ◆ 4時間足ヒストグラム(RSI − 50)
* ピンク:上昇圧力(BUY ONLY に近い)
* 青:下降圧力(SELL ONLY に近い)
### ◆ 反転シグナル
* 🟠 BUY:RSIが弱い領域から上抜け + 4H BUY ONLY
* 🔴 SELL:RSIが強すぎる領域から下抜け + 4H SELL ONLY
これはグランビルの4番/8番(深い押し・戻りの反転)にも一致します。
---
## 🕒 **推奨タイムフレーム**
* 5分足:素早くエントリーしたい人
* 15分足:最も安定
* 1時間足:ゆったり目線のスイング向け
---
## 🚀 **ベストな使い方**
以下の条件が揃ったとき、統計的に最も強いエントリーになります:
1. 4時間足RSIヒストグラムが BUY ONLY / SELL ONLY
2. 15分足RSIが極端ゾーンに到達
3. 反転初動のシグナルが点灯
4. 損切りラインが構築できている
(直近安値・高値のすぐ外側)
これにより、**損小利大でブレの少ないトレード** が可能になります。

Logit RSI [AdaptiveRSI]The traditional 0–100 RSI scale makes statistical overlays, such as Bollinger Bands or even moving averages, technically invalid. This script solves this issue by placing RSI on an unbounded, continuous scale, enabling these tools to work as intended.
The Logit function takes bounded data, such as RSI values ranging from 0 to 100, and maps them onto an unbounded scale ranging from negative infinity (−∞) to positive infinity (+∞).
An RSI reading of 50 becomes 0 on the Logit scale, indicating a balanced market. Readings above 50 map to positive Logit values (price above Wilder’s EMA / RSI above 50), while readings below 50 map to negative values (price below Wilder’s EMA / RSI below 50).
For the detailed formula, which calculates RSI as a scaled distance from Wilder’s EMA, check the RSI
: alternative derivation script.
The main issue with the 0–100 RSI scale is that different lookback periods produce very different distributions of RSI values. The histograms below illustrate how often RSIs of various lengths spend time within each 5-point range.
On RSI(2), the tallest bars appear at the edges (0–5 and 95–100), meaning short-term RSI spends most of its time at the extremes. For longer lookbacks, the bars cluster around the center and rarely reach 70 or 30.
This behavior makes it difficult to generalize the two most common RSI techniques:
Fixed 70/30 thresholds: These overbought and oversold levels only make sense for short- or mid-range lookbacks (around the low teens). For very short periods, RSI spends most of its time above or below these levels, while for long-term lookbacks, RSI rarely reaches them.
Bollinger Bands (±2 standard deviations): When applied directly to RSI, the bands often extend beyond the 0–100 limits (especially for short-term lookbacks) making them mathematically invalid. While the issue is less visible on longer settings, it remains conceptually incorrect.
To address this, we apply the Logit Transform :
Logit RSI = LN(RSI / (100 − RSI))
The transformed data fits a smooth bell-shaped curve, allowing statistical tools like Bollinger Bands to function properly for the first time.
Why Logit RSI Matters:
Makes RSI statistically consistent across all lookback periods.
Greatly improves the visual clarity of short-term RSIs
Allows proper use of volatility tools (like Bollinger Bands) on RSI.
Replaces arbitrary 70/30 levels with data-driven thresholds.
Simplifies RSI interpretation for both short- and long-term analysis.
INPUTS:
RSI Length — set the RSI lookback period used in calculations.
RSI Type — choose between Regular RSI or Logit RSI .
Plot Bollinger Bands — ON/OFF toggle to overlay statistical envelopes around RSI or Logit RSI.
SMA and Standard Deviation Length — defines the lookback period for both the SMA (Bollinger Bands midline) and Standard Deviation calculations.
Standard Deviation Multiplier — controls the width of the Bollinger Bands (e.g., 2.0 for ±2σ).
While simple, the Logit transformation represents an unexplored yet powerful mathematically grounded improvement to the classic RSI.
It offers traders a structured, intuitive, and statistically consistent way to use RSI across all timeframes.
I welcome your feedback, suggestions, and code improvements—especially regarding performance and efficiency. Your insights are greatly appreciated.

Enhanced Holt-Winters RSI [BOSWaves]Enhanced Holt-Winters RSI – Next-Level Momentum Smoothing & Signal Precision
Overview
The Enhanced Holt-Winters RSI transforms the classic Relative Strength Index into a robust, lag-minimized momentum oscillator through Holt-Winters triple exponential smoothing. By modeling the level, trend, and cyclical behavior of the RSI series, this indicator delivers smoother, more responsive signals that highlight overbought/oversold conditions, momentum shifts, and high-conviction trading setups without cluttering the chart with noise.
Unlike traditional RSI, which reacts to historical data and produces frequent whipsaws, the Enhanced Holt-Winters RSI filters transient price fluctuations, enabling traders to detect emerging momentum and potential reversal zones earlier.
Theoretical Foundation
The traditional RSI measures relative strength by comparing average gains and losses, but suffers from:
Lag in trend recognition : Signals often arrive after momentum has shifted.
Noise sensitivity : High-frequency price movements generate unreliable crossovers.
Limited insight into structural market shifts : Standard RSI cannot contextualize cyclical or momentum patterns.
The Enhanced Holt-Winters RSI addresses these limitations by applying triple exponential smoothing directly to the RSI series. This decomposes the series into:
Level (Lₜ) : Represents the smoothed central tendency of RSI.
Trend (Tₜ) : Captures rate-of-change in smoothed momentum.
Seasonal Component (Sₜ) : Models short-term cyclical deviations in momentum.
By incorporating these elements, the oscillator produces smoothed RSI values that react faster to emerging trends while suppressing erratic noise. Its internal forecast is mathematical, influencing the smoothed RSI output and signals, rather than being directly plotted.
How It Works
The Enhanced Holt-Winters RSI builds its signal framework through several layers:
1. Base RSI Calculation
Computes standard RSI over the selected period as the primary momentum input.
2. Triple Exponential Smoothing (Holt-Winters)
The RSI is smoothed recursively to extract underlying momentum structure:
Level, trend, and seasonal components are combined to produce a smoothed RSI.
This internal smoothing reduces lag and enhances signal reliability.
3. Momentum Analysis
Short-term momentum shifts are tracked via a moving average of the smoothed RSI, highlighting acceleration or deceleration in directional strength.
4. Volume Confirmation (Optional)
Buy/sell signals can be filtered through a configurable volume threshold, ensuring only high-conviction moves trigger alerts.
5. Visual Output
Colored Candles : Represent overbought (red), oversold (green), or neutral (yellow) conditions.
Oscillator Panel : Plots the smoothed RSI with dynamic color coding for immediate trend context.
Signals : Triangular markers indicate bullish or bearish setups, with stronger signals flagged in extreme zones.
Interpretation
The Enhanced Holt-Winters RSI provides a multi-dimensional perspective on price action:
Trend Strength : Smoothed RSI slope and color coding reflect the direction and momentum intensity.
Momentum Shifts : Rapid changes in the smoothed RSI indicate emerging strength or weakness.
Overbought/Oversold Zones : Highlight areas where price is stretched relative to recent momentum.
High-Conviction Signals : Combined with volume filtering, markers indicate optimal entries/exits.
Cycle Awareness : Smoothing reveals structural patterns, helping traders avoid reacting to noise.
By combining these elements, traders gain early insight into market structure and momentum without relying on raw, lag-prone RSI data.
Strategy Integration
The Enhanced Holt-Winters RSI can be applied across trading styles:
Trend Following
Enter when RSI is aligned with price momentum and color-coded signals confirm trend direction.
Strong slope in the smoothed RSI signals trend continuation.
Reversal Trading
Look for RSI extremes with momentum shifts and strong signal markers.
Compression in oscillator values often precedes reversal setups.
Breakout Detection
Oscillator flattening in neutral zones followed by directional expansion indicates potential breakout conditions.
Multi-Timeframe Confluence
Higher timeframes provide directional bias; lower timeframes refine entry timing using smoothed RSI dynamics.
Technical Implementation Details
Input Source : Close, open, high, low, or price.
Smoothing : Holt-Winters triple exponential smoothing applied to RSI.
Parameters :
Level (α) : Controls smoothing of RSI.
Trend (β) : Adjusts responsiveness to momentum changes.
Seasonal Length : Defines cycles for short-term adjustments.
Delta Smoothing : Reduces choppiness in smoothed RSI difference.
Outputs :
Smoothed RSI
Colored candles and oscillator panel
Buy/Sell signal markers (with optional strength filtering)
Volume Filtering : Optional threshold to confirm signals.
Optimal Application Parameters
Asset-Specific Guidance:
Forex : Use moderate smoothing (α, β) to capture medium-term momentum swings while filtering minor price noise. Works best when combined with volume or volatility filters.
Equities : Balance responsiveness and smoothness to identify sustained sector momentum or rotational shifts; ideal for capturing clean directional transitions.
Cryptocurrency : Increase smoothing parameters slightly to stabilize RSI during extreme volatility; optional volume confirmation can help filter false signals.
Futures/Indices : Lower smoothing sensitivity emphasizes macro momentum and structural trend durability over short-term fluctuations.
Timeframe Optimization:
Scalping (1-5m) : Use higher sensitivity (lower smoothing factors) to react quickly to micro-momentum reversals.
Intraday (15m-1h) : Balance smoothing and responsiveness for detecting short-term acceleration and exhaustion zones.
Swing (4h-Daily) : Apply moderate smoothing to reveal underlying directional persistence and cyclical reversals.
Position (Daily-Weekly) : Use stronger smoothing to isolate dominant momentum trends and filter temporary pullbacks.
Integration Guidelines
Combine with trend filters (EMAs, SuperSmoother MA, ATR-based tools) for confirmation.
Use volume and signal strength markers to filter low-conviction trades.
Slope, color, and signal alignment can guide entry, stop placement, and scaling.
Disclaimer
The Enhanced Holt-Winters RSI is a technical analysis tool, not a guaranteed profit system. Effectiveness depends on proper settings, market structure, and disciplined risk management. Always backtest before live trading.

MULTI-CONDITION RSI SIGNAL GENERATOR═══════════════════════════════════════════════
MULTI-CONDITION RSI SIGNAL GENERATOR
═══════════════════════════════════════════════
OVERVIEW:
This indicator generates trading signals based on Relative Strength Index (RSI) movements with multiple confirmation layers designed to filter false signals and identify high-probability reversal opportunities.
═══════════════════════════════════════════════
WHAT MAKES THIS ORIGINAL:
═══════════════════════════════════════════════
Unlike basic RSI indicators that simply plot overbought/oversold crossovers, this system combines FOUR distinct confirmation mechanisms:
1. PERSISTENCE FILTERING - Requires RSI to remain in extreme zones for a minimum duration
2. LOOKBACK VALIDATION - Verifies recent extreme zone visits before signaling
3. DIVERGENCE DETECTION - Identifies price/RSI divergence for stronger signals
4. MOMENTUM CONFIRMATION - Provides trend-continuation entries via midline crosses
This multi-layered approach significantly reduces whipsaw trades that plague simple RSI crossover systems.
═══════════════════════════════════════════════
HOW IT WORKS (TECHNICAL METHODOLOGY):
═══════════════════════════════════════════════
STEP 1: RSI CALCULATION
- Standard RSI calculation using user-defined period (default: 14)
- Monitors two extreme zones: Overbought (default: 70) and Oversold (default: 30)
STEP 2: PERSISTENCE FILTERING
The script counts how many bars RSI has spent in extreme zones within the lookback period:
- For overbought signals: Counts bars where RSI > 70
- For oversold signals: Counts bars where RSI < 30
- Signal only triggers if count >= Minimum Duration (default: 4 bars)
This filters out brief spikes that immediately reverse, focusing on sustained extreme conditions that are more likely to lead to genuine reversals.
STEP 3: LOOKBACK VALIDATION
- Checks if RSI reached extreme zones within the Lookback Bars period (default: 20)
- Uses ta.highest() and ta.lowest() functions to verify recent extremes
- Ensures we're trading reversals from meaningful extremes, not random crossovers
STEP 4: BASIC SIGNAL GENERATION
- BUY SIGNAL: RSI crosses above the oversold level (30) after meeting persistence and lookback conditions
- SELL SIGNAL: RSI crosses below the overbought level (70) after meeting persistence and lookback conditions
STEP 5: DIVERGENCE DETECTION
The script identifies two types of divergence over the Divergence Lookback period (default: 5 bars):
A) BULLISH DIVERGENCE (indicates potential upward reversal):
- Price makes a lower low (current low < previous low)
- RSI makes a higher low (current RSI low > previous RSI low)
- Suggests weakening downward momentum
B) BEARISH DIVERGENCE (indicates potential downward reversal):
- Price makes a higher high (current high > previous high)
- RSI makes a lower high (current RSI high < previous RSI high)
- Suggests weakening upward momentum
STEP 6: STRONG SIGNAL CONFIRMATION
- STRONG BUY: Basic buy signal + bullish divergence present
- STRONG SELL: Basic sell signal + bearish divergence present
- These represent the highest-probability setups
STEP 7: MOMENTUM SIGNALS (OPTIONAL)
- MOMENTUM BUY: RSI crosses above 50 after being oversold (trend continuation)
- MOMENTUM SELL: RSI crosses below 50 after being overbought (trend continuation)
- Smaller signals for traders who want trend-following entries
═══════════════════════════════════════════════
SIGNAL TYPES AND VISUAL INDICATORS:
═══════════════════════════════════════════════
📈 GREEN TRIANGLE (below bar) - Standard Buy Signal
RSI crossed above oversold level with confirmation filters
📉 RED TRIANGLE (above bar) - Standard Sell Signal
RSI crossed below overbought level with confirmation filters
🔵 BLUE TRIANGLE (below bar) - Strong Buy Signal
Buy signal + bullish divergence (HIGHEST PRIORITY)
🟣 PURPLE TRIANGLE (above bar) - Strong Sell Signal
Sell signal + bearish divergence (HIGHEST PRIORITY)
🟢 GREEN CIRCLE (small) - Momentum Buy
RSI crosses above 50 after oversold conditions
🔴 RED CIRCLE (small) - Momentum Sell
RSI crosses below 50 after overbought conditions
BACKGROUND SHADING:
- Light red background: RSI currently overbought
- Light green background: RSI currently oversold
═══════════════════════════════════════════════
PARAMETER SETTINGS:
═══════════════════════════════════════════════
1. OVERBOUGHT LEVEL (default: 70, range: 50-90)
- Higher values = fewer but stronger overbought signals
- Lower values = more sensitive to overbought conditions
- Recommended: 70 for standard markets, 80 for crypto/volatile assets
2. OVERSOLD LEVEL (default: 30, range: 10-50)
- Lower values = fewer but stronger oversold signals
- Higher values = more sensitive to oversold conditions
- Recommended: 30 for standard markets, 20 for crypto/volatile assets
3. RSI PERIOD (default: 14, range: 2-50)
- Standard RSI calculation period
- Lower = more sensitive/faster signals
- Higher = smoother/slower signals
- Recommended: 14 (industry standard)
4. MINIMUM DURATION (default: 4, range: 1-20)
- Required bars in extreme zone before signal
- Higher values = fewer signals but better quality
- Lower values = more signals but more false positives
- Recommended: 3-5 for day trading, 5-10 for swing trading
5. LOOKBACK BARS (default: 20, range: 5-100)
- How far back to check for extreme zone visits
- Should match your typical trading timeframe
- Recommended: 20 for intraday, 50 for daily charts
6. DIVERGENCE LOOKBACK (default: 5, range: 2-20)
- Period for comparing price/RSI highs and lows
- Lower values = more frequent divergence signals
- Higher values = more significant divergences
- Recommended: 5-10 depending on timeframe
═══════════════════════════════════════════════
HOW TO USE THIS INDICATOR:
═══════════════════════════════════════════════
RECOMMENDED TRADING APPROACH:
1. PRIMARY ENTRIES: Focus on Strong Buy/Sell signals (blue/purple triangles)
- These have the highest win rate due to divergence confirmation
- Wait for price action confirmation (support/resistance, candlestick patterns)
2. SECONDARY ENTRIES: Regular Buy/Sell signals (green/red triangles)
- Use these when Strong signals are infrequent
- Require additional confirmation from other indicators or chart patterns
3. TREND CONTINUATION: Momentum signals (small circles)
- Best used when overall trend is clear
- Not recommended for reversal trading
4. FILTER TRADES: Use background shading as context
- Be cautious entering longs when background is red (overbought)
- Be cautious entering shorts when background is green (oversold)
RISK MANAGEMENT GUIDELINES:
- Never risk more than 2-5% of capital per trade
- Use stop losses below recent swing lows (buys) or above swing highs (sells)
- Target at least 1.5:1 reward-to-risk ratio
- Consider position sizing based on signal strength
TIMEFRAME RECOMMENDATIONS:
- 15min - 1hour: Day trading with adjusted parameters (lower minimum duration)
- 4hour - Daily: Swing trading with default parameters
- Weekly: Position trading with increased lookback periods
COMPLEMENTARY TOOLS:
This indicator works best when combined with:
- Support and resistance levels
- Trend indicators (moving averages, trend lines)
- Volume analysis
- Price action patterns (engulfing candles, pin bars)
═══════════════════════════════════════════════
LIMITATIONS AND CONSIDERATIONS:
═══════════════════════════════════════════════
- This is NOT a standalone trading system - requires additional analysis
- RSI-based strategies perform best in ranging/choppy markets
- May generate fewer signals in strong trending markets
- Divergence signals can be early - wait for price confirmation
- Not recommended for highly illiquid assets
- Backtest on your specific market before live trading
- No indicator is 100% accurate - always use proper risk management
═══════════════════════════════════════════════
TECHNICAL NOTES:
═══════════════════════════════════════════════
- Code is original and does not reuse external libraries
- Uses Pine Script v5 native functions only
- Alert conditions included for all signal types
- No repainting - signals appear and remain fixed
- Efficient calculation methods minimize processing load
═══════════════════════════════════════════════
ALERT SETUP:
═══════════════════════════════════════════════
Four alert conditions are available:
1. "Buy Alert" - Triggers on standard buy signals
2. "Sell Alert" - Triggers on standard sell signals
3. "Strong Buy Alert" - Triggers on divergence-confirmed buy signals
4. "Strong Sell Alert" - Triggers on divergence-confirmed sell signals
To set up alerts: Right-click chart → Add Alert → Select desired condition
═══════════════════════════════════════════════
This indicator is provided for educational and informational purposes. Always practice proper risk management and never trade with money you cannot afford to lose.

15-Min RSI Scalper [SwissAlgo]15-Min RSI Scalper
Tracks RSI Momentum Loss and Gain to Generate Signals
-------------------------------------------------------
WHAT THIS INDICATOR CALCULATES
This indicator attempts to identify RSI directional changes (RSI momentum) using a step-by-step "ladder" method. It reads RSI(14) from the next higher timeframe relative to your chart. On a 15-minute chart, it uses 1-hour RSI. On a 5-minute chart, it uses 15-minute RSI, and so on.
How the ladder logic works:
The indicator doesn't track RSI all the time. It only starts tracking when RSI crosses into potentially extreme territory (these are called "events" in the code):
For sell signals : when RSI crosses above a dynamic upper threshold (typically between 60-80, calculated as the 90th percentile of recent RSI)
For buy signals : when RSI crosses below a dynamic lower threshold (typically between 20-40, calculated as the 10th percentile of recent RSI)
Once tracking begins, RSI movement is divided into 2-point steps (boxes). The indicator counts how many boxes RSI climbs or falls.
A signal generates only when:
RSI reverses direction by at least 2 boxes (4 RSI points) from its extreme
RSI holds that reversal for 3 consecutive confirmed bars
Example: Dynamic threshold is at 68. RSI crosses above 68 → tracking starts. RSI climbs to 76 (4 boxes up). Then it drops back to 72 and stays below that level for 3 bars → sell signal prints. The buy signal works the same way in reverse.
-------------------------------------------------------
SIGNAL GENERATION METHODOLOGY
Sell Signal (Red Triangle)
RSI crosses above a dynamic start level (calculated as the 90th percentile of the last 1000 bars, constrained between 60-80)
Indicator tracks upward progression in 2-point boxes
RSI reverses and drops below a boundary 2 boxes below the highest box reached
RSI remains below that boundary for 3 confirmed bars
Red triangle plots above price
Reset condition: RSI returns below 50
Buy Signal (Green Triangle)
RSI crosses below a dynamic start level (10th percentile of last 1000 bars, constrained between 20-40)
Indicator tracks downward progression in 2-point boxes
RSI reverses and rises above a boundary 2 boxes above the lowest box reached
RSI remains above that boundary for 3 confirmed bars
Green triangle plots below price
Reset condition: RSI returns above 50
-------------------------------------------------------
TECHNICAL PARAMETERS
All parameters are hardcoded:
RSI Period: 14
Box Size: 2 RSI points
Reversal Threshold: 2 boxes (4 RSI points)
Confirmation Period: 3 bars
Reset Level: RSI 50
Sell Start Range: 60-80 (dynamic)
Buy Start Range: 20-40 (dynamic)
Lookback for Percentile: 1000 bars
Note: Since the code is open source, users can modify these hardcoded values directly in the script to adjust sensitivity. For example, increasing the confirmation period from 3 to 5 bars will produce fewer but more conservative signals. Decreasing the box size from 2 to 1 will make the indicator more responsive to smaller RSI movements.
-------------------------------------------------------
KEY FEATURES
Automatic Higher Timeframe RSI
When applied to a 15-minute chart, the indicator automatically reads 1-hour RSI data. This is the next standard timeframe above 15 minutes in the indicator's logic.
Dynamic Adaptive Start Levels
Sell signals use the 90th percentile of RSI over the last 1000 bars, constrained between 60-80. Buy signals use the 10th percentile, constrained between 20-40. These thresholds recalculate on each bar based on recent data.
Ladder Box System
RSI movements are tracked in 2-point boxes. The indicator requires a 2-box reversal followed by 3 consecutive bars maintaining that reversal before generating a signal.
Dual Signal Output
Red down-triangles plot above price when the sell signal conditions are met. Green up-triangles plot below the price when buy signal conditions are met.
-------------------------------------------------------
REPAINTING
This indicator does not repaint. All calculations use "barstate.isconfirmed" to ensure signals appear only on closed bars. The request.security() call uses lookahead=barmerge.lookahead_off to prevent forward-looking bias.
-------------------------------------------------------
INTENDED CHART TIMEFRAME
This indicator is designed for use on 15-minute charts. The visual reminder table at the top of the chart indicates this requirement.
On a 15-minute chart:
RSI data comes from the 1-hour timeframe
Signals reflect 1-hour momentum shifts
3-bar confirmation equals 45 minutes of price action
Using it on other timeframes will change the higher timeframe RSI source and may produce different behavior.
-------------------------------------------------------
WHAT THIS INDICATOR DOES NOT DO
Does not predict future price movements
Does not provide entry or exit advice
Does not guarantee profitable trades
Does not replace comprehensive technical analysis
Does not account for fundamental factors, news events, or market structure
Does not adapt to all market conditions equally
-------------------------------------------------------
EDUCATIONAL USE
This indicator demonstrates one approach to momentum reversal detection using:
Multi-timeframe analysis
Adaptive thresholds via percentile calculation
Step-wise momentum tracking
Multi-bar confirmation logic
It is designed as a technical study, not a trading system. Signals represent calculated conditions based on RSI behavior, not trade recommendations. Always do your own analysis before taking market positions.
-------------------------------------------------------
RISK DISCLOSURE
Trading involves substantial risk of loss. This indicator:
Is for educational and informational purposes only
Does not constitute financial, investment, or trading advice
Should not be used as the sole basis for trading decisions
Has not been tested across all market conditions
May produce false signals, late signals, or no signals in certain conditions
Past performance of any indicator does not predict future results. Users must conduct their own analysis and risk assessment before making trading decisions. Always use proper risk management, including stop losses and position sizing appropriate to your account and risk tolerance.
MIT LICENSE
This code is open source and provided as-is without warranties of any kind. You may use, modify, and distribute it freely under the MIT License.

Synthetic Point & Figure on RSIHere is a detailed description and user guide for the Synthetic Point & Figure RSI indicator, including how to use it for long and short trade considerations:
*
## Synthetic Point & Figure RSI Indicator – User Guide
### What It Is
This indicator applies classic Point & Figure (P&F) charting logic to the Relative Strength Index (RSI) instead of price. It transforms the RSI into synthetic “P&F candles” that filter out noise and highlight significant momentum moves and reversals based on configurable box size and reversal settings.
### How It Works
- The RSI is calculated normally over the selected length.
- The P&F engine tracks movements in the RSI above or below a defined “box size,” creating columns that switch direction only after a larger reversal.
- The synthetic candles connect these filtered RSI values visually, reducing false noise and emphasizing strong RSI trends.
- Optional EMA and SMA overlays on the synthetic P&F RSI allow smoother trend signals.
- Reference RSI levels at 33, 40, 50, 60, and 66 provide further context for momentum strength.
### How to Use for Trading
#### Long (Buy) Considerations
- The synthetic P&F RSI candle direction flips to *up (green candles)* indicating strength in momentum.
- Look for the RSI P&F value moving above the *40 or 50 level*, suggesting increasing bullish momentum.
- Confirmation is stronger if the synthetic RSI is above the EMA or SMA overlays.
- Ideal entries are after a reversal from a synthetic P&F downtrend (red candles) to an uptrend (green candles) near or above these levels.
#### Short (Sell) Considerations
- The candle direction flips to *down (red candles)*, showing weakening momentum or bearish reversal.
- Monitor if the synthetic RSI falls below the *60 or 50 level*, signaling momentum loss.
- Confirm bearish bias if the price is below the EMA or SMA overlays.
- Exit or short positions are signaled when the synthetic candle reverses from green to red near or below these threshold levels.
### Important RSI Levels to Watch
- *Level 33*: Lower bound indicating deep oversold conditions.
- *Level 40*: Early bullish zone suggesting momentum improvement.
- *Level 50*: Neutral midpoint; crossing above often signals bullish strength, below signals weakness.
- *Level 60*: Advanced bullish momentum; breaking below signals potential reversal.
- *Level 66*: Strong overbought area warning of possible pullback.
### Tips
- Use in conjunction with price action analysis and other volume/trend indicators for higher conviction.
- Adjust box size and reversal settings based on instrument volatility and timeframe for ideal filtering.
- The P&F RSI is best for identifying sustained momentum trends and avoiding false RSI whipsaws.
- Combine this indicator’s signals with stop-loss and risk management strategies.
*
This indicator converts RSI momentum analysis into a simplified, noise-filtered P&F chart format, helping traders better visualize and trade momentum shifts. It is especially useful when RSI signal noise can cause confusion in volatile markets.
Let me know if you want me to generate a shorter summary or code alerts based on these levels!
Sources
Relative Strength Index (RSI) — Indicators and Strategies in.tradingview.com
Indicators and strategies in.tradingview.com
Relative Strength Index (RSI) Indicator: Tutorial www.youtube.com
Stochastic RSI (STOCH RSI) in.tradingview.com
RSI Strategy docs.algotest.in
Stochastic RSI Indicator: Tutorial www.youtube.com
Relative Strength Index (RSI): What It Is, How It Works, and ... www.investopedia.com
rsi — Indicators and Strategies in.tradingview.com
Relative Strength Index (RSI) in.tradingview.com
Relative Strength Index (RSI) — Indicators and Strategies www.tradingview.com

MTF RSI MA System + Adaptive BandsMTF RSI MA System + Adaptive Bands
Overview
MTF RSI MA System + Adaptive Bands is a highly customizable Pine Script indicator for traders seeking a versatile tool for multi-timeframe (MTF) analysis. Unlike traditional RSI, it focuses on the Moving Average of RSI (RSI MA), delivering smoother and more flexible trading signals. The main screenshot displays the indicator in two panels to showcase its diverse capabilities.
Important: Timeframes do not adjust automatically – users must manually set them to match the chart’s timeframe.
Features
Core Component: Built around RSI MA, not raw RSI, for smoother trend signals.
Multi-Timeframe: Analyze RSI MA across three customizable timeframes (default: 4H, 8H, 12H).
Adaptive Bands: Three band calculation methods (Fixed, Percent, StdDev) for dynamic signals.
Flexible Signals: Generated via RSI MA crossovers, band interactions, or directional alignment across timeframes.
Background Coloring: Highlights when RSI MAs across timeframes move in the same direction, aiding trend confirmation.
Screenshot Panels Configuration
Upper Panel: Shows RSI, RSI MA, and fixed bands for reversal strategies (RSI crossing bands).
Lower Panel: Displays three RSI MAs (Alligator-style) for trend-following, with background coloring for directional alignment.
Band Calculation Methods
The indicator offers three ways to calculate bands around RSI MA, each with unique characteristics:
Fixed Bands
Set at a fixed point value (default: 10) above and below RSI MA.
Example: If RSI MA = 50, band value = 10 → upper band = 60, lower = 40.
Use Case: Best for stable markets or fixed-range preferences.
Tip: Adjust the band value to widen or narrow the range based on asset volatility.
Percent Bands
Calculated as a percentage of RSI MA (default: 10%).
Example: If RSI MA = 50, band value = 10% → upper band = 55, lower = 45.
Use Case: Ideal for assets with varying volatility, as bands scale with RSI MA.
Tip: Experiment with percentage values to match typical price swings.
Standard Deviation Bands (StdDev)
Based on RSI’s standard deviation over the MA period, multiplied by a user-defined factor (default: 10).
Example: If RSI MA = 50, standard deviation = 5, factor = 2 → upper band = 60, lower = 40.
Important: The default value (10) may produce wide bands. Reduce to 1–2 for tighter, practical bands.
Use Case: Best for dynamic markets with fluctuating volatility.
Configuration Options
RSI Length: Set RSI calculation period (default: 20).
MA Length: Set RSI MA period (default: 20).
MA Type: Choose SMA or EMA for RSI MA (default: EMA).
Timeframes: Configure three timeframes (default: 4H, 8H, 12H) for MTF analysis.
Overbought/Oversold Levels: Optionally display fixed levels (default: 70/30).
Background Coloring: Enable/disable for each timeframe to highlight directional alignment.
How to Use
Add Indicator: Load it onto your TradingView chart.
Setup:
Reversals: Configure like the upper panel (RSI, RSI MA, bands) and watch for RSI crossing bands.
Trends: Configure like the lower panel (three RSI MAs) and look for fastest MA crossovers and background coloring.
Adjust Timeframes: Manually set tf1, tf2, tf3 (e.g., 1H, 2H, 4H on a 1H chart) to suit your strategy.
Adjust Bands: Choose band type (Fixed, Percent, StdDev) and value. For StdDev, reduce to 1–2 for tighter bands.
Experiment: Test settings to match your trading style, whether scalping, swing trading, or long-term.
Notes
Timeframes: Always match tf1, tf2, tf3 to your chart’s needs, as they don’t auto-adjust.
StdDev Bands: Lower the default value (10) to avoid overly wide bands.
Versatility: Works across markets (stocks, forex, crypto).

Candle Count RSI📈 Candle Count RSI — A Dual-Perspective Momentum Engine
The Candle Count RSI is a custom-built momentum oscillator that expands on the classic Relative Strength Index (RSI) by introducing a directional-only variant that tracks the frequency of bullish or bearish closes, rather than price magnitude. It gives traders a second lens through which to evaluate momentum, trend conviction, and subtle divergences—often invisible to traditional price-based RSI.
💡 What Makes It Unique?
While the standard RSI is sensitive to the size of price changes, the Candle Count RSI is magnitude-blind. It counts candle closes above/below open over a lookback period, generating a purer signal of directional consistency. To enhance signal fidelity, it includes a streak amplifier, dynamically weighting extended runs of green or red candles to reflect intensity of market bias—without introducing artificial price sensitivity.
This dual-RSI approach allows for:
- Divergence detection between directional bias and price magnitude.
- Smoother trend confirmation in choppy markets.
- Cleaner visual cues using dynamic glow and background logic.
📐 How Standard RSI Actually Works (Not What You Think)
RSI doesn’t just check if price went up or down over a span—it checks each individual candle and tracks whether it closed higher or lower than the one before. Here's how it works under the hood:
1.) For each bar, it calculates the change from the previous close.
2.) It separates those changes into gains (upward moves) and losses (downward moves).
3.) Then it computes a smoothed average of those gains and losses (usually using an RMA).
4.) It calculates the Relative Strength (RS) as:
RS = AvgGain / AvgLoss
5.) Finally, it plugs that into the RSI formula:
RSI = 100 - (100 / (1 + RS))
⚖️ What Does the 50 Line Mean?
- The RSI scale runs from 0 to 100, but 50 is the true neutral zone:
- RSI > 50 means average gains outweigh average losses over the period.
- RSI < 50 means losses dominate.
- RSI ≈ 50? The market is balanced—momentum is indecisive, no clear trend bias.
- This makes 50 a powerful midline for trend filters, directional bias tools, and divergence detection—especially when paired with alternative RSI logic like Candle Count RSI.
🔧 Inputs and Customization
- Everything is fully modular and customizable:
🧠 Core Settings
- RSI Length: Used for both the standard RSI and Candle Count RSI.
📉 Standard RSI
- Classic RSI calculation based on price changes.
- Optional WMA smoothing to reduce noise.
- Glow effect toggle with custom intensity.
🕯 Candle Count RSI
- Computes RSI using only the count of up/down candles.
- Optional smoothing for stability.
- Amplifies streaks (e.g., multiple consecutive bullish candles increase strength).
- Glow effect toggle with adjustable strength.
🎇 Glow Visuals
- Background glow (subpane and/or main chart).
- Fades based on RSI distance from the 50 midpoint.
- Independent color settings for bull and bear bias.
🧬 Divergence Zones
- Detects when Candle RSI and Standard RSI diverge.
- Highlights:
- Bullish Divergence: Candle RSI > 50, Standard RSI < threshold.
- Bearish Divergence: Candle RSI < 50, Standard RSI > threshold.
- Background fill optionally shown in subpane and/or main chart.
📊 Directional Histogram
- MACD-style histogram showing the difference between the two RSI lines.
- Color-coded based on directional agreement:
- Both rising → green.
- Both falling → red.
- Conflict → yellow.
🧠 Under the Hood — How It Works
🔹 Standard RSI
- Classic ta.rsi() applied to close prices, optionally WMA-smoothed.
🔹 Candle Count RSI (CCR)
- Counts how many candles closed up/down over the period.
- Computes a magnitude-free RSI from these counts.
- Applies a streak-based multiplier to exaggerate trend strength during consecutive green/red runs.
- Optionally smoothed with WMA to create a clean signal line.
- This makes CCR ideal for detecting true directional bias without being faked out by volatile price spikes.
🔹 Divergence Logic
- When Candle RSI and Standard RSI disagree strongly across defined thresholds, background fills highlight early signs of momentum decay or hidden accumulation/distribution.
🔹 Glow Logic
- Glow zones are controlled by a master toggle and drawn with dynamic transparency:
- Further from 50 = stronger conviction = darker glow.
- Shows up in subpane and/or main chart depending on user preference.
📷 Suggested Use Case / Visual Setup
- Use in conjunction with your primary price action system.
- Watch for divergences between the Candle Count RSI and Standard RSI for early trend reversals.
- Use glow bias zones on the main chart to get subconscious directional cues during fast scalping.
- Histogram helps you confirm when both RSI variants agree—useful during strong trending conditions.
🛠️ Tip for Traders
- This tool isn’t trying to “predict” price. It’s designed to visualize hidden market psychology—when buyers are showing up with consistent pressure, or when momentum has a disconnect between conviction and magnitude. Use this to filter entries, spot weak rallies, or sense when a trend is about to break down.
⚠️ WARNING
- Not for use with Heikin Ashi, Renko, etc.).
🧠 Summary
Candle Count RSI is not just another mashup—it's a precision-built, dual-perspective oscillator that captures directional conviction using real candle behavior. Whether you're scalping intraday or swing trading momentum, this script helps clarify trend integrity and exposes hidden weaknesses with elegance and clarity.
—
🛠️ Built by: Sherlock_MacGyver
Feel free to share feedback or reach out if you'd like to collaborate on custom features.

Standard Deviation SMA RSI | mad_tiger_slayerOverview of the Script
The Standard Deviation SMA RSI is a custom TradingView indicator that enhances the Relative Strength Index (RSI) by incorporating a Simple Moving Average (SMA) and Standard Deviation bands . This approach smooths RSI calculations while factoring in volatility to provide clearer trend signals . Additionally, the indicator includes overbought and oversold thresholds, trend-coded RSI signals , and dynamic volatility bands for improved market analysis. This indicator is designed for swing traders and long-term investors looking to capture high-probability trend shifts.
How Do Traders Use the Standard Deviation SMA RSI?
In the provided chart image, the indicator is displayed on a price chart. Each visual component serves a distinct function in identifying trend conditions and volatility levels .
INTENDED USES
⚠️ NOT INTENDED FOR SCALPING
With the smoothing nature of the SMA-based RSI , this indicator is not designed for low-timeframe scalping. It works best on timeframes above 1-hour , with optimal performance in 12-hour, daily, and higher timeframes.
📈 TREND-FOLLOWING & MEAN REVERSION
The Standard Deviation SMA RSI functions as both a trend-following and mean-reverting indicator:
Trend-Following: Identifies strong, sustained trends using RSI signals and SMA confirmation.
Mean Reversion: Detects overbought/oversold conditions based on standard deviation bands and RSI thresholds .
A VISUAL REPRESENTATION OF INTENDED USES
RSI Line (Green/Pink/Gray): The RSI line dynamically changes color based on trend conditions .
Green RSI → Strong uptrend, RSI above the uptrend threshold.
Pink RSI → Downtrend, RSI below the downtrend threshold.
Gray RSI → Neutral state or consolidation.
If the SMA of RSI is above Long Threshold , the market is in a bullish trend.
If it’s below Short Threshold, bearish conditions prevail.
Threshold Lines (Teal/Purple):
Green Line → Long Entry Threshold
Red Line → Short Entry Threshold
Standard Deviation Bands:
Upper Band → Measures bullish volatility expansion
Lower Band → Measures bearish volatility expansion
Colored Candles: Price candles adjust color based on RSI conditions , visually aligning price action with market trends.
Indicator's Primary Elements
Input Parameters
The script includes several configurable settings, allowing users to tailor the indicator to different market environments:
RSI Length: Controls the number of periods for RSI calculations.
SMA Length: Defines the period for the SMA applied to RSI , creating a smoothed trend line.
Standard Deviation Period: Determines the length for volatility calculations.
Overbought and Oversold Levels:
Can be adjusted to customize sensitivity.
Standard Deviation SMA RSI Calculation
The SMA-based RSI smooths fluctuations while the standard deviation bands measure price volatility.
Upper and Lower Bands: Calculated by adding/subtracting standard deviation to/from the SMA-based RSI.
Trend Signal Calculation:
RSI is compared to uptrend and downtrend thresholds to determine buy/sell conditions.
Long and Short Conditions
Buy and sell conditions are determined by RSI relative to key thresholds :
Bullish Signal: RSI above long threshold & SMA confirms trend .
Bearish Signal: RSI below short threshold & SMA confirms downtrend .
Reversals: RSI entering overbought/oversold areas suggests possible trend reversals.
Conclusion
The Standard Deviation SMA RSI is a powerful trend-following and mean-reverting tool , offering enhanced insights into RSI movements, volatility, and market strength . By combining SMA smoothing, standard deviation bands, and dynamic thresholds , traders can better identify trend confirmations, reversals, and overextended conditions .
✅ Customizable settings allow traders to optimize sensitivity.
✅ Works best on high timeframes (12H, Daily, Weekly).
✅ Ideal for swing traders and long-term investors.
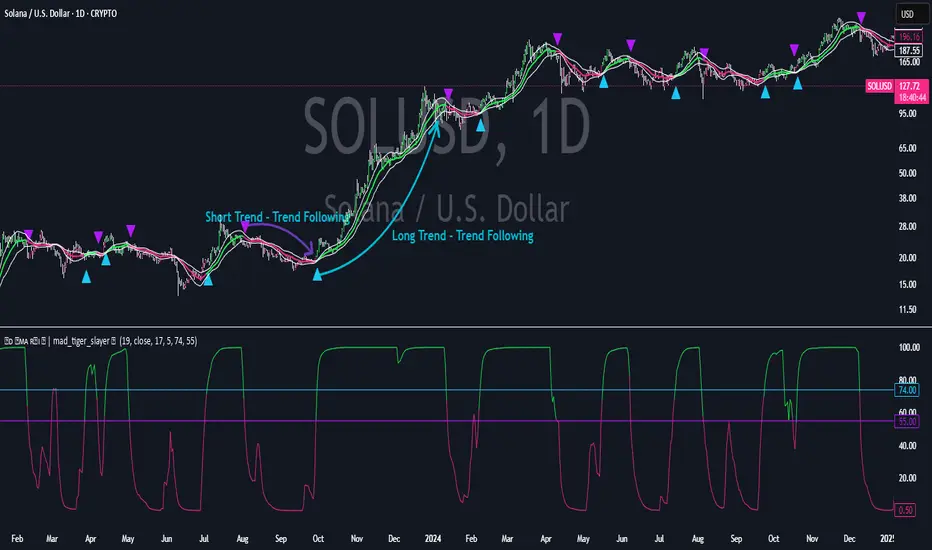
Waldo RSI :oWaldo RSI :o Indicator Guide
The Waldo RSI :o indicator is designed to complement the "Waldo RSI Overlay :o" by providing an RSI-based analysis on TradingView, focusing on macro shifts in market trends. Here's a comprehensive guide on how to use this indicator:
Key Features:
RSI Settings:
RSI Source: Choose from ON RSI, ON HIGH, ON LOW, ON CLOSE, or ON OPEN to determine how RSI calculates pivots.
RSI Settings:
Source: Default is (H+L)/2, but you can select any price for RSI calculation.
Length: Default RSI length is 7, which can be adjusted for sensitivity.
Trend Lines:
Show Trend Lines: Option to display trend lines based on RSI pivot points.
Zigzag Length: Determines pivot point sensitivity.
Confirm Length: Validates pivot points (default is 3).
Colors: Customize colors for Higher Highs (HH), Lower Highs (LH), Higher Lows (HL), and Lower Lows (LL) on the RSI.
Label Size and Line Width: Adjust the appearance of labels and lines.
Divergences:
Classic Divergences:
Show Classic Div: Toggle to reveal divergences where RSI and price move in opposite directions.
Colors: Set different colors for bullish and bearish divergence indicators.
Transparency and Line Width: Control the visual impact of divergence signals.
Hidden Divergences:
Similar settings for identifying hidden divergences, suggest trend continuation.
Breakout/Breakdown:
Show Breakout/Breakdown: Generates signals for RSI breakouts or breakdowns, used by "Waldo RSI Overlay :o" for visual chart signals.
Overbought/Oversold Zones:
Show Overbought and OverSold Zones: Highlights when RSI goes above 70 (overbought) or below 30 (oversold).
Moving Averages on RSI:
The default Moving Average (MA) settings are tailored to capture macro shifts in market trends:
Show Moving Averages: Option to overlay two MAs on the RSI for trend confirmation:
Fast RSI MA:
RSI Period: 50 (this is the period over which the RSI is calculated).
MA Length: 50 (the number of periods used for the moving average of the RSI).
Slow RSI MA:
RSI Period: 50 (same as fast for consistency in RSI calculation).
MA Length: 200 (longer term for capturing broader trends).
Crossover Signals: The RSI changes color from red to green based on these moving average crossovers:
When the Fast MA (50 period) crosses above the Slow MA (200 period), the RSI turns green, indicating potential bullish conditions or momentum shift.
Conversely, when the Fast MA crosses below the Slow MA, the RSI turns red, suggesting bearish conditions or a shift back towards a downtrend.
This 50-period RSI crossover setting is used to identify overall macro shifts in the market, providing a clear visual cue for traders looking at longer-term trends.
Ghost Lines (Optional):
Ghost Lines: Option to limit how far RSI trend lines extend, helping to keep the chart less cluttered.
How to Use the Indicator:
Setup:
Configure RSI by choosing the source and setting the length to match your trading style.
Set the zigzag and confirm lengths for appropriate pivot detection.
Trend Analysis:
Monitor the RSI for trend changes using the colored trend lines and labels.
Divergence Detection:
Look for RSI and price divergences to anticipate potential reversals or continuations.
Breakout/Breakdown:
Use these signals in conjunction with "Waldo RSI Overlay :o" for price action confirmation.
Overbought/Oversold:
Identify when the market might be due for a correction or continued momentum.
Moving Averages:
Focus on the color changes in RSI to understand macro trend shifts with the default 50/200 period setup.
Ghost Lines:
Enable for a cleaner chart if you don't need trend lines extending indefinitely.
Usage Tips:
Combine with other indicators for confirmation, as no single tool is foolproof.
Adjust settings to suit different market conditions or trading timeframes.
Use in tandem with "Waldo RSI Overlay :o" for a full trading signal system.
Remember, trading involves significant risk, and historical data does not guarantee future performance. Use this indicator as part of a broader trading strategy.

Machine Learning RSI [BackQuant]Machine Learning RSI
The Machine Learning RSI is a cutting-edge trading indicator that combines the power of Relative Strength Index (RSI) with Machine Learning (ML) clustering techniques to dynamically determine overbought and oversold thresholds. This advanced indicator adapts to market conditions in real-time, offering traders a robust tool for identifying optimal entry and exit points with increased precision.
Core Concept: Relative Strength Index (RSI)
The RSI is a well-known momentum oscillator that measures the speed and change of price movements, oscillating between 0 and 100. Typically, RSI values above 70 are considered overbought, and values below 30 are considered oversold. However, static thresholds may not be effective in all market conditions.
This script enhances the RSI by integrating a dynamic thresholding system powered by Machine Learning clustering, allowing it to adapt thresholds based on historical RSI behavior and market context.
Machine Learning Clustering for Dynamic Thresholds
The Machine Learning (ML) component uses clustering to calculate dynamic thresholds for overbought and oversold levels. Instead of relying on fixed RSI levels, this indicator clusters historical RSI values into three groups using a percentile-based initialization and iterative optimization:
Cluster 1: Represents lower RSI values (typically associated with oversold conditions).
Cluster 2: Represents mid-range RSI values.
Cluster 3: Represents higher RSI values (typically associated with overbought conditions).
Dynamic thresholds are determined as follows:
Long Threshold: The upper centroid value of Cluster 3.
Short Threshold: The lower centroid value of Cluster 1.
This approach ensures that the indicator adapts to the current market regime, providing more accurate signals in volatile or trending conditions.
Smoothing Options for RSI
To further enhance the effectiveness of the RSI, this script allows traders to apply various smoothing methods to the RSI calculation, including:
Simple Moving Average (SMA)
Exponential Moving Average (EMA)
Weighted Moving Average (WMA)
Hull Moving Average (HMA)
Linear Regression (LINREG)
Double Exponential Moving Average (DEMA)
Triple Exponential Moving Average (TEMA)
Adaptive Linear Moving Average (ALMA)
T3 Moving Average
Traders can select their preferred smoothing method and adjust the smoothing period to suit their trading style and market conditions. The option to smooth the RSI reduces noise and makes the indicator more reliable for detecting trends and reversals.
Long and Short Signals
The indicator generates long and short signals based on the relationship between the RSI value and the dynamic thresholds:
Long Signals: Triggered when the RSI crosses above the long threshold, signaling bullish momentum.
Short Signals: Triggered when the RSI falls below the short threshold, signaling bearish momentum.
These signals are dynamically adjusted to reflect real-time market conditions, making them more robust than static RSI signals.
Visualization and Clustering Insights
The Machine Learning RSI provides an intuitive and visually rich interface, including:
RSI Line: Plotted in real-time, color-coded based on its position relative to the dynamic thresholds (green for long, red for short, gray for neutral).
Dynamic Threshold Lines: The script plots the long and short thresholds calculated by the ML clustering process, providing a clear visual reference for overbought and oversold levels.
Cluster Plots: Each RSI cluster is displayed with distinct colors (green, orange, and red) to give traders insights into how RSI values are grouped and how the dynamic thresholds are derived.
Customization Options
The Machine Learning RSI is highly customizable, allowing traders to tailor the indicator to their preferences:
RSI Settings : Adjust the RSI length, source price, and smoothing method to match your trading strategy.
Threshold Settings : Define the range and step size for clustering thresholds, allowing you to fine-tune the clustering process.
Optimization Settings : Control the performance memory, maximum clustering steps, and maximum data points for ML calculations to ensure optimal performance.
UI Settings : Customize the appearance of the RSI plot, dynamic thresholds, and cluster plots. Traders can also enable or disable candle coloring based on trend direction.
Alerts and Automation
To assist traders in staying on top of market movements, the script includes alert conditions for key events:
Long Signal: When the RSI crosses above the long threshold.
Short Signal: When the RSI crosses below the short threshold.
These alerts can be configured to notify traders in real-time, enabling timely decisions without constant chart monitoring.
Trading Applications
The Machine Learning RSI is versatile and can be applied to various trading strategies, including:
Trend Following: By dynamically adjusting thresholds, this indicator is effective in identifying and following trends in real-time.
Reversal Trading: The ML clustering process helps identify extreme RSI levels, offering reliable signals for reversals.
Range-Bound Trading: The dynamic thresholds adapt to market conditions, making the indicator suitable for trading in sideways markets where static thresholds often fail.
Final Thoughts
The Machine Learning RSI represents a significant advancement in RSI-based trading indicators. By integrating Machine Learning clustering techniques, this script overcomes the limitations of static thresholds, providing dynamic, adaptive signals that respond to market conditions in real-time. With its robust visualization, customizable settings, and alert capabilities, this indicator is a powerful tool for traders seeking to enhance their momentum analysis and improve decision-making.
As always, thorough backtesting and integration into a broader trading strategy are recommended to maximize the effectiveness!
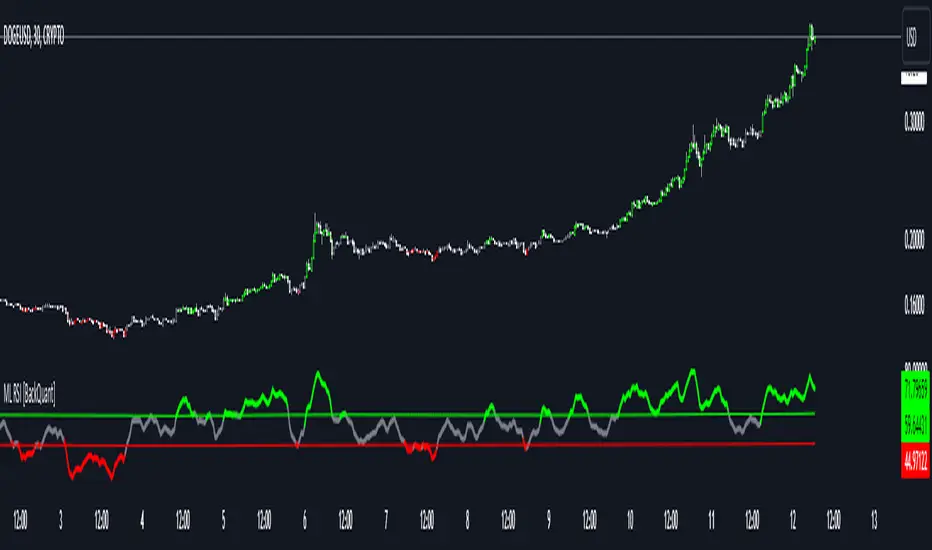
Stoch RSI and RSI Buy/Sell Signals with MACD Trend FilterDescription of the Indicator
This Pine Script is designed to provide traders with buy and sell signals based on the combination of Stochastic RSI, RSI, and MACD indicators, enhanced by the confirmation of candle colors. The primary goal is to facilitate informed trading decisions in various market conditions by utilizing different indicators and their interactions. The script allows customization of various parameters, providing flexibility for traders to adapt it to their specific trading styles.
Usefulness
This indicator is not just a mashup of existing indicators; it integrates the functionality of multiple momentum and trend-detection methods into a cohesive trading tool. The combination of Stochastic RSI, RSI, and MACD offers a well-rounded approach to analyzing market conditions, allowing traders to identify entry and exit points effectively. The inclusion of color-coded signals (strong vs. weak) further enhances its utility by providing visual cues about the strength of the signals.
How to Use This Indicator
Input Settings: Adjust the parameters for the Stochastic RSI, RSI, and MACD to fit your trading style. Set the overbought/oversold levels according to your risk tolerance.
Signal Colors:
Strong Buy Signal: Indicated by a green label and confirmed by a green candle (close > open).
Weak Buy Signal: Indicated by a blue label and confirmed by a green candle (close > open).
Strong Sell Signal: Indicated by a red label and confirmed by a red candle (close < open).
Weak Sell Signal: Indicated by an orange label and confirmed by a red candle (close < open).
Example Trading Strategy Using This Indicator
To effectively use this indicator as part of your trading strategy, follow these detailed steps:
Setup:
Timeframe : Select a timeframe that aligns with your trading style (e.g., 15-minute for intraday, 1-hour for swing trading, or daily for longer-term positions).
Indicator Settings : Customize the Stochastic RSI, RSI, and MACD parameters to suit your trading approach. Adjust overbought/oversold levels to match your risk tolerance.
Strategy:
1. Strong Buy Entry Criteria :
Wait for a strong buy signal (green label) when the RSI is at or below the oversold level (e.g., ≤ 35), indicating a deeply oversold market. Confirm that the MACD shows a decreasing trend (bearish momentum weakening) to validate a potential reversal. Ensure the current candle is green (close > open) if candle color confirmation is enabled.
Example Use : On a 1-hour chart, if the RSI drops below 35, MACD shows three consecutive bars of decreasing negative momentum, and a green candle forms, enter a buy position. This setup signals a robust entry with strong momentum backing it.
2. Weak Buy Entry Criteria :
Monitor for weak buy signals (blue label) when RSI is above the oversold level but still below the neutral (e.g., between 36 and 50). This indicates a market recovering from an oversold state but not fully reversing yet. These signals can be used for early entries with additional confirmations, such as support levels or higher timeframe trends.
Example Use : On the same 1-hour chart, if RSI is at 45, the MACD shows momentum stabilizing (not necessarily negative), and a green candle appears, consider a partial or cautious entry. Use this as an early warning for a potential bullish move, especially when higher timeframe indicators align.
3. Strong Sell Entry Criteria :
Look for a strong sell signal (red label) when RSI is at or above the overbought level (e.g., ≥ 65), signaling a strong overbought condition. The MACD should show three consecutive bars of increasing positive momentum to indicate that the bullish trend is weakening. Ensure the current candle is red (close < open) if candle color confirmation is enabled.
Example Use : If RSI reaches 70, MACD shows increasing momentum that starts to level off, and a red candle forms on a 1-hour chart, initiate a short position with a stop loss set above recent resistance. This is a high-confidence signal for potential price reversal or pullback.
4. Weak Sell Entry Criteria :
Use weak sell signals (orange label) when RSI is between the neutral and overbought levels (e.g., between 50 and 64). These can indicate potential short opportunities that might not yet be fully mature but are worth monitoring. Look for other confirmations like resistance levels or trendline touches to strengthen the signal.
Example Use : If RSI reads 60 on a 1-hour chart, and the MACD shows slight positive momentum with signs of slowing down, place a cautious sell position or scale out of existing long positions. This setup allows you to prepare for a possible downtrend.
Trade Management:
Stop Loss : For buy trades, place stop losses below recent swing lows. For sell trades, set stops above recent swing highs to manage risk effectively.
Take Profit : Target nearby resistance or support levels, apply risk-to-reward ratios (e.g., 1:2), or use trailing stops to lock in profits as price moves in your favor.
Confirmation : Align these signals with broader trends on higher timeframes. For example, if you receive a weak buy signal on a 15-minute chart, check the 1-hour or daily chart to ensure the overall trend is not bearish.
Real-World Example: Imagine trading on a 15-minute chart :
For a buy:
A strong buy signal (green) appears when the RSI dips to 32, MACD shows declining bearish momentum, and a green candle forms. Enter a buy position with a stop loss below the most recent support level.
Alternatively, a weak buy signal (blue) appears when RSI is at 47. Use this as a signal to start monitoring the market closely or enter a smaller position if other indicators (like support and volume analysis) align.
For a sell:
A strong sell signal (red) with RSI at 72 and a red candle signals to short with conviction. Place your stop loss just above the last peak.
A weak sell signal (orange) with RSI at 62 might prompt caution but can still be acted on if confirmed by declining volume or touching a resistance level.
These strategies show how to blend both strong and weak signals into your trading for more nuanced decision-making.
Technical Analysis of the Code
1. Stochastic RSI Calculation:
The script calculates the Stochastic RSI (stochRsiK) using the RSI as input and smooths it with a moving average (stochRsiD).
Code Explanation : ta.stoch(rsi, rsi, rsi, stochLength) computes the Stochastic RSI, and ta.sma(stochRsiK, stochSmoothing) applies smoothing.
2. RSI Calculation :
The RSI is computed over a user-defined period and checks for overbought or oversold conditions.
Code Explanation : rsi = ta.rsi(close, rsiLength) calculates RSI values.
3. MACD Trend Filter :
MACD is calculated with fast, slow, and signal lengths, identifying trends via three consecutive bars moving in the same direction.
Code Explanation : = ta.macd(close, macdLengthFast, macdLengthSlow, macdSignalLength) sets MACD values. Conditions like macdLine < macdLine confirm trends.
4. Buy and Sell Conditions :
The script checks Stochastic RSI, RSI, and MACD values to set buy/sell flags. Candle color filters further confirm valid entries.
Code Explanation : buyConditionMet and sellConditionMet logically check all conditions and toggles (enableStochCondition, enableRSICondition, etc.).
5. Signal Flags and Confirmation :
Flags track when conditions are met and ensure signals only appear on appropriate candle colors.
Code Explanation : Conditional blocks (if statements) update buyFlag and sellFlag.
6. Labels and Alerts :
The indicator plots "BUY" or "SELL" labels with the RSI value when signals trigger and sets alerts through alertcondition().
Code Explanation : label.new() displays the signal, color-coded for strength based on RSI.
NOTE : All strategies can be enabled or disabled in the settings, allowing traders to customize the indicator to their preferences and trading styles.

Savitzky Golay Median Filtered RSI [BackQuant]Savitzky Golay Median Filtered RSI
Introducing BackQuant's Savitzky Golay Median Filtered RSI, a cutting-edge indicator that enhances the classic Relative Strength Index (RSI) by applying both a Savitzky-Golay filter and a median filter to provide smoother and more reliable signals. This advanced approach helps reduce noise and captures true momentum trends with greater precision. Let’s break down how the indicator works, the features it offers, and how it can improve your trading strategy.
Core Concept: Relative Strength Index (RSI)
The Relative Strength Index (RSI) is a widely used momentum oscillator that measures the speed and change of price movements. It oscillates between 0 and 100, with levels above 70 typically indicating overbought conditions and levels below 30 indicating oversold conditions. However, the standard RSI can sometimes generate noisy signals, especially in volatile markets, making it challenging to identify reliable entry and exit points.
To improve upon the traditional RSI, this indicator introduces two powerful filters: the Savitzky-Golay filter and a median filter.
Savitzky-Golay Filter: Smoothing with Precision
The Savitzky-Golay filter is a digital filtering technique used to smooth data while preserving important features, such as peaks and trends. Unlike simple moving averages that can distort important price data, the Savitzky-Golay filter uses polynomial regression to fit the data, providing a more accurate and less lagging result.
In this script, the Savitzky-Golay filter is applied to the RSI values to smooth out short-term fluctuations and provide a more reliable signal. By using a window size of 5 and a polynomial degree of 2, the filter effectively reduces noise without compromising the integrity of the underlying price movements.
Median Filter: Reducing Outliers
After applying the Savitzky-Golay filter, the median filter is applied to the smoothed RSI values. The median filter is particularly effective at removing short-lived outliers, further enhancing the accuracy of the RSI by reducing the impact of sudden and temporary price spikes or drops. This combination of filters creates an ultra-smooth RSI that is better suited for detecting true market trends.
Long and Short Signals
The Savitzky Golay Median Filtered RSI generates long and short signals based on user-defined threshold levels:
Long Signals: A long signal is triggered when the filtered RSI exceeds the Long Threshold (default set at 176). This indicates that momentum is shifting upward, and it may present a good buying opportunity.
Short Signals: A short signal is generated when the filtered RSI falls below the Short Threshold (default set at 162). This suggests that momentum is weakening, potentially signaling a selling opportunity or exit from a long position.
These threshold levels can be adjusted to suit different market conditions and timeframes, allowing traders to fine-tune the sensitivity of the indicator.
Customization and Visualization Options
The Savitzky Golay Median Filtered RSI comes with several customization options, enabling traders to tailor the indicator to their specific needs:
Calculation Source: Select the price source for the RSI calculation (default is OHLC4, but it can be changed to close, open, high, or low prices).
RSI Period: Adjust the lookback period for the RSI calculation (default is 14).
Median Filter Length: Control the length of the median filter applied to the smoothed RSI, affecting how much noise is removed from the signal.
Threshold Levels: Customize the long and short thresholds to define the sensitivity for generating buy and sell signals.
UI Settings: Choose whether to display the RSI and thresholds on the chart, color the bars according to trend direction, and adjust the line width and colors used for long and short signals.
Visual Feedback: Color-Coded Signals and Thresholds
To make the signals easier to interpret, the indicator offers visual feedback by coloring the price bars and the RSI plot according to the current market trend:
Green Bars indicate long signals when momentum is bullish.
Red Bars indicate short signals when momentum is bearish.
Gray Bars indicate neutral or undecided conditions when no clear signal is present.
In addition, the Long and Short Thresholds can be plotted directly on the chart to provide a clear reference for when signals are triggered, allowing traders to visually gauge the strength of the RSI relative to its thresholds.
Alerts for Automation
For traders who prefer automated notifications, the Savitzky Golay Median Filtered RSI includes built-in alert conditions for long and short signals. You can configure these alerts to notify you when a buy or sell condition is met, ensuring you never miss a trading opportunity.
Trading Applications
This indicator is versatile and can be used in a variety of trading strategies:
Trend Following: The combination of Savitzky-Golay and median filtering makes this RSI particularly useful for identifying strong trends without being misled by short-term noise. Traders can use the long and short signals to enter trades in the direction of the prevailing trend.
Reversal Trading: By adjusting the threshold levels, traders can use this indicator to spot potential reversals. When the RSI moves from overbought to oversold levels (or vice versa), it may signal a shift in market direction.
Swing Trading: The smoothed RSI provides a clear signal for short to medium-term price movements, making it an excellent tool for swing traders looking to capitalize on momentum shifts.
Risk Management: The filtered RSI can be used as part of a broader risk management strategy, helping traders avoid false signals and stay in trades only when the momentum is strong.
Final Thoughts
The Savitzky Golay Median Filtered RSI takes the classic RSI to the next level by applying advanced smoothing techniques that reduce noise and improve signal reliability. Whether you’re a trend follower, swing trader, or reversal trader, this indicator provides a more refined approach to momentum analysis, helping you make better-informed trading decisions.
As with all indicators, it is important to backtest thoroughly and incorporate sound risk management strategies when using the Savitzky Golay Median Filtered RSI in your trading system.
Thus following all of the key points here are some sample backtests on the 1D Chart
Disclaimer: Backtests are based off past results, and are not indicative of the future.
INDEX:BTCUSD
INDEX:ETHUSD
BINANCE:SOLUSD

MTF RSI+CMO PROThis RSI+CMO script combines the Relative Strength Index (RSI) and Chande Momentum Oscillator (CMO), providing a powerful tool to help traders analyze price momentum and spot potential turning points in the market. Unlike using RSI alone, the CMO (especially with a 14-period length) moves faster and accentuates price pops and dips in the histogram, making price shifts more apparent.
Indicator Features:
➡️RSI and CMO Combined: This indicator allows traders to track both RSI and CMO values simultaneously, highlighting differences in their movement. RSI and CMO values are both plotted on the histogram, while CMO values are also drawn as a line moving through the histogram, giving a visual representation of their relationship. The often faster-moving CMO accentuates short-term price movements, helping traders spot subtle shifts in momentum that the RSI might smooth out.
➡️Multi-Time Frame Table: A real-time, multi-time frame table displays RSI and CMO values across various timeframes. This gives traders an overview of momentum across different intervals, making it easier to spot trends and divergences across short and long-term time frames.
➡️Momentum Chart Label: A chart label compares the current RSI and CMO values with values from 1 and 2 bars back, providing an additional metric to gauge momentum. This feature allows traders to easily see if momentum is increasing or decreasing in real-time.
➡️RSI/CMO Bullish and Bearish Signals: Colored arrow plot shapes (above the histogram) indicate when RSI and CMO values are signaling bullish or bearish conditions. For example, green arrows appear when RSI is above 65, while purple arrows show when RSI is below 30 and CMO is below -40, indicating strong bearish momentum.
➡️Divergences in Histogram: The histogram can make it easier for traders to spot divergences between price and momentum. For instance, if the price is making new highs but the RSI or CMO is not, a bearish divergence may be forming. Similarly, bullish divergences can be spotted when prices are making lower lows while RSI or CMO is rising.
➡️Alert System: Alerts are built into the indicator and will trigger when specific conditions are met, allowing traders to stay informed of potential entry or exit points based on RSI and CMO levels without constantly monitoring the chart. These are set manually. Look for the 3 dots in the indicator name.
How Traders Can Use the Indicator:
💥Identifying Momentum Shifts: The RSI+CMO combination is ideal for spotting momentum shifts in the market. Traders can monitor the histogram and the CMO line to determine if the market is gaining or losing strength.
💥Confirming Trade Entries/Exits: Use the real-time RSI and CMO values across multiple time frames to confirm trades. For instance, if the 1-hour RSI is above 70 but the 1-minute RSI is turning down, it could indicate short-term overbought conditions, signaling a potential exit or reversal.
💥Spotting Divergences: Divergences are critical for predicting potential reversals. The histogram can be used to spot divergences when RSI and CMO values deviate from price action, offering an early signal of market exhaustion.
💥Tracking Multi-Time Frame Trends: The multi-time frame table provides insight into the market’s overall trend across several timeframes, helping traders ensure their decisions align with both short and long-term trends.
RSI vs. CMO: Why Use Both?
While both RSI and CMO measure momentum, the CMO often moves faster with a value of 14 for example, reacting to price changes more quickly. This makes it particularly effective for detecting sharp price movements, while RSI helps smooth out price action. By using both, traders get a clearer picture of the market's momentum, particularly during volatile periods.
Confluence and Price Fluidity:
One of the powerful ways to enhance the effectiveness of this indicator is by using it in conjunction with other technical analysis tools to create confluence. Confluence occurs when multiple indicators or price action signals align, providing stronger confirmation for a trade decision. For example:
🎯Support and Resistance Levels: Traders can use RSI+CMO in combination with key support and resistance zones. If the price is nearing a support level and RSI+CMO values start to signal a bullish reversal, this alignment strengthens the case for entering a long position.
🎯Moving Averages: When the RSI+CMO signals a potential trend reversal and this is confirmed by a crossover in moving averages (such as a 50-day and 200-day moving average), traders gain additional confidence in the trade direction.
🎯Momentum Indicators: Traders can also look for momentum indicators like the MACD to confirm the strength of a trend or potential reversal. For instance, if the RSI+CMO values start to decrease rapidly while both the RSI+CMO also shows overbought conditions, this could provide stronger confirmation to exit a long trade or enter a short position.
🎯Candlestick Patterns: Price fluidity can be monitored using candlestick formations. For example, a bearish engulfing pattern with decreasing RSI+CMo values offers confluence, adding confidence to the signal to close or short the trade.
By combining the MTF RSI+CMO PRO with other tools, traders ensure that they are not relying on a single indicator. This layered approach can reduce the likelihood of false signals and improve overall trading accuracy.

KLNI RSI MTFDescription of the RSI Multi-Timeframe Indicator
The RSI Multi-Timeframe Indicator allows you to track and compare the Relative Strength Index (RSI) across three different timeframes on the same chart. This is particularly useful for traders who want to gauge the momentum of an asset over multiple time periods simultaneously, helping to make more informed trading decisions.
Key Features
Multi-Timeframe RSI:
You can select up to three timeframes to plot RSI on the same chart.
Available timeframe options include:
Current: Displays RSI for the current chart timeframe.
60 minutes (1 hour)
Daily
Weekly
Monthly
Custom RSI Settings:
Adjust the RSI length and source (e.g., close price) through user inputs, allowing you to tailor the indicator to your strategy.
Divergence Detection (Optional):
The indicator can optionally detect and display bullish and bearish divergences between price and RSI for the first selected timeframe.
Bullish divergence is shown when price makes a lower low, but RSI makes a higher low.
Bearish divergence is shown when price makes a higher high, but RSI makes a lower high.
Visual Aids:
Overbought and oversold RSI levels are highlighted with background colors for clarity.
Horizontal lines at 70 (overbought), 50 (neutral), and 30 (oversold) help quickly identify RSI conditions.
How to Use This Indicator
Inputs & Settings
Timeframe Settings:
First Timeframe: Choose the primary timeframe (e.g., 60 minutes, Daily, Weekly).
Second Timeframe: Select the second timeframe to plot on the chart.
Third Timeframe: Select the third timeframe for additional RSI analysis.
RSI Settings:
RSI Length: Set the period for RSI calculation (default: 14).
Source: Select the price data for RSI calculation (default: close price).
Show Divergence: Enable or disable the detection of divergence between price and RSI.
Plotting on Chart
The indicator will display three distinct RSI plots for the selected timeframes:
RSI TF1 (blue line) for the first timeframe.
RSI TF2 (green line) for the second timeframe.
RSI TF3 (red line) for the third timeframe.
Each RSI line corresponds to its chosen timeframe, allowing you to see how RSI behaves across different time periods.
Reading the RSI Values
Overbought: When RSI is above 70, the asset is considered overbought, potentially signaling a sell or short entry.
Oversold: When RSI is below 30, the asset is considered oversold, possibly indicating a buying opportunity.
Neutral: RSI around 50 is neutral and may suggest a lack of clear momentum.
Divergence Detection
If enabled, the indicator will highlight points of divergence:
Bullish Divergence: A green label will appear below the chart where price is making lower lows, but RSI is making higher lows, suggesting potential bullish momentum.
Bearish Divergence: A red label will appear when price is making higher highs, but RSI is making lower highs, indicating potential bearish pressure.
Practical Applications
Momentum Confirmation: Use this indicator to confirm the strength of a trend by comparing RSI across multiple timeframes. For example, if RSI is above 50 on all three timeframes, it may confirm strong upward momentum.
Overbought/Oversold Signals: When RSI is overbought on multiple timeframes, it could signal an impending reversal or correction. Conversely, oversold conditions across timeframes might indicate a buy opportunity.
Divergence Detection: Spot divergence between price and RSI to identify potential trend reversals early. Divergence can provide early signals of changing market momentum.
Summary
This indicator is a powerful tool for multi-timeframe RSI analysis, helping traders understand momentum shifts across different timeframes. It offers customizability, divergence detection, and visual aids to streamline your technical analysis and decision-making process.
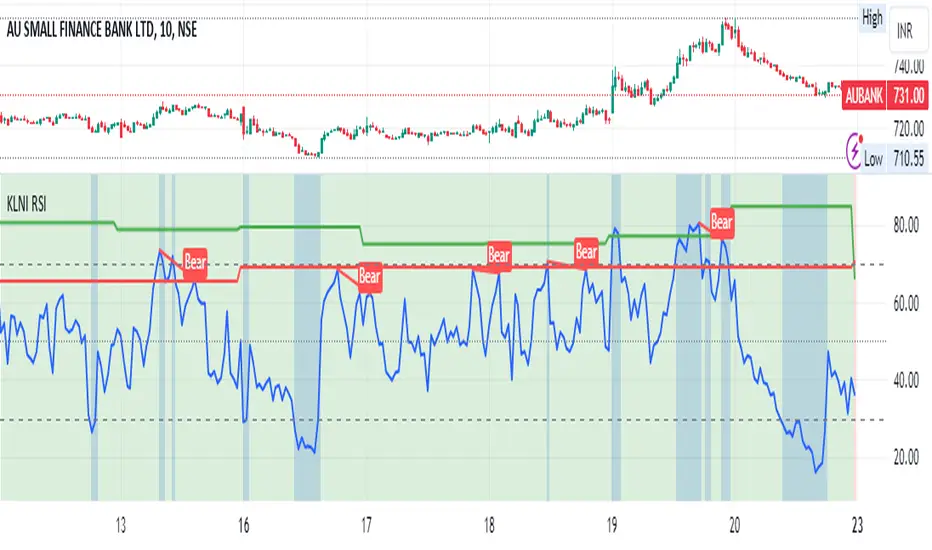
Fusion MFI RSIHello fellas,
This superb indicator summons two monsters called Relative Strength Index (RSI) and Money Flow Index (MFI) and plays the Yu-Gi-Oh! card "Polymerization" to combine them.
Overview
The Fusion MFI RSI Indicator is an advanced analytical tool designed to provide a nuanced understanding of market dynamics by combining the Relative Strength Index (RSI) and the Money Flow Index (MFI). Enhanced with sophisticated smoothing techniques and the Inverse Fisher Transform (IFT), this indicator excels in identifying key market conditions such as overbought and oversold states, trends, and potential reversal points.
Key Features (Brief Overview)
Fusion of RSI and MFI: Integrates momentum and volume for a comprehensive market analysis.
Advanced Smoothing Techniques: Employs Hann Window, Jurik Moving Average (JMA), T3 Smoothing, and Super Smoother to refine signals.
Inverse Fisher Transform (IFT) Enhances the clarity and distinctiveness of indicator outputs.
Detailed Feature Analysis
Fusion of RSI and MFI
RSI (Relative Strength Index): Developed by J. Welles Wilder Jr., the RSI measures the speed and magnitude of directional price movements. Wilder recommended using a 14-day period and identified overbought conditions above 70 and oversold conditions below 30.
MFI (Money Flow Index): Created by Gene Quong and Avrum Soudack, the MFI combines price and volume to measure trading pressure. It is typically calculated using a 14-day period, with over 80 considered overbought and under 20 as oversold.
Application in Fusion: By combining RSI and MFI, the indicator leverages RSI's sensitivity to price changes with MFI's volume-weighted confirmation, providing a robust analysis tool. This combination is particularly effective in confirming the strength behind price movements, making the signals more reliable.
Advanced Smoothing Techniques
Hann Window: Traditionally used to reduce the abrupt data discontinuities at the edges of a sample, it is applied here to smooth the price data.
Jurik Moving Average (JMA): Known for preserving the timing and smoothness of the data, JMA reduces market noise effectively without significant lag.
T3 Smoothing: Developed to respond quickly to market changes, T3 provides a smoother response to price fluctuations.
Super Smoother: Filters out high-frequency noise while retaining important trends.
Application in Fusion: These techniques are chosen to refine the output of the combined RSI and MFI values, ensuring the indicator remains responsive yet stable, providing clearer and more actionable signals.
Inverse Fisher Transform (IFT):
Developed by John Ehlers, the IFT transforms oscillator outputs to enhance the clarity of extreme values. This is particularly useful in this fusion indicator to make critical turning points more distinct and actionable.
Mathematical Calculations for the Fusion MFI RSI Indicator
RSI (Relative Strength Index)
The RSI is calculated using the following steps:
Average Gain and Average Loss: First, determine the average gain and average loss over the specified period (typically 14 days). This is done by summing all the gains and losses over the period and then dividing each by the period.
Average Gain = (Sum of Gains over the past 14 periods) / 14
Average Loss = (Sum of Losses over the past 14 periods) / 14
Relative Strength (RS): This is the ratio of average gain to average loss.
RS = Average Gain / Average Loss
RSI: Finally, the RSI is calculated using the RS value:
RSI = 100 - (100 / (1 + RS))
MFI (Money Flow Index)
The MFI is calculated using several steps that incorporate both price and volume:
Typical Price: Calculate the typical price for each period.
Typical Price = (High + Low + Close) / 3
Raw Money Flow: Multiply the typical price by the volume for the period.
Raw Money Flow = Typical Price * Volume
Positive and Negative Money Flow: Compare the typical price of the current period to the previous period to determine if the money flow is positive or negative.
If today's Typical Price > Yesterday's Typical Price, then Positive Money Flow = Raw Money Flow; Negative Money Flow = 0
If today's Typical Price < Yesterday's Typical Price, then Negative Money Flow = Raw Money Flow; Positive Money Flow = 0
Money Flow Ratio: Calculate the ratio of the sum of Positive Money Flows to the sum of Negative Money Flows over the past 14 periods.
Money Flow Ratio = (Sum of Positive Money Flows over 14 periods) / (Sum of Negative Money Flows over 14 periods)
MFI: Finally, calculate the MFI using the Money Flow Ratio.
MFI = 100 - (100 / (1 + Money Flow Ratio))
Fusion of RSI and MFI
The final Fusion MFI RSI value could be calculated by averaging the IFT-transformed values of RSI and MFI, providing a single oscillator value that reflects both momentum and volume-weighted price action:
Fusion MFI RSI = (MFI weight * MFI) + (RSI weight * RSI)
Suggested Settings and Trading Rules
Original Usage
RSI: Wilder suggested buying when the RSI moves above 30 from below (enter long) and selling when the RSI moves below 70 from above (enter short). He recommended exiting long positions when the RSI reaches 70 or higher and exiting short positions when the RSI falls below 30.
MFI: Quong and Soudack recommended buying when the MFI is below 20 and starts rising (enter long), and selling when it is above 80 and starts declining (enter short). They suggested exiting long positions when the MFI reaches 80 or higher and exiting short positions when the MFI falls below 20.
Fusion Application
Settings: Use a 14-day period for this indicator's calculations to maintain consistency with the original settings suggested by the inventors.
Trading Rules:
Enter Long Signal: Consider entering a long position when both RSI and MFI are below their respective oversold levels and begin to rise. This indicates strong buying pressure supported by both price momentum and volume.
Exit Long Signal: Exit the long position when either RSI or MFI reaches its respective overbought threshold, suggesting a potential reversal or decrease in buying pressure.
Enter Short Signal: Consider entering a short position when both indicators are above their respective overbought levels and begin to decline, suggesting that selling pressure is mounting.
Exit Short Signal: Exit the short position when either RSI or MFI falls below its respective oversold threshold, indicating diminishing selling pressure and a potential upward reversal.
How to Use the Indicator
Select Source and Timeframe: Choose the data source and the timeframe for analysis.
Configure Fusion Settings: Adjust the weights for RSI and MFI.
Choose Smoothing Technique: Select and configure the desired smoothing method to suit the market conditions and personal preference.
Enable Fisherization: Optionally apply the Inverse Fisher Transform to enhance signal clarity.
Customize Visualization: Set up gradient coloring, background plots, and bands according to your preferences.
Interpret the Indicator: Use the Fusion value and visual cues to identify market conditions and potential trading opportunities.
Conclusion
The Fusion MFI RSI Indicator integrates classical and modern technical analysis concepts to provide a comprehensive tool for market analysis. By combining RSI and MFI with advanced smoothing techniques and the Inverse Fisher Transform, this indicator offers enhanced insights, aiding traders in making more informed and timely trading decisions. Customize the settings to align with your trading strategy and leverage this powerful tool to navigate financial markets effectively.
Best regards,
simwai
---
Credits to:
@loxx – T3
@everget – JMA
@cheatcountry – Hann Window

Perfect RSIOverview:
The "Enhanced RSI" is a comprehensive TradingView indicator designed to provide traders with a nuanced and detailed analysis of market conditions using the Relative Strength Index (RSI). It amalgamates various RSI calculation methods to offer a more robust and adaptable approach to technical analysis.
Originality:
This script is unique in its synthesis of multiple RSI calculation techniques, including Regular RSI, Dynamic RSI, DMI RSI, Wilder's RSI, TSI RSI, Momentum RSI, and PPO RSI. By combining these methods, the script creates a distinctive and versatile tool for traders seeking a holistic view of RSI dynamics.
How It Works:
Diverse RSI Calculations:
Regular RSI: Calculates standard RSI with user-defined length and source.
Dynamic RSI: Adjusts RSI dynamically based on price movement direction.
DMI RSI: Uses Directional Movement Index for RSI calculation.
Wilder's RSI: Implements Wilder's smoothing technique for RSI.
TSI RSI: Utilizes True Strength Index for RSI calculation.
Momentum RSI: Calculates RSI based on momentum.
PPO RSI: Applies Percentage Price Oscillator for RSI calculation.
Composite RSI:
Combines the individual RSIs into three composite indices (RSI1, RSI2, RSI) using a weighted average approach.
Dynamic Level Adjustment:
Uses the correlation coefficient to dynamically adjust overbought and oversold levels, enhancing adaptability to market changes.
Visualization and Background Coloring:
Visualizes overbought and oversold zones on the chart.
Adjusts background color based on these conditions for clearer interpretation.
How to Use:
Installation:
Copy and paste the script into the Pine Editor on TradingView.
Adjust parameters as needed.
Analysis:
Utilize the "Enhanced RSI" as a comprehensive analysis tool for RSI dynamics.
Consider it as a confirmation tool alongside other technical indicators.
Customization:
Experiment with different RSI lengths and methods to align with your trading strategy.
Backtest the script to validate its effectiveness.
Considerations:
Complexity:
The script is sophisticated; users are advised to understand each calculation method before reliance.
Parameter Sensitivity:
Effectiveness may vary based on chosen parameters; thorough backtesting and parameter optimization are recommended.
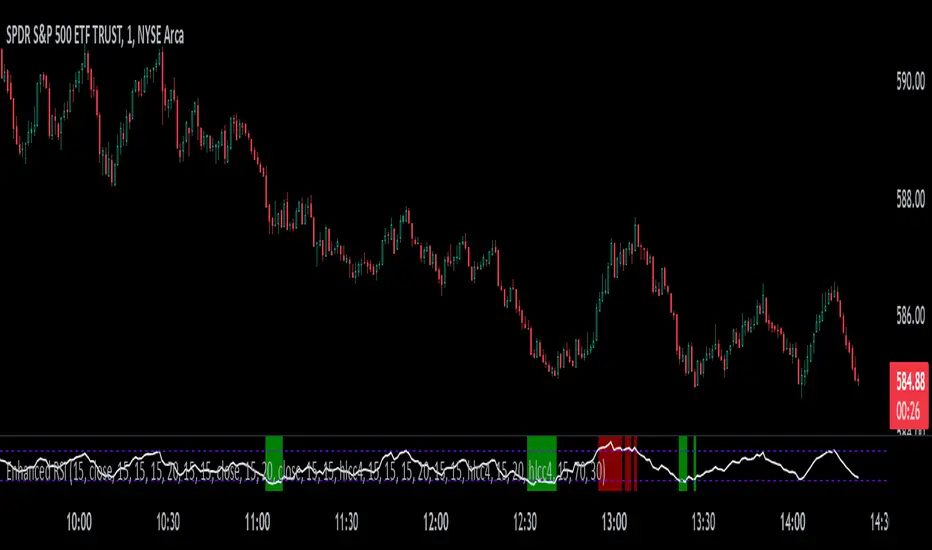
Triple RSI Indicator with ToggleThis script combines three relative strength index (RSI) indicators with different periods, and allows the user to toggle between them to generate overbought and oversold signals. The indicator is named "Triple RSI Indicator with Toggle" and has the short title "TRSI-T."
The input parameters for the RSI periods are set by the user and include a short RSI with a period of 5, a main RSI with a period of 14, and a long RSI with a period of 28. The overbought and oversold levels for each RSI can also be set by the user.
The script plots the three RSI lines on the chart and calculates a bar color based on the enabled RSI values. If all three RSI values are overbought, the bar color is set to fuchsia, if all three RSI values are oversold, the bar color is set to aqua, and if neither of these conditions is met, the bar color is set to not available.
The script also includes a fast RSI and an RSI exponential moving average (EMA) with adjustable periods. The RSI fast line is plotted along with the RSI EMA line, and a cloud fill is generated between the two lines. The fill color is based on whether the fast RSI line is above or below the RSI EMA line, with a blue color used for long signals and a pink color used for short signals.
This indicator can be used as part of a trading strategy in a number of ways. Here are a few examples:
Overbought and Oversold Signals: When the bar color of the indicator is fuchsia, it indicates that all three RSIs are overbought, and when the bar color is aqua, it indicates that all three RSIs are oversold. These signals can be used to enter a trade in the opposite direction, anticipating a reversal in price.
RSI Divergence: Traders can also look for divergences between the price and the RSI values. For example, if the price is making higher highs but the RSI values are making lower highs, it could indicate that the price trend is weakening and a reversal may be imminent. Conversely, if the price is making lower lows but the RSI values are making higher lows, it could indicate that the price trend is about to reverse.
RSI Cloud Signals: The cloud fill generated between the fast RSI and RSI EMA lines can be used to generate trading signals. When the fast RSI line is above the RSI EMA line and the fill color is blue, it can be a signal to go long. When the fast RSI line is below the RSI EMA line and the fill color is pink, it can be a signal to go short.
If anybody has some interesting thoughts on how to improve it, let me know!!
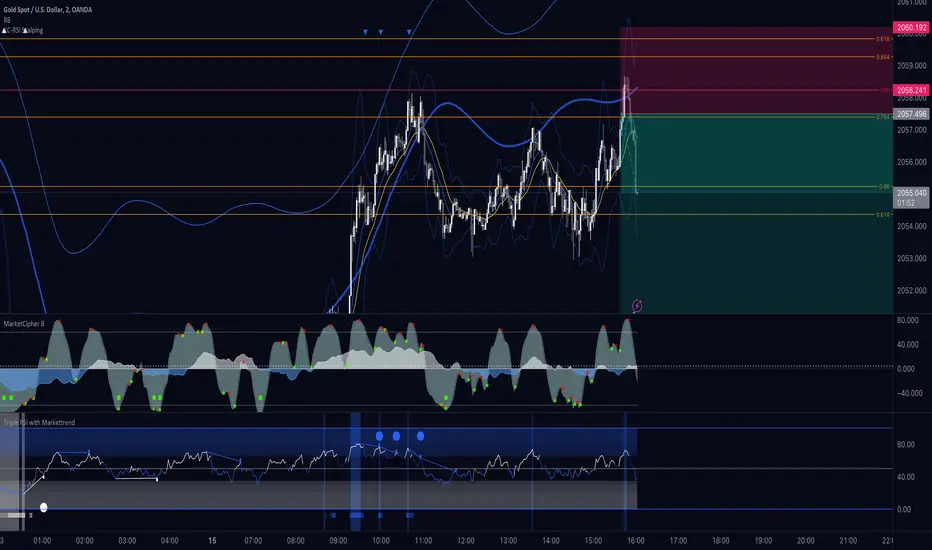
Visual RSI [LucF]Visual RSI offers a different way of looking at RSI by providing a composite representation of 9 different RSI-generated components. Instead of focusing on one line only, this approach blends multiple sources to provide the viewer with a larger context RSI-based picture.
For those who don’t want to read
• Green in bullish (>50) zone is the most bullish.
• Red in bullish zone doesn’t necessarily mean bearish—it just means bullish strength is weakening. It may be just a pause before a reprise or exhaustion signalling a reversal—impossible to tell.
• The same in inverse applies to the bearish zone (<50).
For those who want to understand
The nine components making up Visual RSI are:
• a current timeframe RSI
• a higher timeframe RSI
• the delta between these two RSI lines
• for each of these three basic components, two independent Bollinger band: one calculated for the bullish section of the scale (>50) and a separate one calculated for the lower bearish region.
Dual BBs
In my view, RSI’s position with regards to the centerline is much more important than its position in extreme areas. Why? Because the building block of RSI is the ratio of the averages of up/down moves during the RSI period. When the average of ups is greater, RSI is > 50. So while a rising signal starting from 20 let’s say, indicates that the rate of change is increasing, only when it crosses 50 can we say that sentiment balance has truly become bullish, and this information is more reliable than the signal being at a level corresponding to whatever estimate we make of what constitutes an extreme value. In my landscape, the general balance of a ratio provides more valuable information than the ratio’s exact value.
The idea behind the dual BBs is to provide independent tracking information for both halves of the indicator’s space, which I find more useful than the normal method of simply adding a multiple of the standard deviation on both sides of the mean. With dual BBs, the upper BB will never go lower than the indicator’s centerline, and the lower BB will never go higher. The upper BB focuses on upper-bound volatility when the signal is bearish, and the lower BB focuses on downside volatility when the signal is bearish.
The functions used to calculate the independent BBs are reusable on other signals if a centerline can be defined for them. A clamping percentage is implemented, so that when a BB line is hugging the centerline it clamps to it. This helps in providing earlier signals when they use the BB line states.
Providing context to RSI
What RSI measures indirectly is the balance in the rate of change—or the speed of price movement, but not its instant value, otherwise RSI would be even noisier. More precisely, RSI represents the relative strength of the up/down movement in the last n bars of RSI’s length, with 14 often used because that’s what Wilder proposed (Visual RSI’s defaults are 20 for the current timeframe and 40 for the higher timeframe). At every bar, a new value is added to the equation and an old value carrying equal weight is dropped, so a large dropped off value will have more impact on RSI’s value if the new bar’s move is small. This accounts for some of RSI’s speed in identifying exhaustion after important moves, but almost for some of its noise.
Visual RSI is the result of trying to drown RSI’s noise in the context of other informational streams, while simultaneously providing even faster information than RSI alone, by giving more visual weight to the delta between the current and higher timeframe RSI’s.
How to read Visual RSI
The default settings show all 9 basic components as green/red areas of intensities varying with their importance. The most intense colors are reserved for the delta RSI and the BBs have the lightest intensities. The individual lines of components are intentionally difficult to distinguish so that focus is first on the general picture, including the all-important six-state background, and then on the delta RSI.
One entry setup could be reversals in a larger trend context, so low pivots of the delta in a fully bullish context (a green background in the upper section of the indicator), and inversely, high pivots in a fully bearish context (a red background in the lower section of the indicator).
Please resist the common misconception, when interpreting RSI, that a reversal in the signal will necessarily lead to a reversal in price. Each trend has its rhythm. Only machine-generated price action can progress regularly. It’s normal for trends to take a breather for some time before they continue or reverse, as traders driving the trend experience emotional fatigue and gradual fear. RSI reversals merely signify that such a breather has occurred—nothing more. Only the larger context can provide information that can situate that pause and put more meaningful odds on it having more probability of continuing in one direction or the other. This is the reasoning behind the setup just described.
Features
• All components can be hidden, displayed as a simple line, a uniformly colored fill, or a green/red fill (the default).
• The background can be colored using 9 different methods, including 3 six-state methods using the rising/falling BB lines of the 3 basic components. These six states allow for bullish/bearish/neutral sentiment in both the upper and lower regions of the indicator. A bearish (dark red) background in the bullish (>50) section of the indicator represents decreasing bullishness. A bearish (slightly brighter red) in the bearish (<50) section of the indicator means incresingly bearish sentiment. The six-state backgrounds allow for neutral (no color) sentiment when no compelling signs can be found to conclude anything with meaningful odds. The default background uses the six-state method on the higher timeframe RSI’s BBs because I find it the most useful, as it represents the largest—and slowest—context sentiment among all the indicator’s components.
• A thin status bar in the top part of the indicator also allows selection of the same 9 methods to color it. The default is a triple-state system using the rising/falling characteristics of the current timeframe RSI’s BBs to provide a short-term counterbalance to the long-term background.
• Three different markers can be configured using approximately 70 permutations each, each filtered by 20 different filter permutations. When modification of the relevant parameters in the script’s Settings/Settings/Parameters section is added, possibilities are almost endless. If the generated signals are then fed into the PineCoders Engine and combined with the Engine’s own options, the permutations go up another order of magnitude, and changes to any setting can be instantly evaluated using the Engine’s backtesting results.
• Five simple filters can be combined. They are additive. They include volume-related conditions and a chandelier, which I find useful because both volume and volatility (the chandelier using highs/lows and ATR) are sensible complementary sources to RSI’s momentum information. The filter’s state can be shown as a thin line at the bottom of the indicator.
• Alerts can be configured using any of the marker/filter combinations mentioned. As usual, once your markers/filters are set up the way you want, create your alert from the chart/timeframe you want the alert to run on and be sure to use the “Once Per Bar Close” triggering condition. Use an alert message that will remind you of which combination of markers were used when creating the alert.
• A plot providing entry signals for the PineCoders Backtesting & Trading Engine is supplied. It will use whichever marker/filter configuration is active to generate signals.
• All higher timeframe information is non-repainting. Higher timeframe lines can be smoothed (the default). The selection of the higher timeframe can be made using 3 different methods:
1. By steps (if current timeframe <= 1 minute: 60 min, <= 60 min: 1D, <= 6H: 3D, <= 1D: 1W, <=1W: 1M, >1W: 12M)
2. By a user-defined multiple of the current timeframe
3. Using a fixed timeframe
Thanks to:
• Alex Orekhov aka @everget for the chandelier code.
• @RicardoSantos who through a small remark early on, unknowingly put me on the track of eliminating noise through visual crowding.
• The brilliant guys in the PineCoders Pro room for your knowledge, limitless creativity and constant companionship.
