在腳本中搜尋"rsi"
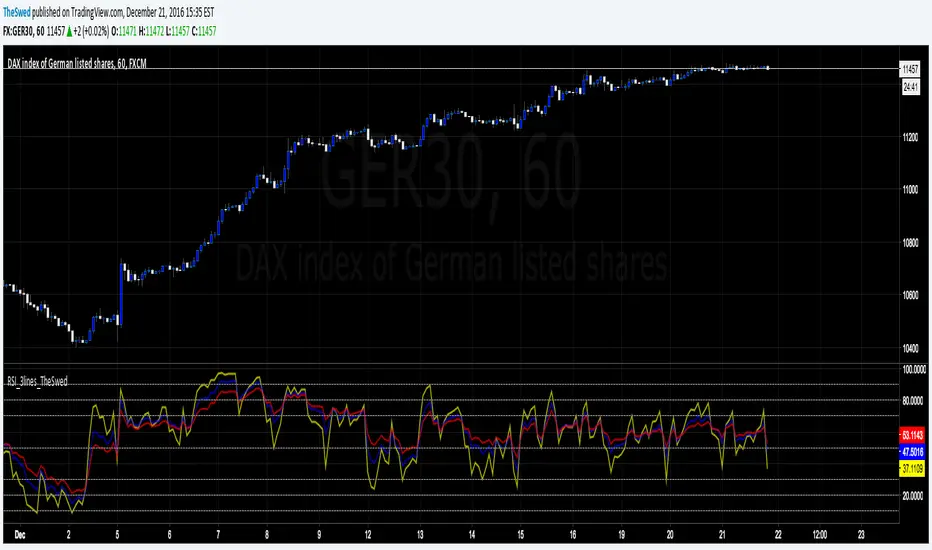
RSI_3lines_TheSwedRSI script with 3 lines. Also added lines: 90, 80, 20 and 10 to the script as I use this for trading.
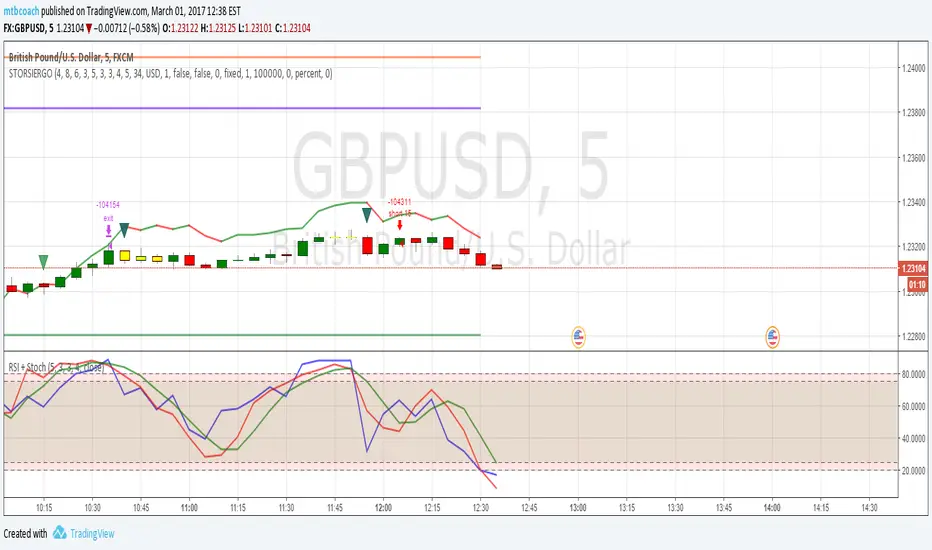
RSI Oversold/UndersoldThe study script will place GREEN BUY arrows BELOW oversold conditions and RED SHORT arrows ABOVE overbought conditions. You can configure the period
Most RSI(14) indicators use a 14-period, I prefer a 5-period. The period, overbought and oversold periods are settings that can easily be changed by adding this study to your chart and clicking the "gear" icon next to the study inside your chart.


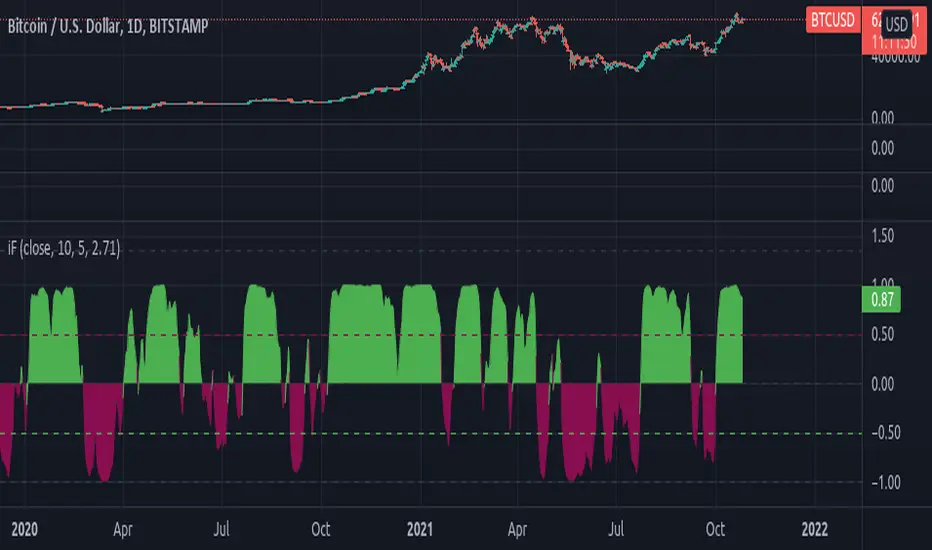
[RS]RSI Inverse Fisher Transform V1RSI inverse fisher transform (fishy turbo) as described here:
autotradingstrategy.wordpress.com
forexsb.com
update:
added color conditional.
[RS]RSI Inverse Fisher Transform V0RSI inverse fisher transform (fishy turbo) as described here:
autotradingstrategy.wordpress.com
forexsb.com

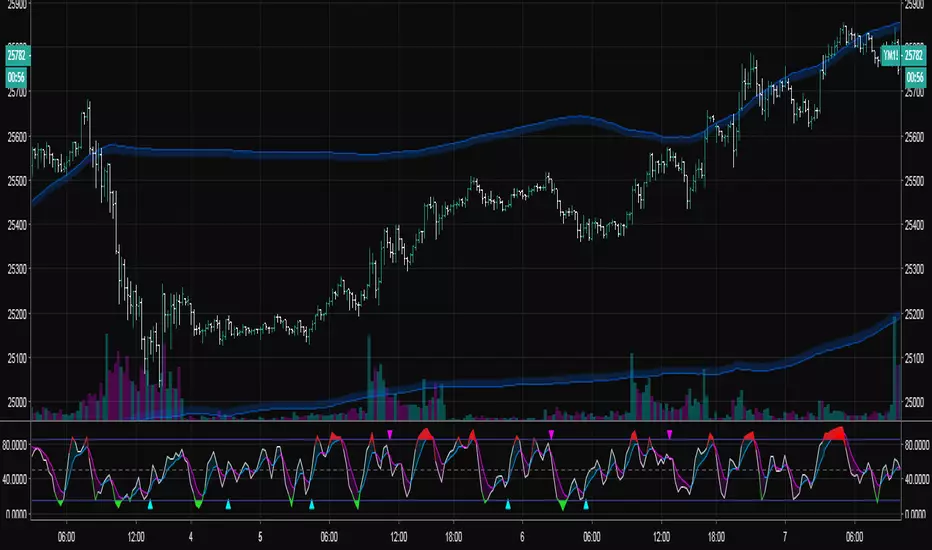
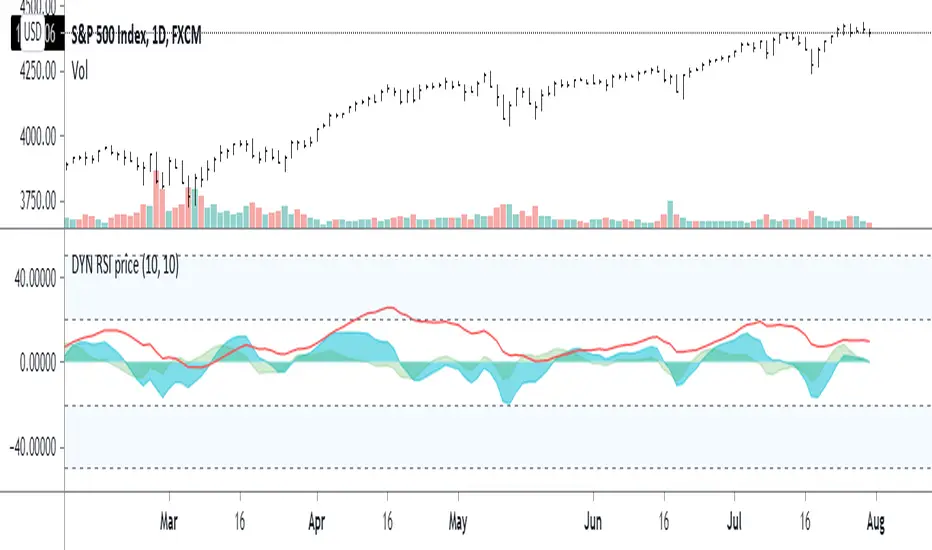
RSI InertiaRedline - vanilla RSI (where are we now)
Aqua - first difference/moment (how fast are we going)
Grey/Green - Second difference/moment (are we speeding up / slowing down?) aka Inertia

RSI-EMA IndicatorThis indicator calculates and plots 2 separate EMAs of the RSI. The default settings below work great on SPX/SPY daily chart. General rule is if an EMA is above 50, the stock's near term outlook is bullish. If an EMA is below 50, the near term outlook is bearish. Personally, I like to use a fast EMA as a buy signal and a slow EMA as a sell signal.
Default settings:
RSI = 50
EMA1 = 100
EMA2 = 200


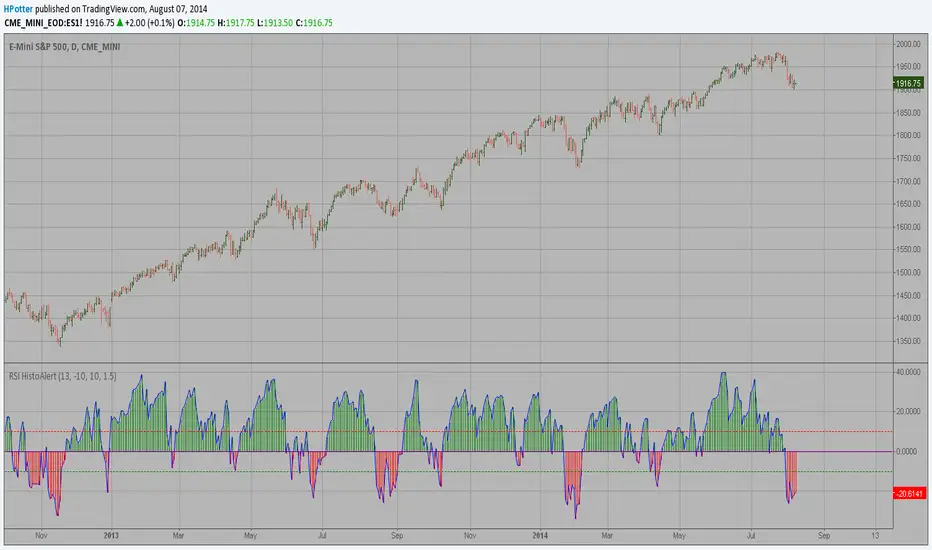
RSI HistoAlert StrategyThis is simple indicator modified RSI Strategy
You can use in the xPrice any series: Open, High, Low, Close, HL2, HLC3, OHLC4 and ect...

RSI HistoAlertThis is simple indicator modified RSI
You can use in the xPrice any series: Open, High, Low, Close, HL2, HLC3, OHLC4 and ect...
RSI CandlesCan be used as a 50 level cross by rsi or as overbought/oversold by setting the levels accordingly eg 70/30

Ultimate RSI [captainua]Ultimate RSI
Overview
This indicator combines multiple RSI calculations with volume analysis, divergence detection, and trend filtering to provide a comprehensive RSI-based trading system. The script calculates RSI using three different periods (6, 14, 24) and applies various smoothing methods to reduce noise while maintaining responsiveness. The combination of these features creates a multi-layered confirmation system that reduces false signals by requiring alignment across multiple indicators and timeframes.
The script includes optimized configuration presets for instant setup: Scalping, Day Trading, Swing Trading, and Position Trading. Simply select a preset to instantly configure all settings for your trading style, or use Custom mode for full manual control. All settings include automatic input validation to prevent configuration errors and ensure optimal performance.
Configuration Presets
The script includes preset configurations optimized for different trading styles, allowing you to instantly configure the indicator for your preferred trading approach. Simply select a preset from the "Configuration Preset" dropdown menu:
- Scalping: Optimized for fast-paced trading with shorter RSI periods (4, 7, 9) and minimal smoothing. Noise reduction is automatically disabled, and momentum confirmation is disabled to allow faster signal generation. Designed for quick entries and exits in volatile markets.
- Day Trading: Balanced configuration for intraday trading with moderate RSI periods (6, 9, 14) and light smoothing. Momentum confirmation is enabled for better signal quality. Ideal for day trading strategies requiring timely but accurate signals.
- Swing Trading: Configured for medium-term positions with standard RSI periods (14, 14, 21) and moderate smoothing. Provides smoother signals suitable for swing trading timeframes. All noise reduction features remain active.
- Position Trading: Optimized for longer-term trades with extended RSI periods (24, 21, 28) and heavier smoothing. Filters are configured for highest-quality signals. Best for position traders holding trades over multiple days or weeks.
- Custom: Full manual control over all settings. All input parameters are available for complete customization. This is the default mode and maintains full backward compatibility with previous versions.
When a preset is selected, it automatically adjusts RSI periods, smoothing lengths, and filter settings to match the trading style. The preset configurations ensure optimal settings are applied instantly, eliminating the need for manual configuration. All settings can still be manually overridden if needed, providing flexibility while maintaining ease of use.
Input Validation and Error Prevention
The script includes comprehensive input validation to prevent configuration errors:
- Cross-Input Validation: Smoothing lengths are automatically validated to ensure they are always less than their corresponding RSI period length. If you set a smoothing length greater than or equal to the RSI length, the script automatically adjusts it to (RSI Length - 1). This prevents logical errors and ensures valid configurations.
- Input Range Validation: All numeric inputs have minimum and maximum value constraints enforced by TradingView's input system, preventing invalid parameter values.
- Smart Defaults: Preset configurations use validated default values that are tested and optimized for each trading style. When switching between presets, all related settings are automatically updated to maintain consistency.
Core Calculations
Multi-Period RSI:
The script calculates RSI using the standard Wilder's RSI formula: RSI = 100 - (100 / (1 + RS)), where RS = Average Gain / Average Loss over the specified period. Three separate RSI calculations run simultaneously:
- RSI(6): Uses 6-period lookback for high sensitivity to recent price changes, useful for scalping and early signal detection
- RSI(14): Standard 14-period RSI for balanced analysis, the most commonly used RSI period
- RSI(24): Longer 24-period RSI for trend confirmation, provides smoother signals with less noise
Each RSI can be smoothed using EMA, SMA, RMA (Wilder's smoothing), WMA, or Zero-Lag smoothing. Zero-Lag smoothing uses the formula: ZL-RSI = RSI + (RSI - RSI ) to reduce lag while maintaining signal quality. You can apply individual smoothing lengths to each RSI period, or use global smoothing where all three RSIs share the same smoothing length.
Dynamic Overbought/Oversold Thresholds:
Static thresholds (default 70/30) are adjusted based on market volatility using ATR. The formula: Dynamic OB = Base OB + (ATR × Volatility Multiplier × Base Percentage / 100), Dynamic OS = Base OS - (ATR × Volatility Multiplier × Base Percentage / 100). This adapts to volatile markets where traditional 70/30 levels may be too restrictive. During high volatility, the dynamic thresholds widen, and during low volatility, they narrow. The thresholds are clamped between 0-100 to remain within RSI bounds. The ATR is cached for performance optimization, updating on confirmed bars and real-time bars.
Adaptive RSI Calculation:
An adaptive RSI adjusts the standard RSI(14) based on current volatility relative to average volatility. The calculation: Adaptive Factor = (Current ATR / SMA of ATR over 20 periods) × Volatility Multiplier. If SMA of ATR is zero (edge case), the adaptive factor defaults to 0. The adaptive RSI = Base RSI × (1 + Adaptive Factor), clamped to 0-100. This makes the indicator more responsive during high volatility periods when traditional RSI may lag. The adaptive RSI is used for signal generation (buy/sell signals) but is not plotted on the chart.
Overbought/Oversold Fill Zones:
The script provides visual fill zones between the RSI line and the threshold lines when RSI is in overbought or oversold territory. The fill logic uses inclusive conditions: fills are shown when RSI is currently in the zone OR was in the zone on the previous bar. This ensures complete coverage of entry and exit boundaries. A minimum gap of 0.1 RSI points is maintained between the RSI plot and threshold line to ensure reliable polygon rendering in TradingView. The fill uses invisible plots at the threshold levels and the RSI value, with the fill color applied between them. You can select which RSI (6, 14, or 24) to use for the fill zones.
Divergence Detection
Regular Divergence:
Bullish divergence: Price makes a lower low (current low < lowest low from previous lookback period) while RSI makes a higher low (current RSI > lowest RSI from previous lookback period). Bearish divergence: Price makes a higher high (current high > highest high from previous lookback period) while RSI makes a lower high (current RSI < highest RSI from previous lookback period). The script compares current price/RSI values to the lowest/highest values from the previous lookback period using ta.lowest() and ta.highest() functions with index to reference the previous period's extreme.
Pivot-Based Divergence:
An enhanced divergence detection method that uses actual pivot points instead of simple lowest/highest comparisons. This provides more accurate divergence detection by identifying significant pivot lows/highs in both price and RSI. The pivot-based method uses a tolerance-based approach with configurable constants: 1% tolerance for price comparisons (priceTolerancePercent = 0.01) and 1.0 RSI point absolute tolerance for RSI comparisons (pivotTolerance = 1.0). Minimum divergence threshold is 1.0 RSI point (minDivergenceThreshold = 1.0). It looks for two recent pivot points and compares them: for bullish divergence, price makes a lower low (at least 1% lower) while RSI makes a higher low (at least 1.0 point higher). This method reduces false divergences by requiring actual pivot points rather than just any low/high within a period. When enabled, pivot-based divergence replaces the traditional method for more accurate signal generation.
Strong Divergence:
Regular divergence is confirmed by an engulfing candle pattern. Bullish engulfing requires: (1) Previous candle is bearish (close < open ), (2) Current candle is bullish (close > open), (3) Current close > previous open, (4) Current open < previous close. Bearish engulfing is the inverse: previous bullish, current bearish, current close < previous open, current open > previous close. Strong divergence signals are marked with visual indicators (🐂 for bullish, 🐻 for bearish) and have separate alert conditions.
Hidden Divergence:
Continuation patterns that signal trend continuation rather than reversal. Bullish hidden divergence: Price makes a higher low (current low > lowest low from previous period) but RSI makes a lower low (current RSI < lowest RSI from previous period). Bearish hidden divergence: Price makes a lower high (current high < highest high from previous period) but RSI makes a higher high (current RSI > highest RSI from previous period). These patterns indicate the trend is likely to continue in the current direction.
Volume Confirmation System
Volume threshold filtering requires current volume to exceed the volume SMA multiplied by the threshold factor. The formula: Volume Confirmed = Volume > (Volume SMA × Threshold). If the threshold is set to 0.1 or lower, volume confirmation is effectively disabled (always returns true). This allows you to use the indicator without volume filtering if desired.
Volume Climax is detected when volume exceeds: Volume SMA + (Volume StdDev × Multiplier). This indicates potential capitulation moments where extreme volume accompanies price movements. Volume Dry-Up is detected when volume falls below: Volume SMA - (Volume StdDev × Multiplier), indicating low participation periods that may produce unreliable signals. The volume SMA is cached for performance, updating on confirmed and real-time bars.
Multi-RSI Synergy
The script generates signals when multiple RSI periods align in overbought or oversold zones. This creates a confirmation system that reduces false signals. In "ALL" mode, all three RSIs (6, 14, 24) must be simultaneously above the overbought threshold OR all three must be below the oversold threshold. In "2-of-3" mode, any two of the three RSIs must align in the same direction. The script counts how many RSIs are in each zone: twoOfThreeOB = ((rsi6OB ? 1 : 0) + (rsi14OB ? 1 : 0) + (rsi24OB ? 1 : 0)) >= 2.
Synergy signals require: (1) Multi-RSI alignment (ALL or 2-of-3), (2) Volume confirmation, (3) Reset condition satisfied (enough bars since last synergy signal), (4) Additional filters passed (RSI50, Trend, ADX, Volume Dry-Up avoidance). Separate reset conditions track buy and sell signals independently. The reset condition uses ta.barssince() to count bars since the last trigger, returning true if the condition never occurred (allowing first signal) or if enough bars have passed.
Regression Forecasting
The script uses historical RSI values to forecast future RSI direction using four methods. The forecast horizon is configurable (1-50 bars ahead). Historical data is collected into an array, and regression coefficients are calculated based on the selected method.
Linear Regression: Calculates the least-squares fit line (y = mx + b) through the last N RSI values. The calculation: meanX = sumX / horizon, meanY = sumY / horizon, denominator = sumX² - horizon × meanX², m = (sumXY - horizon × meanX × meanY) / denominator, b = meanY - m × meanX. The forecast projects this line forward: forecast = b + m × i for i = 1 to horizon.
Polynomial Regression: Fits a quadratic curve (y = ax² + bx + c) to capture non-linear trends. The system of equations is solved using Cramer's rule with a 3×3 determinant. If the determinant is too small (< 0.0001), the system falls back to linear regression. Coefficients are calculated by solving: n×c + sumX×b + sumX²×a = sumY, sumX×c + sumX²×b + sumX³×a = sumXY, sumX²×c + sumX³×b + sumX⁴×a = sumX²Y. Note: Due to the O(n³) computational complexity of polynomial regression, the forecast horizon is automatically limited to a maximum of 20 bars when using polynomial regression to maintain optimal performance. If you set a horizon greater than 20 bars with polynomial regression, it will be automatically capped at 20 bars.
Exponential Smoothing: Applies exponential smoothing with adaptive alpha = 2/(horizon+1). The smoothing iterates from oldest to newest value: smoothed = alpha × series + (1 - alpha) × smoothed. Trend is calculated by comparing current smoothed value to an earlier smoothed value (at 60% of horizon): trend = (smoothed - earlierSmoothed) / (horizon - earlierIdx). Forecast: forecast = base + trend × i.
Moving Average: Uses the difference between short MA (horizon/2) and long MA (horizon) to estimate trend direction. Trend = (maShort - maLong) / (longLen - shortLen). Forecast: forecast = maShort + trend × i.
Confidence bands are calculated using RMSE (Root Mean Squared Error) of historical forecast accuracy. The error calculation compares historical values with forecast values: RMSE = sqrt(sumSquaredError / count). If insufficient data exists, it falls back to calculating standard deviation of recent RSI values. Confidence bands = forecast ± (RMSE × confidenceLevel). All forecast values and confidence bands are clamped to 0-100 to remain within RSI bounds. The regression functions include comprehensive safety checks: horizon validation (must not exceed array size), empty array handling, edge case handling for horizon=1 scenarios, division-by-zero protection, and bounds checking for all array access operations to prevent runtime errors.
Strong Top/Bottom Detection
Strong buy signals require three conditions: (1) RSI is at its lowest point within the bottom period: rsiVal <= ta.lowest(rsiVal, bottomPeriod), (2) RSI is below the oversold threshold minus a buffer: rsiVal < (oversoldThreshold - rsiTopBottomBuffer), where rsiTopBottomBuffer = 2.0 RSI points, (3) The absolute difference between current RSI and the lowest RSI exceeds the threshold value: abs(rsiVal - ta.lowest(rsiVal, bottomPeriod)) > threshold. This indicates a bounce from extreme levels with sufficient distance from the absolute low.
Strong sell signals use the inverse logic: RSI at highest point, above overbought threshold + rsiTopBottomBuffer (2.0 RSI points), and difference from highest exceeds threshold. Both signals also require: volume confirmation, reset condition satisfied (separate reset for buy vs sell), and all additional filters passed (RSI50, Trend, ADX, Volume Dry-Up avoidance).
The reset condition uses separate logic for buy and sell: resetCondBuy checks bars since isRSIAtBottom, resetCondSell checks bars since isRSIAtTop. This ensures buy signals reset based on bottom conditions and sell signals reset based on top conditions, preventing incorrect signal blocking.
Filtering System
RSI(50) Filter: Only allows buy signals when RSI(14) > 50 (bullish momentum) and sell signals when RSI(14) < 50 (bearish momentum). This filter ensures you're buying in uptrends and selling in downtrends from a momentum perspective. The filter is optional and can be disabled. Recommended to enable for noise reduction.
Trend Filter: Uses a long-term EMA (default 200) to determine trend direction. Buy signals require price above EMA, sell signals require price below EMA. The EMA slope is calculated as: emaSlope = ema - ema . Optional EMA slope filter additionally requires the EMA to be rising (slope > 0) for buy signals or falling (slope < 0) for sell signals. This provides stronger trend confirmation by requiring both price position and EMA direction.
ADX Filter: Uses the Directional Movement Index (calculated via ta.dmi()) to measure trend strength. Signals only fire when ADX exceeds the threshold (default 20), indicating a strong trend rather than choppy markets. The ADX calculation uses separate length and smoothing parameters. This filter helps avoid signals during sideways/consolidation periods.
Volume Dry-Up Avoidance: Prevents signals during periods of extremely low volume relative to average. If volume dry-up is detected and the filter is enabled, signals are blocked. This helps avoid unreliable signals that occur during low participation periods.
RSI Momentum Confirmation: Requires RSI to be accelerating in the signal direction before confirming signals. For buy signals, RSI must be consistently rising (recovering from oversold) over the lookback period. For sell signals, RSI must be consistently falling (declining from overbought) over the lookback period. The momentum check verifies that all consecutive changes are in the correct direction AND the cumulative change is significant. This filter ensures signals only fire when RSI momentum aligns with the signal direction, reducing false signals from weak momentum.
Multi-Timeframe Confirmation: Requires higher timeframe RSI to align with the signal direction. For buy signals, current RSI must be below the higher timeframe RSI by at least the confirmation threshold. For sell signals, current RSI must be above the higher timeframe RSI by at least the confirmation threshold. This ensures signals align with the larger trend context, reducing counter-trend trades. The higher timeframe RSI is fetched using request.security() from the selected timeframe.
All filters use the pattern: filterResult = not filterEnabled OR conditionMet. This means if a filter is disabled, it always passes (returns true). Filters can be combined, and all must pass for a signal to fire.
RSI Centerline and Period Crossovers
RSI(50) Centerline Crossovers: Detects when the selected RSI source crosses above or below the 50 centerline. Bullish crossover: ta.crossover(rsiSource, 50), bearish crossover: ta.crossunder(rsiSource, 50). You can select which RSI (6, 14, or 24) to use for these crossovers. These signals indicate momentum shifts from bearish to bullish (above 50) or bullish to bearish (below 50).
RSI Period Crossovers: Detects when different RSI periods cross each other. Available pairs: RSI(6) × RSI(14), RSI(14) × RSI(24), or RSI(6) × RSI(24). Bullish crossover: fast RSI crosses above slow RSI (ta.crossover(rsiFast, rsiSlow)), indicating momentum acceleration. Bearish crossover: fast RSI crosses below slow RSI (ta.crossunder(rsiFast, rsiSlow)), indicating momentum deceleration. These crossovers can signal shifts in momentum before price moves.
StochRSI Calculation
Stochastic RSI applies the Stochastic oscillator formula to RSI values instead of price. The calculation: %K = ((RSI - Lowest RSI) / (Highest RSI - Lowest RSI)) × 100, where the lookback is the StochRSI length. If the range is zero, %K defaults to 50.0. %K is then smoothed using SMA with the %K smoothing length. %D is calculated as SMA of smoothed %K with the %D smoothing length. All values are clamped to 0-100. You can select which RSI (6, 14, or 24) to use as the source for StochRSI calculation.
RSI Bollinger Bands
Bollinger Bands are applied to RSI(14) instead of price. The calculation: Basis = SMA(RSI(14), BB Period), StdDev = stdev(RSI(14), BB Period), Upper = Basis + (StdDev × Deviation Multiplier), Lower = Basis - (StdDev × Deviation Multiplier). This creates dynamic zones around RSI that adapt to RSI volatility. When RSI touches or exceeds the bands, it indicates extreme conditions relative to recent RSI behavior.
Noise Reduction System
The script includes a comprehensive noise reduction system to filter false signals and improve accuracy. When enabled, signals must pass multiple quality checks:
Signal Strength Requirement: RSI must be at least X points away from the centerline (50). For buy signals, RSI must be at least X points below 50. For sell signals, RSI must be at least X points above 50. This ensures signals only trigger when RSI is significantly in oversold/overbought territory, not just near neutral.
Extreme Zone Requirement: RSI must be deep in the OB/OS zone. For buy signals, RSI must be at least X points below the oversold threshold. For sell signals, RSI must be at least X points above the overbought threshold. This ensures signals only fire in extreme conditions where reversals are more likely.
Consecutive Bar Confirmation: The signal condition must persist for N consecutive bars before triggering. This reduces false signals from single-bar spikes or noise. The confirmation checks that the signal condition was true for all bars in the lookback period.
Zone Persistence (Optional): Requires RSI to remain in the OB/OS zone for N consecutive bars, not just touch it. This ensures RSI is truly in an extreme state rather than just briefly touching the threshold. When enabled, this provides stricter filtering for higher-quality signals.
RSI Slope Confirmation (Optional): Requires RSI to be moving in the expected signal direction. For buy signals, RSI should be rising (recovering from oversold). For sell signals, RSI should be falling (declining from overbought). This ensures momentum is aligned with the signal direction. The slope is calculated by comparing current RSI to RSI N bars ago.
All noise reduction filters can be enabled/disabled independently, allowing you to customize the balance between signal frequency and accuracy. The default settings provide a good balance, but you can adjust them based on your trading style and market conditions.
Alert System
The script includes separate alert conditions for each signal type: buy/sell (adaptive RSI crossovers), divergence (regular, strong, hidden), crossovers (RSI50 centerline, RSI period crossovers), synergy signals, and trend breaks. Each alert type has its own alertcondition() declaration with a unique title and message.
An optional cooldown system prevents alert spam by requiring a minimum number of bars between alerts of the same type. The cooldown check: canAlert = na(lastAlertBar) OR (bar_index - lastAlertBar >= cooldownBars). If the last alert bar is na (first alert), it always allows the alert. Each alert type maintains its own lastAlertBar variable, so cooldowns are independent per signal type. The default cooldown is 10 bars, which is recommended for noise reduction.
Higher Timeframe RSI
The script can display RSI from a higher timeframe using request.security(). This allows you to see the RSI context from a larger timeframe (e.g., daily RSI on an hourly chart). The higher timeframe RSI uses RSI(14) calculation from the selected timeframe. This provides context for the current timeframe's RSI position relative to the larger trend.
RSI Pivot Trendlines
The script can draw trendlines connecting pivot highs and lows on RSI(6). This feature helps visualize RSI trends and identify potential trend breaks.
Pivot Detection: Pivots are detected using a configurable period. The script can require pivots to have minimum strength (RSI points difference from surrounding bars) to filter out weak pivots. Lower minPivotStrength values detect more pivots (more trendlines), while higher values detect only stronger pivots (fewer but more significant trendlines). Pivot confirmation is optional: when enabled, the script waits N bars to confirm the pivot remains the extreme, reducing repainting. Pivot confirmation functions (f_confirmPivotLow and f_confirmPivotHigh) are always called on every bar for consistency, as recommended by TradingView. When pivot bars are not available (na), safe default values are used, and the results are then used conditionally based on confirmation settings. This ensures consistent calculations and prevents calculation inconsistencies.
Trendline Drawing: Uptrend lines connect confirmed pivot lows (green), and downtrend lines connect confirmed pivot highs (red). By default, only the most recent trendline is shown (old trendlines are deleted when new pivots are confirmed). This keeps the chart clean and uncluttered. If "Keep Historical Trendlines" is enabled, the script preserves up to N historical trendlines (configurable via "Max Trendlines to Keep", default 5). When historical trendlines are enabled, old trendlines are saved to arrays instead of being deleted, allowing you to see multiple trendlines simultaneously for better trend analysis. The arrays are automatically limited to prevent memory accumulation.
Trend Break Detection: Signals are generated when RSI breaks above or below trendlines. Uptrend breaks (RSI crosses below uptrend line) generate buy signals. Downtrend breaks (RSI crosses above downtrend line) generate sell signals. Optional trend break confirmation requires the break to persist for N bars and optionally include volume confirmation. Trendline angle filtering can exclude flat/weak trendlines from generating signals (minTrendlineAngle > 0 filters out weak/flat trendlines).
How Components Work Together
The combination of multiple RSI periods provides confirmation across different timeframes, reducing false signals. RSI(6) catches early moves, RSI(14) provides balanced signals, and RSI(24) confirms longer-term trends. When all three align (synergy), it indicates strong consensus across timeframes.
Volume confirmation ensures signals occur with sufficient market participation, filtering out low-volume false breakouts. Volume climax detection identifies potential reversal points, while volume dry-up avoidance prevents signals during unreliable low-volume periods.
Trend filters align signals with the overall market direction. The EMA filter ensures you're trading with the trend, and the EMA slope filter adds an additional layer by requiring the trend to be strengthening (rising EMA for buys, falling EMA for sells).
ADX filter ensures signals only fire during strong trends, avoiding choppy/consolidation periods. RSI(50) filter ensures momentum alignment with the trade direction.
Momentum confirmation requires RSI to be accelerating in the signal direction, ensuring signals only fire when momentum is aligned. Multi-timeframe confirmation ensures signals align with higher timeframe trends, reducing counter-trend trades.
Divergence detection identifies potential reversals before they occur, providing early warning signals. Pivot-based divergence provides more accurate detection by using actual pivot points. Hidden divergence identifies continuation patterns, useful for trend-following strategies.
The noise reduction system combines multiple filters (signal strength, extreme zone, consecutive bars, zone persistence, RSI slope) to significantly reduce false signals. These filters work together to ensure only high-quality signals are generated.
The synergy system requires alignment across all RSI periods for highest-quality signals, significantly reducing false positives. Regression forecasting provides forward-looking context, helping anticipate potential RSI direction changes.
Pivot trendlines provide visual trend analysis and can generate signals when RSI breaks trendlines, indicating potential reversals or continuations.
Reset conditions prevent signal spam by requiring a minimum number of bars between signals. Separate reset conditions for buy and sell signals ensure proper signal management.
Usage Instructions
Configuration Presets (Recommended): The script includes optimized preset configurations for instant setup. Simply select your trading style from the "Configuration Preset" dropdown:
- Scalping Preset: RSI(4, 7, 9) with minimal smoothing. Noise reduction disabled, momentum confirmation disabled for fastest signals.
- Day Trading Preset: RSI(6, 9, 14) with light smoothing. Momentum confirmation enabled for better signal quality.
- Swing Trading Preset: RSI(14, 14, 21) with moderate smoothing. Balanced configuration for medium-term trades.
- Position Trading Preset: RSI(24, 21, 28) with heavier smoothing. Optimized for longer-term positions with all filters active.
- Custom Mode: Full manual control over all settings. Default behavior matches previous script versions.
Presets automatically configure RSI periods, smoothing lengths, and filter settings. You can still manually adjust any setting after selecting a preset if needed.
Getting Started: The easiest way to get started is to select a configuration preset matching your trading style (Scalping, Day Trading, Swing Trading, or Position Trading) from the "Configuration Preset" dropdown. This instantly configures all settings for optimal performance. Alternatively, use "Custom" mode for full manual control. The default configuration (Custom mode) shows RSI(6), RSI(14), and RSI(24) with their default smoothing. Overbought/oversold fill zones are enabled by default.
Customizing RSI Periods: Adjust the RSI lengths (6, 14, 24) based on your trading timeframe. Shorter periods (6) for scalping, standard (14) for day trading, longer (24) for swing trading. You can disable any RSI period you don't need.
Smoothing Selection: Choose smoothing method based on your needs. EMA provides balanced smoothing, RMA (Wilder's) is traditional, Zero-Lag reduces lag but may increase noise. Adjust smoothing lengths individually or use global smoothing for consistency. Note: Smoothing lengths are automatically validated to ensure they are always less than the corresponding RSI period length. If you set smoothing >= RSI length, it will be auto-adjusted to prevent invalid configurations.
Dynamic OB/OS: The dynamic thresholds automatically adapt to volatility. Adjust the volatility multiplier and base percentage to fine-tune sensitivity. Higher values create wider thresholds in volatile markets.
Volume Confirmation: Set volume threshold to 1.2 (default) for standard confirmation, higher for stricter filtering, or 0.1 to disable volume filtering entirely.
Multi-RSI Synergy: Use "ALL" mode for highest-quality signals (all 3 RSIs must align), or "2-of-3" mode for more frequent signals. Adjust the reset period to control signal frequency.
Filters: Enable filters gradually to find your preferred balance. Start with volume confirmation, then add trend filter, then ADX for strongest confirmation. RSI(50) filter is useful for momentum-based strategies and is recommended for noise reduction. Momentum confirmation and multi-timeframe confirmation add additional layers of accuracy but may reduce signal frequency.
Noise Reduction: The noise reduction system is enabled by default with balanced settings. Adjust minSignalStrength (default 3.0) to control how far RSI must be from centerline. Increase requireConsecutiveBars (default 1) to require signals to persist longer. Enable requireZonePersistence and requireRsiSlope for stricter filtering (higher quality but fewer signals). Start with defaults and adjust based on your needs.
Divergence: Enable divergence detection and adjust lookback periods. Strong divergence (with engulfing confirmation) provides higher-quality signals. Hidden divergence is useful for trend-following strategies. Enable pivot-based divergence for more accurate detection using actual pivot points instead of simple lowest/highest comparisons. Pivot-based divergence uses tolerance-based matching (1% for price, 1.0 RSI point for RSI) for better accuracy.
Forecasting: Enable regression forecasting to see potential RSI direction. Linear regression is simplest, polynomial captures curves, exponential smoothing adapts to trends. Adjust horizon based on your trading timeframe. Confidence bands show forecast uncertainty - wider bands indicate less reliable forecasts.
Pivot Trendlines: Enable pivot trendlines to visualize RSI trends and identify trend breaks. Adjust pivot detection period (default 5) - higher values detect fewer but stronger pivots. Enable pivot confirmation (default ON) to reduce repainting. Set minPivotStrength (default 1.0) to filter weak pivots - lower values detect more pivots (more trendlines), higher values detect only stronger pivots (fewer trendlines). Enable "Keep Historical Trendlines" to preserve multiple trendlines instead of just the most recent one. Set "Max Trendlines to Keep" (default 5) to control how many historical trendlines are preserved. Enable trend break confirmation for more reliable break signals. Adjust minTrendlineAngle (default 0.0) to filter flat trendlines - set to 0.1-0.5 to exclude weak trendlines.
Alerts: Set up alerts for your preferred signal types. Enable cooldown to prevent alert spam. Each signal type has its own alert condition, so you can be selective about which signals trigger alerts.
Visual Elements and Signal Markers
The script uses various visual markers to indicate signals and conditions:
- "sBottom" label (green): Strong bottom signal - RSI at extreme low with strong buy conditions
- "sTop" label (red): Strong top signal - RSI at extreme high with strong sell conditions
- "SyBuy" label (lime): Multi-RSI synergy buy signal - all RSIs aligned oversold
- "SySell" label (red): Multi-RSI synergy sell signal - all RSIs aligned overbought
- 🐂 emoji (green): Strong bullish divergence detected
- 🐻 emoji (red): Strong bearish divergence detected
- 🔆 emoji: Weak divergence signals (if enabled)
- "H-Bull" label: Hidden bullish divergence
- "H-Bear" label: Hidden bearish divergence
- ⚡ marker (top of pane): Volume climax detected (extreme volume) - positioned at top for visibility
- 💧 marker (top of pane): Volume dry-up detected (very low volume) - positioned at top for visibility
- ↑ triangle (lime): Uptrend break signal - RSI breaks below uptrend line
- ↓ triangle (red): Downtrend break signal - RSI breaks above downtrend line
- Triangle up (lime): RSI(50) bullish crossover
- Triangle down (red): RSI(50) bearish crossover
- Circle markers: RSI period crossovers
All markers are positioned at the RSI value where the signal occurs, using location.absolute for precise placement.
Signal Priority and Interpretation
Signals are generated independently and can occur simultaneously. Higher-priority signals generally indicate stronger setups:
1. Multi-RSI Synergy signals (SyBuy/SySell) - Highest priority: Requires alignment across all RSI periods plus volume and filter confirmation. These are the most reliable signals.
2. Strong Top/Bottom signals (sTop/sBottom) - High priority: Indicates extreme RSI levels with strong bounce conditions. Requires volume confirmation and all filters.
3. Divergence signals - Medium-High priority: Strong divergence (with engulfing) is more reliable than regular divergence. Hidden divergence indicates continuation rather than reversal.
4. Adaptive RSI crossovers - Medium priority: Buy when adaptive RSI crosses below dynamic oversold, sell when it crosses above dynamic overbought. These use volatility-adjusted RSI for more accurate signals.
5. RSI(50) centerline crossovers - Medium priority: Momentum shift signals. Less reliable alone but useful when combined with other confirmations.
6. RSI period crossovers - Lower priority: Early momentum shift indicators. Can provide early warning but may produce false signals in choppy markets.
Best practice: Wait for multiple confirmations. For example, a synergy signal combined with divergence and volume climax provides the strongest setup.
Chart Requirements
For proper script functionality and compliance with TradingView requirements, ensure your chart displays:
- Symbol name: The trading pair or instrument name should be visible
- Timeframe: The chart timeframe should be clearly displayed
- Script name: "Ultimate RSI " should be visible in the indicator title
These elements help traders understand what they're viewing and ensure proper script identification. The script automatically includes this information in the indicator title and chart labels.
Performance Considerations
The script is optimized for performance:
- ATR and Volume SMA are cached using var variables, updating only on confirmed and real-time bars to reduce redundant calculations
- Forecast line arrays are dynamically managed: lines are reused when possible, and unused lines are deleted to prevent memory accumulation
- Calculations use efficient Pine Script functions (ta.rsi, ta.ema, etc.) which are optimized by TradingView
- Array operations are minimized where possible, with direct calculations preferred
- Polynomial regression automatically caps the forecast horizon at 20 bars (POLYNOMIAL_MAX_HORIZON constant) to prevent performance degradation, as polynomial regression has O(n³) complexity. This safeguard ensures optimal performance even with large horizon settings
- Pivot detection includes edge case handling to ensure reliable calculations even on early bars with limited historical data. Regression forecasting functions include comprehensive safety checks: horizon validation (must not exceed array size), empty array handling, edge case handling for horizon=1 scenarios, and division-by-zero protection in all mathematical operations
The script should perform well on all timeframes. On very long historical data, forecast lines may accumulate if the horizon is large; consider reducing the forecast horizon if you experience performance issues. The polynomial regression performance safeguard automatically prevents performance issues for that specific regression type.
Known Limitations and Considerations
- Forecast lines are forward-looking projections and should not be used as definitive predictions. They provide context but are not guaranteed to be accurate.
- Dynamic OB/OS thresholds can exceed 100 or go below 0 in extreme volatility scenarios, but are clamped to 0-100 range. This means in very volatile markets, the dynamic thresholds may not widen as much as the raw calculation suggests.
- Volume confirmation requires sufficient historical volume data. On new instruments or very short timeframes, volume calculations may be less reliable.
- Higher timeframe RSI uses request.security() which may have slight delays on some data feeds.
- Regression forecasting requires at least N bars of history (where N = forecast horizon) before it can generate forecasts. Early bars will not show forecast lines.
- StochRSI calculation requires the selected RSI source to have sufficient history. Very short RSI periods on new charts may produce less reliable StochRSI values initially.
Practical Use Cases
The indicator can be configured for different trading styles and timeframes:
Swing Trading: Select the "Swing Trading" preset for instant optimal configuration. This preset uses RSI periods (14, 14, 21) with moderate smoothing. Alternatively, manually configure: Use RSI(24) with Multi-RSI Synergy in "ALL" mode, combined with trend filter (EMA 200) and ADX filter. This configuration provides high-probability setups with strong confirmation across multiple RSI periods.
Day Trading: Select the "Day Trading" preset for instant optimal configuration. This preset uses RSI periods (6, 9, 14) with light smoothing and momentum confirmation enabled. Alternatively, manually configure: Use RSI(6) with Zero-Lag smoothing for fast signal detection. Enable volume confirmation with threshold 1.2-1.5 for reliable entries. Combine with RSI(50) filter to ensure momentum alignment. Strong top/bottom signals work well for day trading reversals.
Trend Following: Enable trend filter (EMA) and EMA slope filter for strong trend confirmation. Use RSI(14) or RSI(24) with ADX filter to avoid choppy markets. Hidden divergence signals are useful for trend continuation entries.
Reversal Trading: Focus on divergence detection (regular and strong) combined with strong top/bottom signals. Enable volume climax detection to identify capitulation moments. Use RSI(6) for early reversal signals, confirmed by RSI(14) and RSI(24).
Forecasting and Planning: Enable regression forecasting with polynomial or exponential smoothing methods. Use forecast horizon of 10-20 bars for swing trading, 5-10 bars for day trading. Confidence bands help assess forecast reliability.
Multi-Timeframe Analysis: Enable higher timeframe RSI to see context from larger timeframes. For example, use daily RSI on hourly charts to understand the larger trend context. This helps avoid counter-trend trades.
Scalping: Select the "Scalping" preset for instant optimal configuration. This preset uses RSI periods (4, 7, 9) with minimal smoothing, disables noise reduction, and disables momentum confirmation for faster signals. Alternatively, manually configure: Use RSI(6) with minimal smoothing (or Zero-Lag) for ultra-fast signals. Disable most filters except volume confirmation. Use RSI period crossovers (RSI(6) × RSI(14)) for early momentum shifts. Set volume threshold to 1.0-1.2 for less restrictive filtering.
Position Trading: Select the "Position Trading" preset for instant optimal configuration. This preset uses extended RSI periods (24, 21, 28) with heavier smoothing, optimized for longer-term trades. Alternatively, manually configure: Use RSI(24) with all filters enabled (Trend, ADX, RSI(50), Volume Dry-Up avoidance). Multi-RSI Synergy in "ALL" mode provides highest-quality signals.
Practical Tips and Best Practices
Getting Started: The fastest way to get started is to select a configuration preset that matches your trading style. Simply choose "Scalping", "Day Trading", "Swing Trading", or "Position Trading" from the "Configuration Preset" dropdown to instantly configure all settings optimally. For advanced users, use "Custom" mode for full manual control. The default configuration (Custom mode) is balanced and works well across different markets. After observing behavior, customize settings to match your trading style.
Reducing Repainting: All signals are based on confirmed bars, minimizing repainting. The script uses confirmed bar data for all calculations to ensure backtesting accuracy.
Signal Quality: Multi-RSI Synergy signals in "ALL" mode provide the highest-quality signals because they require alignment across all three RSI periods. These signals have lower frequency but higher reliability. For more frequent signals, use "2-of-3" mode. The noise reduction system further improves signal quality by requiring multiple confirmations (signal strength, extreme zone, consecutive bars, optional zone persistence and RSI slope). Adjust noise reduction settings to balance signal frequency vs. accuracy.
Filter Combinations: Start with volume confirmation, then add trend filter for trend alignment, then ADX filter for trend strength. Combining all three filters significantly reduces false signals but also reduces signal frequency. Find your balance based on your risk tolerance.
Volume Filtering: Set volume threshold to 0.1 or lower to effectively disable volume filtering if you trade instruments with unreliable volume data or want to test without volume confirmation. Standard confirmation uses 1.2-1.5 threshold.
RSI Period Selection: RSI(6) is most sensitive and best for scalping or early signal detection. RSI(14) provides balanced signals suitable for day trading. RSI(24) is smoother and better for swing trading and trend confirmation. You can disable any RSI period you don't need to reduce visual clutter.
Smoothing Methods: EMA provides balanced smoothing with moderate lag. RMA (Wilder's smoothing) is traditional and works well for RSI. Zero-Lag reduces lag but may increase noise. WMA gives more weight to recent values. Choose based on your preference for responsiveness vs. smoothness.
Forecasting: Linear regression is simplest and works well for trending markets. Polynomial regression captures curves and works better in ranging markets. Exponential smoothing adapts to trends. Moving average method is most conservative. Use confidence bands to assess forecast reliability.
Divergence: Strong divergence (with engulfing confirmation) is more reliable than regular divergence. Hidden divergence indicates continuation rather than reversal, useful for trend-following strategies. Pivot-based divergence provides more accurate detection by using actual pivot points instead of simple lowest/highest comparisons. Adjust lookback periods based on your timeframe: shorter for day trading, longer for swing trading. Pivot divergence period (default 5) controls the sensitivity of pivot detection.
Dynamic Thresholds: Dynamic OB/OS thresholds automatically adapt to volatility. In volatile markets, thresholds widen; in calm markets, they narrow. Adjust the volatility multiplier and base percentage to fine-tune sensitivity. Higher values create wider thresholds in volatile markets.
Alert Management: Enable alert cooldown (default 10 bars, recommended) to prevent alert spam. Each alert type has its own cooldown, so you can set different cooldowns for different signal types. For example, use shorter cooldown for synergy signals (high quality) and longer cooldown for crossovers (more frequent). The cooldown system works independently for each signal type, preventing spam while allowing different signal types to fire when appropriate.
Technical Specifications
- Pine Script Version: v6
- Indicator Type: Non-overlay (displays in separate panel below price chart)
- Repainting Behavior: Minimal - all signals are based on confirmed bars, ensuring accurate backtesting results
- Performance: Optimized with caching for ATR and volume calculations. Forecast arrays are dynamically managed to prevent memory accumulation.
- Compatibility: Works on all timeframes (1 minute to 1 month) and all instruments (stocks, forex, crypto, futures, etc.)
- Edge Case Handling: All calculations include safety checks for division by zero, NA values, and boundary conditions. Reset conditions and alert cooldowns handle edge cases where conditions never occurred or values are NA.
- Reset Logic: Separate reset conditions for buy signals (based on bottom conditions) and sell signals (based on top conditions) ensure logical correctness.
- Input Parameters: 60+ customizable parameters organized into logical groups for easy configuration. Configuration presets available for instant setup (Scalping, Day Trading, Swing Trading, Position Trading, Custom).
- Noise Reduction: Comprehensive noise reduction system with multiple filters (signal strength, extreme zone, consecutive bars, zone persistence, RSI slope) to reduce false signals.
- Pivot-Based Divergence: Enhanced divergence detection using actual pivot points for improved accuracy.
- Momentum Confirmation: RSI momentum filter ensures signals only fire when RSI is accelerating in the signal direction.
- Multi-Timeframe Confirmation: Optional higher timeframe RSI alignment for trend confirmation.
- Enhanced Pivot Trendlines: Trendline drawing with strength requirements, confirmation, and trend break detection.
Technical Notes
- All RSI values are clamped to 0-100 range to ensure valid oscillator values
- ATR and Volume SMA are cached for performance, updating on confirmed and real-time bars
- Reset conditions handle edge cases: if a condition never occurred, reset returns true (allows first signal)
- Alert cooldown handles na values: if no previous alert, cooldown allows the alert
- Forecast arrays are dynamically sized based on horizon, with unused lines cleaned up
- Fill logic uses a minimum gap (0.1) to ensure reliable polygon rendering in TradingView
- All calculations include safety checks for division by zero and boundary conditions. Regression functions validate that horizon doesn't exceed array size, and all array access operations include bounds checking to prevent out-of-bounds errors
- The script uses separate reset conditions for buy signals (based on bottom conditions) and sell signals (based on top conditions) for logical correctness
- Background coloring uses a fallback system: dynamic color takes priority, then RSI(6) heatmap, then monotone if both are disabled
- Noise reduction filters are applied after accuracy filters, providing multiple layers of signal quality control
- Pivot trendlines use strength requirements to filter weak pivots, reducing noise in trendline drawing. Historical trendlines are stored in arrays and automatically limited to prevent memory accumulation when "Keep Historical Trendlines" is enabled
- Volume climax and dry-up markers are positioned at the top of the pane for better visibility
- All calculations are optimized with conditional execution - features only calculate when enabled (performance optimization)
- Input Validation: Automatic cross-input validation ensures smoothing lengths are always less than RSI period lengths, preventing configuration errors
- Configuration Presets: Four optimized preset configurations (Scalping, Day Trading, Swing Trading, Position Trading) for instant setup, plus Custom mode for full manual control
- Constants Management: Magic numbers extracted to documented constants for improved maintainability and easier tuning (pivot tolerance, divergence thresholds, fill gap, etc.)
- TradingView Function Consistency: All TradingView functions (ta.crossover, ta.crossunder, ta.atr, ta.lowest, ta.highest, ta.lowestbars, ta.highestbars, etc.) and custom functions that depend on historical results (f_consecutiveBarConfirmation, f_rsiSlopeConfirmation, f_rsiZonePersistence, f_applyAllFilters, f_rsiMomentum, f_forecast, f_confirmPivotLow, f_confirmPivotHigh) are called on every bar for consistency, as recommended by TradingView. Results are then used conditionally when needed. This ensures consistent calculations and prevents calculation inconsistencies.

Open Interest RSI [BackQuant]Open Interest RSI
A multi-venue open interest oscillator that aggregates OI across major derivatives exchanges, converts it to coin or USD terms, and runs an RSI-style engine on that aggregated OI so you can track positioning pressure, crowding, and mean reversion in leverage flows, not just in price.
What this is
This tool is an RSI built on top of aggregated open interest instead of price. It pulls futures OI from several major exchanges, converts it into a unified unit (COIN or USD), sums it into a single synthetic OI candle, then applies RSI and smoothing to that combined series.
You can then render that Open Interest RSI in different visual modes:
Clean line or colored line for classic oscillator-style reads.
Column-style oscillator for impulse and compression views.
Flag mode that fills between OI RSI and its EMA for trend/mean reversion blends. See:
Heatmap mode that paints the panel based on OI RSI extremes, ideal for scanning. See:
On top of that it includes:
Aggregated OI source selection (Binance, Bybit, OKX, Bitget, Kraken, HTX, Deribit).
Choice of OI units (COIN or USD).
Reference lines and OB/OS zones.
Extreme highlighting for either trend or mean reversion.
A vertical OI RSI meter that acts as a quick strength gauge.
Aggregated open interest source
Under the hood, the indicator builds a synthetic open interest candle by:
Looping over a list of supported exchanges: Binance, Bybit, OKX, Bitget, Kraken, HTX, Deribit.
Looping over multiple contract suffixes (such as USDT.P, USD.P, USDC.P, USD.PM) to capture different contract types on each venue.
Requesting OI candles from each venue + contract combination for the same underlying symbol.
Converting each OI stream into a common unit: In COIN mode, everything is normalized into coin-denominated OI. In USD mode, coin OI is multiplied by price to approximate notional OI.
Summing up open, high, low and close of OI across venues into a single aggregated OI candle.
If no valid OI is available for the current symbol across all sources, the script throws a clear runtime error so you know you are on an unsupported market.
This gives you a single, exchange-agnostic open interest curve instead of being tied to one venue. That aggregated OI is then passed into the RSI logic.
How the OI RSI is calculated
The RSI side is straightforward, but it is applied to the aggregated OI close:
Compute a base RSI of aggregated OI using the Calculation Period .
Apply a simple moving average of length Smoothing Period (SMA) to reduce noise in the raw OI RSI.
Optionally apply an EMA on top of the smoothed OI RSI as a moving average signal line.
Key parameters:
Calculation Period – base RSI length for OI.
Smoothing Period (SMA) – extra smoothing on the RSI value.
EMA Period – EMA length on the smoothed OI RSI.
The result is:
oi_rsi – raw RSI of aggregated OI.
oi_rsi_s – SMA-smoothed OI RSI.
ma – EMA of the smoothed OI RSI.
Thresholds and extremes
You control three core thresholds:
Mid Point – central reference level, typically 50.
Extreme Upper Threshold – high-level OI RSI edge (for example 80).
Extreme Lower Threshold – low-level OI RSI edge (for example 20).
These thresholds are used for:
Reference lines or OB/OS zone fills.
Heatmap gradient bounds.
Background highlighting of extremes.
The Extreme Highlighting mode controls how extremes are interpreted:
None – do nothing special in extreme regions.
Mean-Rev – background turns red on high OI RSI and green on low OI RSI, framing extremes as contrarian zones.
Trend – background turns green on high OI RSI and red on low OI RSI, framing extremes as participation zones aligned with the prevailing move.
Reference lines and OB/OS zones
You can choose:
None – clean plotting without guides.
Basic Reference Lines – mid, upper and lower thresholds as simple gray horizontals.
OB/OS Levels – filled zones between:
Upper OB: from the upper threshold to 100, colored with the short/overbought color.
Lower OS: from 0 to the lower threshold, colored with the long/oversold color.
These guides help visually anchor the OI RSI within "normal" versus "extreme" regions.
Plotting modes
The Plotting Type input controls how OI RSI is drawn. All modes share the same underlying OI and RSI logic, but emphasise different aspects of the signal.
1) Line mode
This is the classic oscillator representation:
Plots the smoothed OI RSI as a simple line using RSI Line Color and RSI Line Width .
Optionally plots the EMA overlay on the same panel.
Works well when you want standard RSI-style signals on leverage flows: crosses of the midline, divergences versus price, and so on.
2) Colored Line mode
In this mode:
The OI RSI is plotted as a line, but its color is dynamic.
If the smoothed OI RSI is above the mid point, it uses the Long/OB Color .
If it is below the mid point, it uses the Short/OS Color .
This creates an instant visual regime switch between "bullish positioning pressure" and "bearish positioning pressure", while retaining the feel of a traditional RSI line.
3) Oscillator mode
Oscillator mode renders OI RSI as vertical columns around the mid level:
The smoothed OI RSI is plotted as columns using plot.style_columns .
The histogram base is fixed at 50, so bars extend above and below the mid line.
Bar color is dynamic, using long or short colors depending on which side of the mid point the value sits.
This representation makes impulse and compression in OI flows more obvious. It is especially useful when you want to focus on how quickly OI RSI is expanding or contracting around its neutral level. See:
4) Flag mode
Flag mode turns OI RSI and its EMA into a two-line band with a filled area between them:
The smoothed OI RSI and its EMA are both plotted.
A fill is drawn between them.
The fill color flips between the long color and the short color depending on whether OI RSI is above or below its EMA.
Black outlines are added to both lines to make the band clear against any background.
This creates a "flag" style region where:
Green fills show OI RSI leading its EMA, suggesting positive positioning momentum.
Red fills show OI RSI trailing below its EMA, suggesting negative positioning momentum.
Crossovers of the two lines can be read as shifts in OI momentum regime.
Flag mode is useful if you want a more structural view that combines both the level and slope behaviour of OI RSI. See:
5) Heatmap mode
Heatmap mode recasts OI RSI as a single-row gradient instead of a line:
A single row at level 1 is plotted using column style.
The color is pulled from a gradient between the lower and upper thresholds: Near the lower threshold it approaches the short/oversold color and near the upper threshold it approaches the long/overbought color.
The EMA overlay and reference lines are disabled in this mode to keep the panel clean.
This is a very compact way to track OI RSI state at a glance, especially when stacking it alongside other indicators. See:
OI RSI vertical meter
Beyond the main plot, the script can draw a small "thermometer" table showing the current OI RSI position from 0 to 100:
The meter is a two-column table with a configurable number of rows.
Row colors form an inverted gradient: red at the top (100) and green at the bottom (0).
The script clamps OI RSI between 0 and 100 and maps it to a row index.
An arrow marker "▶" is drawn next to the row corresponding to the current OI RSI value.
0 and 100 labels are printed at the ends of the scale for orientation.
You control:
Show OI RSI Meter – turn the meter on or off.
OI RSI Blocks – number of vertical blocks (granularity).
OI RSI Meter Position – panel anchor (top/bottom, left/center/right).
The meter is particularly helpful if you keep the main plot in a small panel but still want an intuitive strength gauge.
How to read it as a market pressure gauge
Because this is an RSI built on aggregated open interest, its extremes and regimes speak to positioning pressure rather than price alone:
High OI RSI (near or above the upper threshold) indicates that open interest has been increasing aggressively relative to its recent history. This often coincides with crowded leverage and a buildup of directional pressure.
Low OI RSI (near or below the lower threshold) indicates aggressive de-leveraging or closing of positions, often associated with flushes, forced unwinds or post-liquidation clean-ups.
Values around the mid point indicate more balanced positioning flows.
You can combine this with price action:
Price up with rising OI RSI suggests fresh leverage joining the move, a more persistent trend.
Price up with falling OI RSI suggests shorts covering or longs taking profit, more fragile upside.
Price down with rising OI RSI suggests aggressive new shorts or levered selling.
Price down with falling OI RSI suggests de-leveraging and potential exhaustion of the move.
Trading applications
Trend confirmation on leverage flows
Use OI RSI to confirm or question a price trend:
In an uptrend, rising OI RSI with values above the mid point indicates supportive leverage flows.
In an uptrend, repeated failures to lift OI RSI above mid point or persistent weakness suggest less committed participation.
In a downtrend, strong OI RSI on the downside points to aggressive shorting.
Mean reversion in positioning
Use thresholds and the Mean-Rev highlight mode:
When OI RSI spends extended time above the upper threshold, the crowd is extended on one side. That can set up squeeze risk in the opposite direction.
When OI RSI has been pinned low, it suggests heavy de-leveraging. Once price stabilises, a re-risking phase is often not far away.
Background colours in Mean-Rev mode help visually identify these periods.
Regime mapping with plotting modes
Different plotting modes give different perspectives:
Heatmap mode for dashboard-style use where you just need to know "hot", "neutral" or "cold" on OI flows at a glance.
Oscillator mode for short term impulses and compression reads around the mid line. See:
Flag mode for blending level and trend of OI RSI into a single banded visual. See:
Settings overview
RSI group
Plotting Type – None, Line, Colored Line, Oscillator, Flag, Heatmap.
Calculation Period – base RSI length for OI.
Smoothing Period (SMA) – smoothing on RSI.
Moving Average group
Show EMA – toggle EMA overlay (not used in heatmap).
EMA Period – length of EMA on OI RSI.
EMA Color – colour of EMA line.
Thresholds group
Mid Point – central reference.
Extreme Upper Threshold and Extreme Lower Threshold – OB/OS thresholds.
Select Reference Lines – none, basic lines or OB/OS zone fills.
Extreme Highlighting – None, Mean-Rev, Trend.
Extra Plotting and UI
RSI Line Color and RSI Line Width .
Long/OB Color and Short/OS Color .
Show OI RSI Meter , OI RSI Blocks , OI RSI Meter Position .
Open Interest Source
OI Units – COIN or USD.
Exchange toggles: Binance, Bybit, OKX, Bitget, Kraken, HTX, Deribit.
Notes
This is a positioning and pressure tool, not a complete system. It:
Models aggregated futures open interest across multiple centralized exchanges.
Transforms that OI into an RSI-style oscillator for better comparability across regimes.
Offers several visual modes to match different workflows, from detailed analysis to compact dashboards.
Use it to understand how leverage and positioning are evolving behind the price, to gauge when the crowd is stretched, and to decide whether to lean with or against that pressure. Attach it to your existing signals, not in place of them.
Also, please check out @NoveltyTrade for the OI Aggregation logic & pulling the data source!
Here is the original script:

Machine Learning: Optimal RSI [YinYangAlgorithms]This Indicator, will rate multiple different lengths of RSIs to determine which RSI to RSI MA cross produced the highest profit within the lookback span. This ‘Optimal RSI’ is then passed back, and if toggled will then be thrown into a Machine Learning calculation. You have the option to Filter RSI and RSI MA’s within the Machine Learning calculation. What this does is, only other Optimal RSI’s which are in the same bullish or bearish direction (is the RSI above or below the RSI MA) will be added to the calculation.
You can either (by default) use a Simple Average; which is essentially just a Mean of all the Optimal RSI’s with a length of Machine Learning. Or, you can opt to use a k-Nearest Neighbour (KNN) calculation which takes a Fast and Slow Speed. We essentially turn the Optimal RSI into a MA with different lengths and then compare the distance between the two within our KNN Function.
RSI may very well be one of the most used Indicators for identifying crucial Overbought and Oversold locations. Not only that but when it crosses its Moving Average (MA) line it may also indicate good locations to Buy and Sell. Many traders simply use the RSI with the standard length (14), however, does that mean this is the best length?
By using the length of the top performing RSI and then applying some Machine Learning logic to it, we hope to create what may be a more accurate, smooth, optimal, RSI.
Tutorial:
This is a pretty zoomed out Perspective of what the Indicator looks like with its default settings (except with Bollinger Bands and Signals disabled). If you look at the Tables above, you’ll notice, currently the Top Performing RSI Length is 13 with an Optimal Profit % of: 1.00054973. On its default settings, what it does is Scan X amount of RSI Lengths and checks for when the RSI and RSI MA cross each other. It then records the profitability of each cross to identify which length produced the overall highest crossing profitability. Whichever length produces the highest profit is then the RSI length that is used in the plots, until another length takes its place. This may result in what we deem to be the ‘Optimal RSI’ as it is an adaptive RSI which changes based on performance.
In our next example, we changed the ‘Optimal RSI Type’ from ‘All Crossings’ to ‘Extremity Crossings’. If you compare the last two examples to each other, you’ll notice some similarities, but overall they’re quite different. The reason why is, the Optimal RSI is calculated differently. When using ‘All Crossings’ everytime the RSI and RSI MA cross, we evaluate it for profit (short and long). However, with ‘Extremity Crossings’, we only evaluate it when the RSI crosses over the RSI MA and RSI <= 40 or RSI crosses under the RSI MA and RSI >= 60. We conclude the crossing when it crosses back on its opposite of the extremity, and that is how it finds its Optimal RSI.
The way we determine the Optimal RSI is crucial to calculating which length is currently optimal.
In this next example we have zoomed in a bit, and have the full default settings on. Now we have signals (which you can set alerts for), for when the RSI and RSI MA cross (green is bullish and red is bearish). We also have our Optimal RSI Bollinger Bands enabled here too. These bands allow you to see where there may be Support and Resistance within the RSI at levels that aren’t static; such as 30 and 70. The length the RSI Bollinger Bands use is the Optimal RSI Length, allowing it to likewise change in correlation to the Optimal RSI.
In the example above, we’ve zoomed out as far as the Optimal RSI Bollinger Bands go. You’ll notice, the Bollinger Bands may act as Support and Resistance locations within and outside of the RSI Mid zone (30-70). In the next example we will highlight these areas so they may be easier to see.
Circled above, you may see how many times the Optimal RSI faced Support and Resistance locations on the Bollinger Bands. These Bollinger Bands may give a second location for Support and Resistance. The key Support and Resistance may still be the 30/50/70, however the Bollinger Bands allows us to have a more adaptive, moving form of Support and Resistance. This helps to show where it may ‘bounce’ if it surpasses any of the static levels (30/50/70).
Due to the fact that this Indicator may take a long time to execute and it can throw errors for such, we have added a Setting called: Adjust Optimal RSI Lookback and RSI Count. This settings will automatically modify the Optimal RSI Lookback Length and the RSI Count based on the Time Frame you are on and the Bar Indexes that are within. For instance, if we switch to the 1 Hour Time Frame, it will adjust the length from 200->90 and RSI Count from 30->20. If this wasn’t adjusted, the Indicator would Timeout.
You may however, change the Setting ‘Adjust Optimal RSI Lookback and RSI Count’ to ‘Manual’ from ‘Auto’. This will give you control over the ‘Optimal RSI Lookback Length’ and ‘RSI Count’ within the Settings. Please note, it will likely take some “fine tuning” to find working settings without the Indicator timing out, but there are definitely times you can find better settings than our ‘Auto’ will create; especially on higher Time Frames. The Minimum our ‘Auto’ will create is:
Optimal RSI Lookback Length: 90
RSI Count: 20
The Maximum it will create is:
Optimal RSI Lookback Length: 200
RSI Count: 30
If there isn’t much bar index history, for instance, if you’re on the 1 Day and the pair is BTC/USDT you’ll get < 4000 Bar Indexes worth of data. For this reason it is possible to manually increase the settings to say:
Optimal RSI Lookback Length: 500
RSI Count: 50
But, please note, if you make it too high, it may also lead to inaccuracies.
We will conclude our Tutorial here, hopefully this has given you some insight as to how calculating our Optimal RSI and then using it within Machine Learning may create a more adaptive RSI.
Settings:
Optimal RSI:
Show Crossing Signals: Display signals where the RSI and RSI Cross.
Show Tables: Display Information Tables to show information like, Optimal RSI Length, Best Profit, New Optimal RSI Lookback Length and New RSI Count.
Show Bollinger Bands: Show RSI Bollinger Bands. These bands work like the TDI Indicator, except its length changes as it uses the current RSI Optimal Length.
Optimal RSI Type: This is how we calculate our Optimal RSI. Do we use all RSI and RSI MA Crossings or just when it crosses within the Extremities.
Adjust Optimal RSI Lookback and RSI Count: Auto means the script will automatically adjust the Optimal RSI Lookback Length and RSI Count based on the current Time Frame and Bar Index's on chart. This will attempt to stop the script from 'Taking too long to Execute'. Manual means you have full control of the Optimal RSI Lookback Length and RSI Count.
Optimal RSI Lookback Length: How far back are we looking to see which RSI length is optimal? Please note the more bars the lower this needs to be. For instance with BTC/USDT you can use 500 here on 1D but only 200 for 15 Minutes; otherwise it will timeout.
RSI Count: How many lengths are we checking? For instance, if our 'RSI Minimum Length' is 4 and this is 30, the valid RSI lengths we check is 4-34.
RSI Minimum Length: What is the RSI length we start our scans at? We are capped with RSI Count otherwise it will cause the Indicator to timeout, so we don't want to waste any processing power on irrelevant lengths.
RSI MA Length: What length are we using to calculate the optimal RSI cross' and likewise plot our RSI MA with?
Extremity Crossings RSI Backup Length: When there is no Optimal RSI (if using Extremity Crossings), which RSI should we use instead?
Machine Learning:
Use Rational Quadratics: Rationalizing our Close may be beneficial for usage within ML calculations.
Filter RSI and RSI MA: Should we filter the RSI's before usage in ML calculations? Essentially should we only use RSI data that are of the same type as our Optimal RSI? For instance if our Optimal RSI is Bullish (RSI > RSI MA), should we only use ML RSI's that are likewise bullish?
Machine Learning Type: Are we using a Simple ML Average, KNN Mean Average, KNN Exponential Average or None?
KNN Distance Type: We need to check if distance is within the KNN Min/Max distance, which distance checks are we using.
Machine Learning Length: How far back is our Machine Learning going to keep data for.
k-Nearest Neighbour (KNN) Length: How many k-Nearest Neighbours will we account for?
Fast ML Data Length: What is our Fast ML Length? This is used with our Slow Length to create our KNN Distance.
Slow ML Data Length: What is our Slow ML Length? This is used with our Fast Length to create our KNN Distance.
If you have any questions, comments, ideas or concerns please don't hesitate to contact us.
HAPPY TRADING!

Volume-Weighted RSI with Adaptive SmoothingThis indicator is designed to provide traders with insights into the relative strength of a security by incorporating volume-weighted elements, effectively combining the concepts of Relative Strength Index (RSI) and volume-weighted averages to generate meaningful trading signals.
The indicator calculates the traditional RSI, which measures the speed and change of price movements, as well as the volume-weighted RSI, which considers the influence of trading volume on price action. It then applies adaptive smoothing to the volume-weighted RSI, allowing for customization of the smoothing process. The resulting smoothed volume-weighted RSI is plotted alongside the original RSI, providing traders with a comprehensive view of the price strength dynamics.
The line coloration in this indicator is designed to provide visual cues about the relationship between the RSI and the volume-weighted RSI. When the RSI line is above or equal to the volume-weighted RSI line, it suggests a potentially bullish condition with positive market momentum. In such cases, the line is colored lime. Conversely, when the RSI line (fuchsia) is below the volume-weighted RSI line, it indicates a potentially bearish condition with negative market momentum. The line color is set to fuchsia. By observing the line color, traders can quickly assess the relative strength between the RSI and the volume-weighted RSI, aiding their decision-making process.
The bar color and background color further enhance the visual interpretation of the indicator. The bar color reflects the RSI's relationship with the volume-weighted RSI and the predefined thresholds. If the RSI line is above both the volume-weighted RSI line and the overbought threshold (70), the bar color is set to lime, indicating a potentially overbought condition. Conversely, if the RSI line is below both the volume-weighted RSI line and the oversold threshold (30), the bar color is set to fuchsia, suggesting a potentially oversold condition. When the RSI line is between these two thresholds, the bar color is set to yellow, indicating a neutral or intermediate state. The background color, displayed with a semi-transparent shade, provides additional context by reflecting the prevailing market conditions. It turns lime if the volume-weighted RSI is above the overbought threshold, fuchsia if below the oversold threshold, and yellow if it falls between these two thresholds. This coloration scheme aids traders in quickly assessing market conditions and potential trading opportunities.
Calculations:
-- RSI Calculation : The traditional RSI is calculated based on the price movements of the asset. The up and down movements are determined, and exponential moving averages are used to smooth the values. The RSI value ranges from 0 to 100, with levels above 70 indicating overbought conditions and levels below 30 indicating oversold conditions.
-- Volume-Weighted RSI Calculation : The volume-weighted RSI incorporates the trading volume of the asset into the calculations. The closing price is multiplied by the corresponding volume, and the average is taken over a specific length. The up and down movements are smoothed using exponential moving averages to generate the volume-weighted RSI value.
-- Adaptive Smoothing : The indicator offers an adaptive smoothing option, allowing traders to customize the smoothing process of the volume-weighted RSI. By adjusting the smoothing length, traders can fine-tune the responsiveness of the indicator to changes in market conditions. Smoothing helps reduce noise and enhances the clarity of the signals.
Interpretation:
The indicator provides two main components for interpretation:
-- RSI : The traditional RSI reflects the price momentum and potential overbought or oversold conditions. Traders can look for RSI values above 70 as potential overbought signals, suggesting a possible price reversal or correction. Conversely, RSI values below 30 indicate potential oversold signals, indicating a potential price rebound or rally.
-- Volume-Weighted RSI : The volume-weighted RSI incorporates trading volume, which provides insights into the strength of price movements. When the volume-weighted RSI is above the traditional RSI, it suggests that the buying pressure supported by higher volume is stronger, potentially indicating a more reliable trend. Conversely, when the volume-weighted RSI is below the traditional RSI, it suggests that the selling pressure supported by higher volume is stronger, potentially indicating a more significant price reversal.
Potential Strategies:
-- Overbought and Oversold Signals : Traders can utilize the RSI component of the indicator to identify overbought and oversold conditions. A potential strategy is to consider taking short positions when the RSI is above 70 and long positions when the RSI is below 30. These levels can act as dynamic support and resistance areas, indicating possible price reversals.
-- Confirmation with Volume : Traders can use the volume-weighted RSI as a confirmation tool to validate price movements. When the volume-weighted RSI is above the traditional RSI, it may provide additional confirmation for long positions, suggesting stronger buying pressure. Conversely, when the volume-weighted RSI is below the traditional RSI, it may provide confirmation for short positions, indicating stronger selling pressure.
-- Trend Reversal Strategy : Watch for the volume-weighted RSI to reach extreme levels above 70 (overbought) or below 30 (oversold). Look for a reversal signal where the RSI line (green or fuchsia) crosses below or above the volume-weighted RSI line. Enter a trade when the reversal signal occurs, and the RSI line changes color. Exit the trade when the RSI line crosses back in the opposite direction or reaches the opposite extreme level.
-- Divergence Strategy : Compare the direction of the RSI line (green or fuchsia) with the volume-weighted RSI line. A bullish divergence occurs when the RSI line makes higher lows while the volume-weighted RSI line makes lower lows. A bearish divergence occurs when the RSI line makes lower highs while the volume-weighted RSI line makes higher highs. Once a divergence is identified, wait for the RSI line to cross above or below the volume-weighted RSI line as confirmation of a potential trend reversal. Consider using additional indicators or price action analysis to time the entry more accurately. Use stop-loss orders and profit targets to manage risk and secure profits.
-- Trend Continuation Strategy : Assess the overall trend direction by observing the RSI line's position relative to the volume-weighted RSI line. When the RSI line consistently stays above the volume-weighted RSI line, it indicates a bullish trend, while the opposite suggests a bearish trend. Look for temporary pullbacks within the ongoing trend where the RSI line (green or fuchsia) touches or crosses the volume-weighted RSI line. Enter trades in the direction of the dominant trend when the RSI line crosses back in the trend direction. Exit the trade when the RSI line starts to deviate significantly from the volume-weighted RSI line or when the trend shows signs of weakening through other technical or fundamental factors.
Limitations:
-- False Signals : Like any indicator, the "Volume-Weighted RSI with Adaptive Smoothing" may produce false signals, especially during periods of low liquidity or choppy market conditions. Traders should exercise caution and consider using additional confirmation indicators or tools to validate the signals generated by this indicator.
-- Lagging Nature : The indicator relies on historical price data and volume to calculate the RSI and volume-weighted RSI. As a result, the signals provided may have a certain degree of lag compared to real-time price action. Traders should be aware of this inherent lag and consider combining the indicator with other timely indicators to enhance the accuracy of their trading decisions.
-- Parameter Sensitivity : The indicator's effectiveness can be influenced by the choice of parameters, such as the length of the RSI, smoothing length, and adaptive smoothing option. Different market conditions may require adjustments to these parameters to optimize performance. Traders are encouraged to conduct thorough testing and analysis to determine the most suitable parameter values for their specific trading strategies and preferences.
-- Market Conditions : The indicator's performance may vary depending on the prevailing market conditions. It is essential to understand that no indicator can guarantee accurate predictions or consistently profitable trades. Traders should consider the broader market context, fundamental factors, and other technical indicators to complement the insights provided by the "Volume-Weighted RSI with Adaptive Smoothing" indicator.
-- Subjectivity : Interpretation of the indicator's signals involves subjective judgment. Traders may have varying interpretations of overbought and oversold levels, as well as the significance of the volume-weighted RSI in relation to the traditional RSI. It is crucial to combine the indicator with personal analysis and trading experience to make informed trading decisions.
Remember, no single indicator can provide foolproof trading signals. The "Volume-Weighted RSI with Adaptive Smoothing" indicator serves as a valuable tool for analyzing price strength and volume dynamics. It can assist traders in identifying potential entry and exit points, validating trends, and managing risk. However, it should be used as part of a comprehensive trading strategy that considers multiple factors and indicators to increase the likelihood of successful trades.

Stochastic RSI of Smoothed Price [Loxx]What is Stochastic RSI of Smoothed Price?
This indicator is just as it's title suggests. There are six different signal types, various price smoothing types, and seven types of RSI.
This indicator contains 7 different types of RSI:
RSX
Regular
Slow
Rapid
Harris
Cuttler
Ehlers Smoothed
What is RSI?
RSI stands for Relative Strength Index . It is a technical indicator used to measure the strength or weakness of a financial instrument's price action.
The RSI is calculated based on the price movement of an asset over a specified period of time, typically 14 days, and is expressed on a scale of 0 to 100. The RSI is considered overbought when it is above 70 and oversold when it is below 30.
Traders and investors use the RSI to identify potential buy and sell signals. When the RSI indicates that an asset is oversold, it may be considered a buying opportunity, while an overbought RSI may signal that it is time to sell or take profits.
It's important to note that the RSI should not be used in isolation and should be used in conjunction with other technical and fundamental analysis tools to make informed trading decisions.
What is RSX?
Jurik RSX is a technical analysis indicator that is a variation of the Relative Strength Index Smoothed ( RSX ) indicator. It was developed by Mark Jurik and is designed to help traders identify trends and momentum in the market.
The Jurik RSX uses a combination of the RSX indicator and an adaptive moving average (AMA) to smooth out the price data and reduce the number of false signals. The adaptive moving average is designed to adjust the smoothing period based on the current market conditions, which makes the indicator more responsive to changes in price.
The Jurik RSX can be used to identify potential trend reversals and momentum shifts in the market. It oscillates between 0 and 100, with values above 50 indicating a bullish trend and values below 50 indicating a bearish trend . Traders can use these levels to make trading decisions, such as buying when the indicator crosses above 50 and selling when it crosses below 50.
The Jurik RSX is a more advanced version of the RSX indicator, and while it can be useful in identifying potential trade opportunities, it should not be used in isolation. It is best used in conjunction with other technical and fundamental analysis tools to make informed trading decisions.
What is Slow RSI?
Slow RSI is a variation of the traditional Relative Strength Index ( RSI ) indicator. It is a more smoothed version of the RSI and is designed to filter out some of the noise and short-term price fluctuations that can occur with the standard RSI .
The Slow RSI uses a longer period of time than the traditional RSI , typically 21 periods instead of 14. This longer period helps to smooth out the price data and makes the indicator less reactive to short-term price fluctuations.
Like the traditional RSI , the Slow RSI is used to identify potential overbought and oversold conditions in the market. It oscillates between 0 and 100, with values above 70 indicating overbought conditions and values below 30 indicating oversold conditions. Traders often use these levels as potential buy and sell signals.
The Slow RSI is a more conservative version of the RSI and can be useful in identifying longer-term trends in the market. However, it can also be slower to respond to changes in price, which may result in missed trading opportunities. Traders may choose to use a combination of both the Slow RSI and the traditional RSI to make informed trading decisions.
What is Rapid RSI?
Same as regular RSI but with a faster calculation method
What is Harris RSI?
Harris RSI is a technical analysis indicator that is a variation of the Relative Strength Index ( RSI ). It was developed by Larry Harris and is designed to help traders identify potential trend changes and momentum shifts in the market.
The Harris RSI uses a different calculation formula compared to the traditional RSI . It takes into account both the opening and closing prices of a financial instrument, as well as the high and low prices. The Harris RSI is also normalized to a range of 0 to 100, with values above 50 indicating a bullish trend and values below 50 indicating a bearish trend .
Like the traditional RSI , the Harris RSI is used to identify potential overbought and oversold conditions in the market. It oscillates between 0 and 100, with values above 70 indicating overbought conditions and values below 30 indicating oversold conditions. Traders often use these levels as potential buy and sell signals.
The Harris RSI is a more advanced version of the RSI and can be useful in identifying longer-term trends in the market. However, it can also generate more false signals than the standard RSI . Traders may choose to use a combination of both the Harris RSI and the traditional RSI to make informed trading decisions.
What is Cuttler RSI?
Cuttler RSI is a technical analysis indicator that is a variation of the Relative Strength Index ( RSI ). It was developed by Curt Cuttler and is designed to help traders identify potential trend changes and momentum shifts in the market.
The Cuttler RSI uses a different calculation formula compared to the traditional RSI . It takes into account the difference between the closing price of a financial instrument and the average of the high and low prices over a specified period of time. This difference is then normalized to a range of 0 to 100, with values above 50 indicating a bullish trend and values below 50 indicating a bearish trend .
Like the traditional RSI , the Cuttler RSI is used to identify potential overbought and oversold conditions in the market. It oscillates between 0 and 100, with values above 70 indicating overbought conditions and values below 30 indicating oversold conditions. Traders often use these levels as potential buy and sell signals.
The Cuttler RSI is a more advanced version of the RSI and can be useful in identifying longer-term trends in the market. However, it can also generate more false signals than the standard RSI . Traders may choose to use a combination of both the Cuttler RSI and the traditional RSI to make informed trading decisions.
What is Ehlers Smoothed RSI?
Ehlers smoothed RSI is a technical analysis indicator that is a variation of the Relative Strength Index ( RSI ). It was developed by John Ehlers and is designed to help traders identify potential trend changes and momentum shifts in the market.
The Ehlers smoothed RSI uses a different calculation formula compared to the traditional RSI . It uses a smoothing algorithm that is designed to reduce the noise and random fluctuations that can occur with the standard RSI . The smoothing algorithm is based on a concept called "digital signal processing" and is intended to improve the accuracy of the indicator.
Like the traditional RSI , the Ehlers smoothed RSI is used to identify potential overbought and oversold conditions in the market. It oscillates between 0 and 100, with values above 70 indicating overbought conditions and values below 30 indicating oversold conditions. Traders often use these levels as potential buy and sell signals.
The Ehlers smoothed RSI can be useful in identifying longer-term trends and momentum shifts in the market. However, it can also generate more false signals than the standard RSI . Traders may choose to use a combination of both the Ehlers smoothed RSI and the traditional RSI to make informed trading decisions.
What is Stochastic RSI?
Stochastic RSI (StochRSI) is a technical analysis indicator that combines the concepts of the Stochastic Oscillator and the Relative Strength Index (RSI). It is used to identify potential overbought and oversold conditions in financial markets, as well as to generate buy and sell signals based on the momentum of price movements.
To understand Stochastic RSI, let's first define the two individual indicators it is based on:
Stochastic Oscillator: A momentum indicator that compares a particular closing price of a security to a range of its prices over a certain period. It is used to identify potential trend reversals and generate buy and sell signals.
Relative Strength Index (RSI): A momentum oscillator that measures the speed and change of price movements. It ranges between 0 and 100 and is used to identify overbought or oversold conditions in the market.
Now, let's dive into the Stochastic RSI:
The Stochastic RSI applies the Stochastic Oscillator formula to the RSI values, essentially creating an indicator of an indicator. It helps to identify when the RSI is in overbought or oversold territory with more sensitivity, providing more frequent signals than the standalone RSI.
The formula for StochRSI is as follows:
StochRSI = (RSI - Lowest Low RSI) / (Highest High RSI - Lowest Low RSI)
Where:
RSI is the current RSI value.
Lowest Low RSI is the lowest RSI value over a specified period (e.g., 14 days).
Highest High RSI is the highest RSI value over the same specified period.
StochRSI ranges from 0 to 1, but it is usually multiplied by 100 for easier interpretation, making the range 0 to 100. Like the RSI, values close to 0 indicate oversold conditions, while values close to 100 indicate overbought conditions. However, since the StochRSI is more sensitive, traders typically use 20 as the oversold threshold and 80 as the overbought threshold.
Traders use the StochRSI to generate buy and sell signals by looking for crossovers with a signal line (a moving average of the StochRSI), similar to the way the Stochastic Oscillator is used. When the StochRSI crosses above the signal line, it is considered a bullish signal, and when it crosses below the signal line, it is considered a bearish signal.
It is essential to use the Stochastic RSI in conjunction with other technical analysis tools and indicators, as well as to consider the overall market context, to improve the accuracy and reliability of trading signals.
Signal types included are the following;
Fixed Levels
Floating Levels
Quantile Levels
Fixed Middle
Floating Middle
Quantile Middle
Extras
Alerts
Bar coloring
Loxx's Expanded Source Types

TRAPPER TRENDLINES — RSIBuilds dynamic RSI trendlines by connecting the two most recent confirmed RSI swing points (highs→highs for resistance, lows→lows for support). Includes optional channel shading for the 30–70 zone, an RSI moving average, clean break alerts, and simple bullish/bearish divergence alerts versus price.
How it works
RSI pivots: A point on RSI is a swing high/low only if it is the most extreme value compared with a set number of bars on the left and the right (the Pivot Lookback).
RSI trendlines:
Resistance connects the last two confirmed RSI swing highs.
Support connects the last two confirmed RSI swing lows.
Lines can be Full Extend (update into the future) or Pivot Only.
Channel block: Optional fill of the 30–70 range for fast visual context.
Alerts:
Breaks of RSI support/resistance trendlines.
Basic bullish/bearish RSI divergences versus price pivots.
Inputs
RSI
RSI Length: Default 14 (standard).
Pivot Lookback: Bars to the left/right required to confirm an RSI swing.
Overbought / Oversold: 70 / 30 by default.
Line Extension: Full Extend or Pivot Only.
Visuals
Show RSI Moving Average / Signal Length: Optional smoothing line on RSI.
RSI/Signal colors: Customize plot colors.
Show 30–70 Channel Block: Toggle the middle-zone fill.
Tint pane background when RSI in channel: Optional subtle background when RSI is between OB/OS.
Divergences & Alerts
Enable RSI TL Break Alerts: Alert conditions for RSI line breaks.
Enable Divergence Alerts: Bullish/Bearish divergence alerts versus price.
Pairing with price for confluence/divergence
For accurate confluence and clearer divergences, align this RSI tool with your price trendline tool (for example, TRAPPER TRENDLINES — PRICE):
Set RSI Pivot Lookback equal to the Pivot Left/Right size used on price.
Example: Price uses Pivot Left = 50 and Pivot Right = 50 → set RSI Pivot Lookback = 50.
Keep RSI Length = 14 and OB/OS = 70/30 unless you have a specific edge.
Interpretation:
Confluence: Price reacts at its trendline while RSI reacts at its own line in the same direction.
Divergence: Price makes a higher high while RSI makes a lower high (bearish), or price makes a lower low while RSI makes a higher low (bullish), using matched pivot windows.
Suggested settings
Higher timeframes (4H / 1D / 1W): Pivot Lookback = 50; optional RSI MA length 14; channel block ON.
Intraday (15m / 30m / 1H): Pivot Lookback = 30; optional RSI MA length 14.
Always mirror your price pivot size to this RSI Pivot Lookback for consistent swings.
Reading the signals
RSI trendline touch/hold: Momentum reacting at structure; look for confluence with price levels.
RSI Trendline Break Up / Down: Momentum shift; consider price structure and retests.
Bullish/Bearish Divergence: Confirm only when pivots are matched and the new swing is confirmed.
Notes & limitations
Pivots require future bars to confirm by design; trendlines update as new swings confirm.
Divergence logic compares RSI pivots to price pivots with the same lookback; mismatched windows can produce false positives.
No strategy entries/exits or performance claims are provided. This is an analytical tool.
Alerts (titles/messages)
RSI: Trendline Break Up — “RSI broke falling resistance line.”
RSI: Trendline Break Down — “RSI broke rising support line.”
RSI: Bullish Divergence — “Bullish RSI divergence confirmed.”
RSI: Bearish Divergence — “Bearish RSI divergence confirmed.”
Quick start
Add the indicator to a separate pane.
Set Pivot Lookback to match your price tool’s pivot size (e.g., 50).
Optionally toggle the RSI MA and Channel Block for clarity.
Enable alerts if you want notifications on RSI line breaks and divergences.
Use with TRAPPER TRENDLINES — PRICE or any price-based trendline tool for confluence/divergence analysis.
Compliance
This script is for educational purposes only and does not constitute financial advice. Trading involves risk. Past performance does not guarantee future results. No performance claims are made.

Parameter Free RSI [InvestorUnknown]The Parameter Free RSI (PF-RSI) is an innovative adaptation of the traditional Relative Strength Index (RSI), a widely used momentum oscillator that measures the speed and change of price movements. Unlike the standard RSI, which relies on a fixed lookback period (typically 14), the PF-RSI dynamically adjusts its calculation length based on real-time market conditions. By incorporating volatility and the RSI's deviation from its midpoint (50), this indicator aims to provide a more responsive and adaptable tool for identifying overbought/oversold conditions, trend shifts, and momentum changes. This adaptability makes it particularly valuable for traders navigating diverse market environments, from trending to ranging conditions.
PF-RSI offers a suite of customizable features, including dynamic length variants, smoothing options, visualization tools, and alert conditions.
Key Features
1. Dynamic RSI Length Calculation
The cornerstone of the PF-RSI is its ability to adjust the RSI calculation period dynamically, eliminating the need for a static parameter. The length is computed using two primary factors:
Volatility: Measured via the standard deviation of past RSI values.
Distance from Midpoint: The absolute deviation of the RSI from 50, reflecting the strength of bullish or bearish momentum.
The indicator offers three variants for calculating this dynamic length, allowing users to tailor its responsiveness:
Variant I (Aggressive): Increases the length dramatically based on volatility and a nonlinear scaling of the distance from 50. Ideal for traders seeking highly sensitive signals in fast-moving markets.
Variant II (Moderate): Combines volatility with a scaled distance from 50, using a less aggressive adjustment. Strikes a balance between responsiveness and stability, suitable for most trading scenarios.
Variant III (Conservative): Applies a linear combination of volatility and raw distance from 50. Offers a stable, less reactive length adjustment for traders prioritizing consistency.
// Function that returns a dynamic RSI length based on past RSI values
// The idea is to make the RSI length adaptive using volatility (stdev) and distance from the RSI midpoint (50)
// Different "variant" options control how aggressively the length changes
parameter_free_length(free_rsi, variant) =>
len = switch variant
// Variant I: Most aggressive adaptation
// Uses standard deviation scaled by a nonlinear factor of distance from 50
// Also adds another distance-based term to increase length more dramatically
"I" => math.ceil(
ta.stdev(free_rsi, math.ceil(free_rsi)) *
math.pow(1 + (math.ceil(math.abs(50 - (free_rsi - 50))) / 100), 2)
) +
(
math.ceil(math.abs(free_rsi - 50)) *
(1 + (math.ceil(math.abs(50 - (free_rsi - 50))) / 100))
)
// Variant II: Moderate adaptation
// Adds the standard deviation and a distance-based scaling term (less nonlinear)
"II" => math.ceil(
ta.stdev(free_rsi, math.ceil(free_rsi)) +
(
math.ceil(math.abs(free_rsi - 50)) *
(1 + (math.ceil(math.abs(50 - (free_rsi - 50))) / 100))
)
)
// Variant III: Least aggressive adaptation
// Simply adds standard deviation and raw distance from 50 (linear scaling)
"III" => math.ceil(
ta.stdev(free_rsi, math.ceil(free_rsi)) +
math.ceil(math.abs(free_rsi - 50))
)
2. Smoothing Options
To refine the dynamic RSI and reduce noise, the PF-RSI provides smoothing capabilities:
Smoothing Toggle: Enable or disable smoothing of the dynamic length used for RSI.
Smoothing MA Type for RSI MA: Choose between SMA and EMA
Smoothing Length Options for RSI MA:
Full: Uses the entire calculated dynamic length.
Half: Applies half of the dynamic length for smoother output.
SQRT: Uses the square root of the dynamic length, offering a compromise between responsiveness and smoothness.
The smoothed RSI is complemented by a separate moving average (MA) of the RSI itself, further enhancing signal clarity.
3. Visualization Tools
The PF-RSI includes visualization options to help traders interpret market conditions at a glance.
Plots:
Dynamic RSI: Displayed as a white line, showing the adaptive RSI value.
RSI Moving Average: Plotted in yellow, providing a smoothed reference for trend and momentum analysis.
Dynamic Length: A secondary plot (in faint white) showing how the calculation period evolves over time.
Histogram: Represents the RSI’s position relative to 50, with color gradients.
Fill Area: The space between the RSI and its MA is filled with a gradient (green for RSI > MA, red for RSI < MA), highlighting momentum shifts.
Customizable bar colors on the price chart reflect trend and momentum:
Trend (Raw RSI): Green (RSI > 50), Red (RSI < 50).
Trend (RSI MA): Green (MA > 50), Red (MA < 50).
Trend (Raw RSI) + Momentum: Adds momentum shading (lighter green/red when RSI and MA diverge).
Trend (RSI MA) + Momentum: Similar, but based on the MA’s trend.
Momentum: Green (RSI > MA), Red (RSI < MA).
Off: Disables bar coloring.
Intrabar Updating: Optional real-time updates within each bar for enhanced responsiveness.
4. Alerts
The PF-RSI supports customizable alerts to keep traders informed of key events.
Trend Alerts:
Raw RSI: Triggers when the RSI crosses above (uptrend) or below (downtrend) 50.
RSI MA: Triggers when the moving average crosses 50.
Off: Disables trend alerts.
Momentum Alerts:
Triggers when the RSI crosses its moving average, indicating rising (RSI > MA) or declining (RSI < MA) momentum.
Alerts are fired once per bar close, with descriptive messages including the ticker symbol (e.g., " Uptrend on: AAPL").
How It Works
The PF-RSI operates in a multi-step process:
Initialization
On the first run, it calculates a standard RSI with a 14-period length to seed the dynamic calculation.
Dynamic Length Computation
Once seeded, the indicator switches to a dynamic length based on the selected variant, factoring in volatility and distance from 50.
If smoothing is enabled, the length is further refined using an SMA.
RSI Calculation
The adaptive RSI is computed using the dynamic length, ensuring it reflects current market conditions.
Moving Average
A separate MA (SMA or EMA) is applied to the RSI, with a length derived from the dynamic length (Full, Half, or SQRT).
Visualization and Alerts
The results are plotted, and alerts are triggered based on user settings.
This adaptive approach minimizes lag in fast markets and reduces false signals in choppy conditions, offering a significant edge over fixed-period RSI implementations.
Why Use PF-RSI?
The Parameter Free RSI stands out by eliminating the guesswork of selecting an RSI period. Its dynamic length adjusts to market volatility and momentum, providing timely signals without manual tweaking.

Volume Weighted RSI (VW RSI)The Volume Weighted RSI (VW RSI) is a momentum oscillator designed for TradingView, implemented in Pine Script v6, that enhances the traditional Relative Strength Index (RSI) by incorporating trading volume into its calculation. Unlike the standard RSI, which measures the speed and change of price movements based solely on price data, the VW RSI weights its analysis by volume, emphasizing price movements backed by significant trading activity. This makes the VW RSI particularly effective for identifying bullish or bearish momentum, overbought/oversold conditions, and potential trend reversals in markets where volume plays a critical role, such as stocks, forex, and cryptocurrencies.
Key Features
Volume-Weighted Momentum Calculation:
The VW RSI calculates momentum by comparing the volume associated with upward price movements (up-volume) to the volume associated with downward price movements (down-volume).
Up-volume is the volume on bars where the closing price is higher than the previous close, while down-volume is the volume on bars where the closing price is lower than the previous close.
These volumes are smoothed over a user-defined period (default: 14 bars) using a Running Moving Average (RMA), and the VW RSI is computed using the formula:
\text{VW RSI} = 100 - \frac{100}{1 + \text{VoRS}}
where
\text{VoRS} = \frac{\text{Average Up-Volume}}{\text{Average Down-Volume}}
.
Oscillator Range and Interpretation:
The VW RSI oscillates between 0 and 100, with a centerline at 50.
Above 50: Indicates bullish volume momentum, suggesting that volume on up bars dominates, which may signal buying pressure and a potential uptrend.
Below 50: Indicates bearish volume momentum, suggesting that volume on down bars dominates, which may signal selling pressure and a potential downtrend.
Overbought/Oversold Levels: User-defined thresholds (default: 70 for overbought, 30 for oversold) help identify potential reversal points:
VW RSI > 70: Overbought, indicating a possible pullback or reversal.
VW RSI < 30: Oversold, indicating a possible bounce or reversal.
Visual Elements:
VW RSI Line: Plotted in a separate pane below the price chart, colored dynamically based on its value:
Green when above 50 (bullish momentum).
Red when below 50 (bearish momentum).
Gray when at 50 (neutral).
Centerline: A dashed line at 50, optionally displayed, serving as the neutral threshold between bullish and bearish momentum.
Overbought/Oversold Lines: Dashed lines at the user-defined overbought (default: 70) and oversold (default: 30) levels, optionally displayed, to highlight extreme conditions.
Background Coloring: The background of the VW RSI pane is shaded red when the indicator is in overbought territory and green when in oversold territory, providing a quick visual cue of potential reversal zones.
Alerts:
Built-in alerts for key events:
Bullish Momentum: Triggered when the VW RSI crosses above 50, indicating a shift to bullish volume momentum.
Bearish Momentum: Triggered when the VW RSI crosses below 50, indicating a shift to bearish volume momentum.
Overbought Condition: Triggered when the VW RSI crosses above the overbought threshold (default: 70), signaling a potential pullback.
Oversold Condition: Triggered when the VW RSI crosses below the oversold threshold (default: 30), signaling a potential bounce.
Input Parameters
VW RSI Length (default: 14): The period over which the up-volume and down-volume are smoothed to calculate the VW RSI. A longer period results in smoother signals, while a shorter period increases sensitivity.
Overbought Level (default: 70): The threshold above which the VW RSI is considered overbought, indicating a potential reversal or pullback.
Oversold Level (default: 30): The threshold below which the VW RSI is considered oversold, indicating a potential reversal or bounce.
Show Centerline (default: true): Toggles the display of the 50 centerline, which separates bullish and bearish momentum zones.
Show Overbought/Oversold Lines (default: true): Toggles the display of the overbought and oversold threshold lines.
How It Works
Volume Classification:
For each bar, the indicator determines whether the price movement is upward or downward:
If the current close is higher than the previous close, the bar’s volume is classified as up-volume.
If the current close is lower than the previous close, the bar’s volume is classified as down-volume.
If the close is unchanged, both up-volume and down-volume are set to 0 for that bar.
Smoothing:
The up-volume and down-volume are smoothed using a Running Moving Average (RMA) over the specified period (default: 14 bars) to reduce noise and provide a more stable measure of volume momentum.
VW RSI Calculation:
The Volume Relative Strength (VoRS) is calculated as the ratio of smoothed up-volume to smoothed down-volume.
The VW RSI is then computed using the standard RSI formula, but with volume data instead of price changes, resulting in a value between 0 and 100.
Visualization and Alerts:
The VW RSI is plotted with dynamic coloring to reflect its momentum direction, and optional lines are drawn for the centerline and overbought/oversold levels.
Background coloring highlights overbought and oversold conditions, and alerts notify the trader of significant crossings.
Usage
Timeframe: The VW RSI can be used on any timeframe, but it is particularly effective on intraday charts (e.g., 1-hour, 4-hour) or daily charts where volume data is reliable. Shorter timeframes may require a shorter length for increased sensitivity, while longer timeframes may benefit from a longer length for smoother signals.
Markets: Best suited for markets with significant and reliable volume data, such as stocks, forex, and cryptocurrencies. It may be less effective in markets with low or inconsistent volume, such as certain futures contracts.
Trading Strategies:
Trend Confirmation:
Use the VW RSI to confirm the direction of a trend. For example, in an uptrend, look for the VW RSI to remain above 50, indicating sustained bullish volume momentum, and consider buying on pullbacks when the VW RSI dips but stays above 50.
In a downtrend, look for the VW RSI to remain below 50, indicating sustained bearish volume momentum, and consider selling on rallies when the VW RSI rises but stays below 50.
Overbought/Oversold Conditions:
When the VW RSI crosses above 70, the market may be overbought, suggesting a potential pullback or reversal. Consider taking profits on long positions or preparing for a short entry, but confirm with price action or other indicators.
When the VW RSI crosses below 30, the market may be oversold, suggesting a potential bounce or reversal. Consider entering long positions or covering shorts, but confirm with additional signals.
Divergences:
Look for divergences between the VW RSI and price to spot potential reversals. For example, if the price makes a higher high but the VW RSI makes a lower high, this bearish divergence may signal an impending downtrend.
Conversely, if the price makes a lower low but the VW RSI makes a higher low, this bullish divergence may signal an impending uptrend.
Momentum Shifts:
A crossover above 50 can signal the start of bullish momentum, making it a potential entry point for long trades.
A crossunder below 50 can signal the start of bearish momentum, making it a potential entry point for short trades or an exit for long positions.
Example
On a 4-hour SOLUSDT chart:
During an uptrend, the VW RSI might rise above 50 and stay there, confirming bullish volume momentum. If it approaches 70, it may indicate overbought conditions, as seen near a price peak of 145.08, suggesting a potential pullback.
During a downtrend, the VW RSI might fall below 50, confirming bearish volume momentum. If it drops below 30 near a price low of 141.82, it may indicate oversold conditions, suggesting a potential bounce, as seen in a slight recovery afterward.
A bullish divergence might occur if the price makes a lower low during the downtrend, but the VW RSI makes a higher low, signaling a potential reversal.
Limitations
Lagging Nature: Like the traditional RSI, the VW RSI is a lagging indicator because it relies on smoothed data (RMA). It may not react quickly to sudden price reversals, potentially missing the start of new trends.
False Signals in Ranging Markets: In choppy or ranging markets, the VW RSI may oscillate around 50, generating frequent crossovers that lead to false signals. Combining it with a trend filter (e.g., ADX) can help mitigate this.
Volume Data Dependency: The VW RSI relies on accurate volume data, which may be inconsistent or unavailable in some markets (e.g., certain forex pairs or futures contracts). In such cases, the indicator’s effectiveness may be reduced.
Overbought/Oversold in Strong Trends: During strong trends, the VW RSI can remain in overbought or oversold territory for extended periods, leading to premature exit signals. Use additional confirmation to avoid exiting too early.
Potential Improvements
Smoothing Options: Add options to use different smoothing methods (e.g., EMA, SMA) instead of RMA for the up/down volume calculations, allowing users to adjust the indicator’s responsiveness.
Divergence Detection: Include logic to detect and plot bullish/bearish divergences between the VW RSI and price, providing visual cues for potential reversals.
Customizable Colors: Allow users to customize the colors of the VW RSI line, centerline, overbought/oversold lines, and background shading.
Trend Filter: Integrate a trend strength filter (e.g., ADX > 25) to ensure signals are generated only during strong trends, reducing false signals in ranging markets.
The Volume Weighted RSI (VW RSI) is a powerful tool for traders seeking to incorporate volume into their momentum analysis, offering a unique perspective on market dynamics by emphasizing price movements backed by significant trading activity. It is best used in conjunction with other indicators and price action analysis to confirm signals and improve trading decisions.
