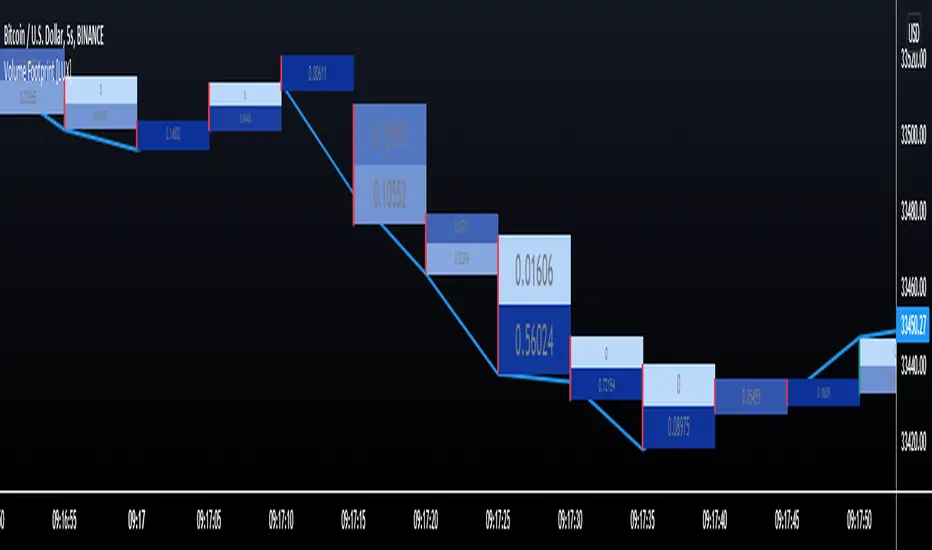
Volume Footprint [LuxAlgo]This indicator estimates a volume footprint using tick data. The script automatically separates a candle into equidistant intervals with a width obtained from the average true range or a user-given width.
Settings
Method: Interval width calculation method. This ultimately determines the number of intervals separating one candle.
Width (At the right of Method): Atr period or user given width depending on the selected method. A lower user-given width would divide a candle into a higher number of intervals.
As Percent: Returns the accumulated volume within each interval as a percentage of the total candle volume.
Style
Display Type: Determines the appearance of the returned volume footprint.
Trend Color: Color to use based on whether a candle is bullish or bearish.
Usage
When applied to a chart, the user will be asked to select the settings to use for the volume footprint. Note that changing the settings afterward will reset the volume footprint, removing previously generated footprints.
A new footprint will appear on the confirmation of a new bar, as such this version might only be useful in lower timeframes.
A volume footprint allows users to see the number of contracts exchanged within a candle interval. It can as such be seen as some kind of intrabar volume profile.
This can be useful to see areas of interest within a candle.
Different Appearance
By default, the volume footprint makes use of colored boxes with a color based on whether the candle was bullish or bearish.
Another appearance that gives additional information is the gradient type, which uses intervals color based on the number of contracts exchanged within an interval relative to the total volume of the candle. A higher number of contracts within an interval would return a darker color by default.
The regular display type makes use of boxes with a single color, with lines on the side indicating whether the candle was bullish or bearish.
在腳本中搜尋"volume"
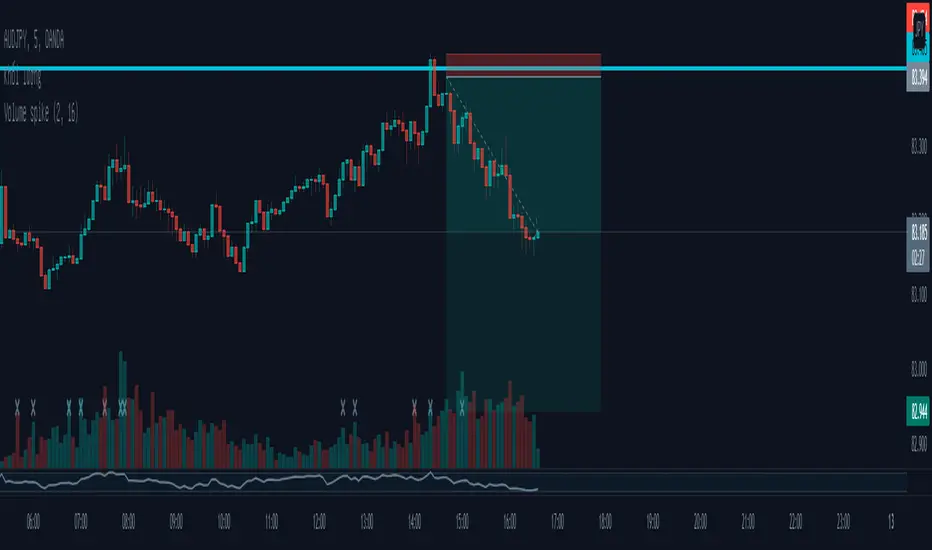
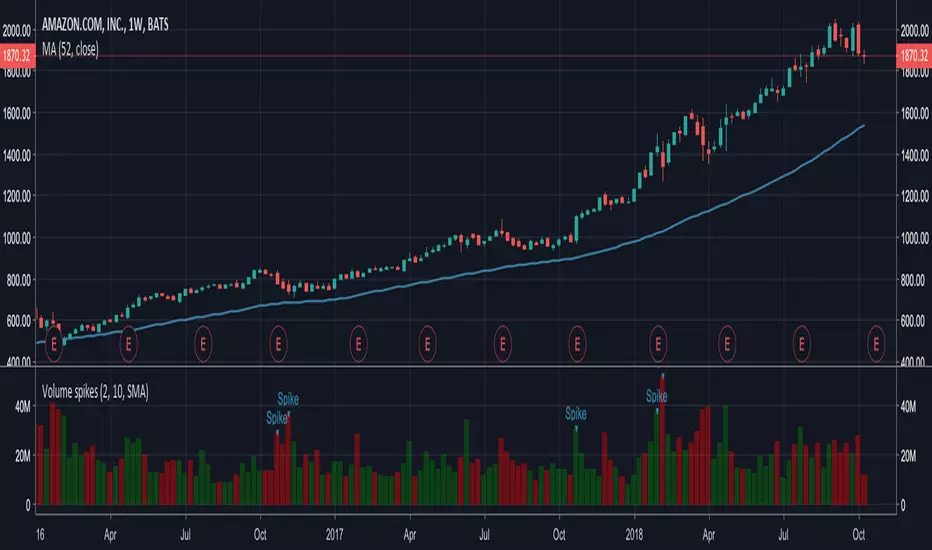
Volume spikeTo locate volume spikes, you compare a single day's volume to average volume. If one day's volume is two to three times the average volume, it will appear as a spike. Unusually large volume often foreshadows a major change in price trend.
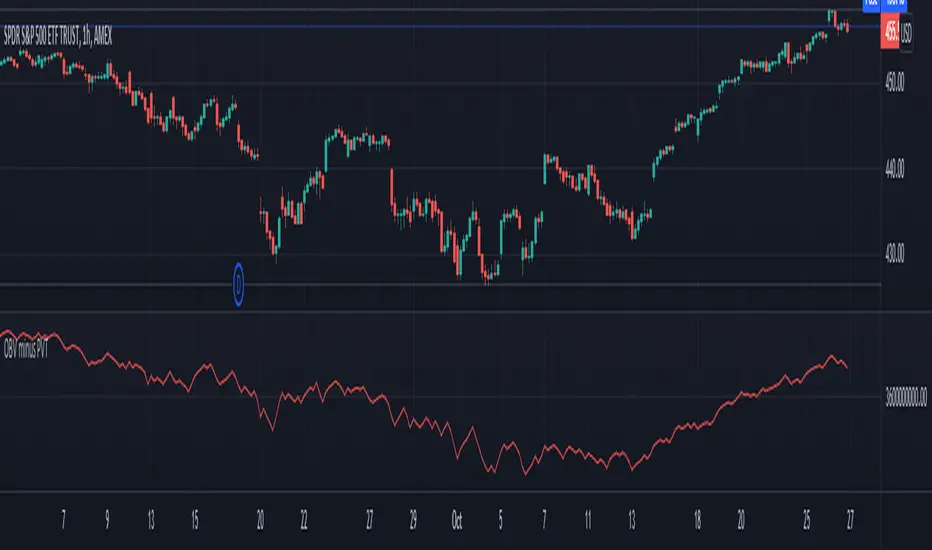
Volume Difference IndicatorThis indicator is a simple volume difference indicator.
How it works:
First we calculate the on balance volume, and then we calculate the price volume trend.
For those unaware, the OBV subtracts all volumes when price records a lower close and adds them in the case of a higher price close. In contrast, PVT subtracts or adds only a proportion of the volume from its cumulative total in relation to a percentage change in price.
Using this knowledge, we are using the difference of OBV (the indicator with the entire amount added or subtracted), minus PVT (which subtracts a percent based on the percentage in price), this gives us a unique indicator which out puts a more whole picture of the two indicators. It shows us the difference of absolute volume minus relative volume based on the percent of close price. It allows us to see large shifts in volume BEFORE it happens.
How to use this indicator:
When there is a sharp increase of Volume Difference Indicator, but close has NOT risen, price tends to rise immediately following this. When the Volume Difference Indicator drops, but price has NOT changed, price tends to fall immediately following this.
Volume In USDDisplay volume in fiat base currency so that we can compare symbols in a list to find healthy one to trade.
Add a label so that we can see the latest volume number easier on mobile phone.

Volume Pressure AnalysisVolume Pressure Analysis is a new concept I have been working on designed to show the effort required to move price. An ideal tool for confirming trends or locating reversals early. This indicator can highlight whale action and market manipulation. It calculates volume vs volatility and displays the results as a meter:
Above 0 shows how easy price action is traveling, the bigger these bars the less volume and effort is required to push price. These are indicated with a teal or red arrows and can confirm the beginning or continuation of a trend. This is the natural direction the chart wants to travel at that time.
Below 0 shows how hard price is to move. The bigger these bars the more volume and effort is required to push price. When whales and market makers push price against its will these bars will get bigger.
Yellow arrows signal pressure in that direction and excessive amounts of volume is required to move price. These signals can lead to reversal/ pivot points as price action struggles to continue its trend. These signals can be turned on in settings or use the overlay version of this script to display signals on chart. This is a very powerful tool when used with relative volume.

Volume fightThe Volume fight indicator looks for the predominance of bullish or bearish trading volume on the chart by dividing the trading volume in the bar into 2 parts - "bullish volume" and "bearish volume", and comparing the weighted average values by volume with each other at a given distance.
This indicator is suitable for any instrument (cryptocurrency, Forex, stocks) and is able to work on any TF.
The Volume fight indicator should be used as an auxiliary indicator that tells you who is currently prevailing in the market - " bulls "or"bears".
To configure the indicator, it is necessary to set the range of evaluation of the predominance of bullish or bearish volume (the number of bars, by default-24 bars for TF=1H). The smaller the TF, the higher the range value should be used to filter out false signals.
When there is a predominance of "bulls" on the chart, a green triangle appears (relevant at the close of the bar) and the histogram is highlighted in green, when "bears" appear on the chart, a red triangle appears (relevant at the close of the bar) and the histogram is highlighted in red.
In the indicator settings, there is smoothing to reduce false signals and highlight the flat zone by specifying a percentage, at least which should be the difference between the forces of the "bullish" and "bearish" volume. If the difference between the volume forces is less than the specified one (by default-15%), the zone is considered flat and is displayed in gray on the histogram.
If you set the percentage to zero, the flat zones will not be highlighted, but there will be much more false signals, since the indicator becomes very sensitive when the smoothing percentage decreases.
There is a function-to show the color background of the current trading zone. For" bullish "- green, for" bearish " - red.
In the settings, you can enable the display and use of each signal in the trading zone, not only the initial one, but also each after the flat zone. By default, only the signal of the beginning of the ascending/descending zone is used.
The indicator has alerts for "bullish" and "bearish" movements. Use alerts - "Once per bar close".
If you have any questions, you can write to me in private messages or by using the contacts in my signature.
----------------------------------------------------
Индикатор Volume fight ищет на графике преобладание бычьего или медвежьего объёма торгов путём разделения торгового объёма в баре на 2 части - "бычий объём" и "медвежий объём", и сравнения средне-взвешенных значений по объёму между собой на заданной дистанции.
Данный индикатор подходит для любого инструмента (криптовалюта, Forex, акции) и способен работать на любом ТФ.
Индикатор Volume fight следует использовать как вспомогательный индикатор, который подсказывает Вам кто сейчас преобладает на рынке - "быки" или "медведи".
Для настройки индикатора необходимо выставить диапазон оценки преобладания бычьего или медвежьего объема (количество баров, по умолчанию - 24 бара для ТФ=1Ч). Чем меньше ТФ, тем выше следует использовать значение диапазона, чтобы отфильтровать ложные сигналы.
При возникновении преобладания на графике "быков" появляется зелёный треугольник (актуален по закрытию бара) и гистограмма подсвечивается зелёным цветом, при возникновении на графике "медведей" появляется красный треугольник (актуален по закрытию бара) и гистограмма подсвечивается красным цветом.
В настройках индикатора есть сглаживание для уменьшения ложных сигналов и выделения зоны флета с помощью указания процента, не менее которого, должна быть разница между силами "бычьего" и "медвежьего" объёма. Если разница между силами объёмов меньше заданного (по умолчанию - 15%), то зона считается флетовой и отображается на гистограмме серым цветом.
Если выставить процент равным нулю, то зоны флета выделяться не будут, но будет гораздо больше ложных сигналов, так как индикатор становится очень чувствительным при снижении процента сглаживания.
Есть функция - показывать цветовой фон текущей торговой зоны. Для "бычьего" - зелёный, для "медвежьего" - красный.
В настройках можно включить отображение и использование каждого сигнал в торговой зоне, не только начального, но и каждого после зоны флета. По умолчанию - только сигнал начала восходящей/нисходящей зоны.
Индикатор имеет оповещения для "бычьего" и "медвежьего" движения. Используйте оповещения - "на закрытии бара".
По любым вопросам Вы можете написать мне в личные сообщения или по контактам в моей подписи.

Volume BricksVolume Bricks - As if a Renko made new bricks on volume.
Set a percentage of the previous day's volume and this will post new levels when accumulated volume meets that percentage.
It will also plot shapes (and labels for recent bars) when price movement is accompanied by more than one times the volume level specified.

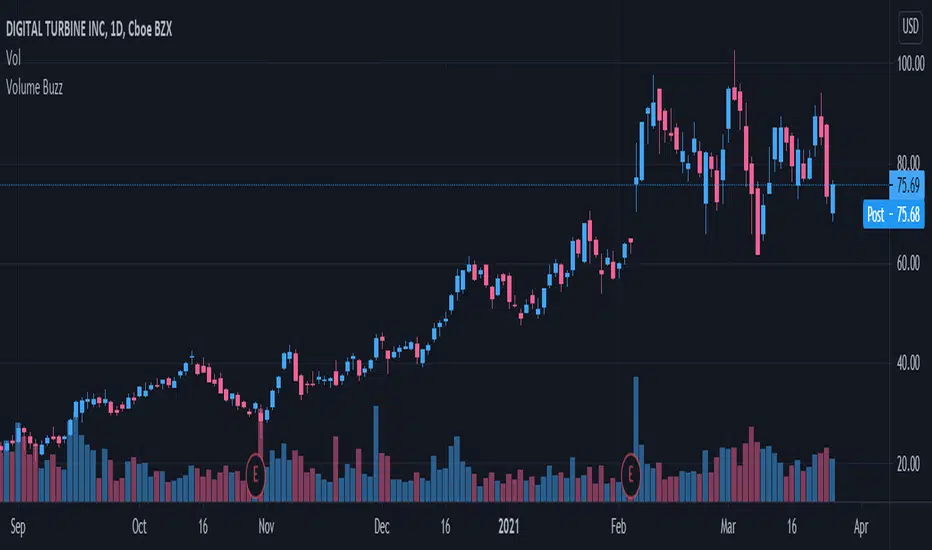
Volume Buzz 2.0Volume Buzz/Volume Run Rate as seen on TC2000 and MarketSmith respectively.
Basically, the volume buzz tells you what percentage over average(100 time period moving average) the volume traded was. You can use this indicator to more readily identify above-average trading volume and accumulation days on charts. The percentage will show up in the top left corner, make sure to click the settings button and uncheck the second box(left of plot) in order to get rid of the chart line.
Pictured above, a chart with the volume on the bottom along with the 50-day moving average applied to volume. As you can see in the top left it will tell you the "volume buzz" of that day, telling you what days were on above-average volume and how above-average those days were.
Volume Divergence by MMIt's a simply volume indicator. You should watch for breaks on both volume uptrend and volume downtrend. It uses fibonacci numbers to build smoothed moving average of volume.
Also you can check divergences for trend reversal and momentum loss.

Volume Cloud [LucF]A strictly volume-based cloud. It plots current volume (green line) over its 20-period linear regression (red line) on the chart. Unlike Ichimoku's cloud, it is not offset. While probably not something that you would have on your charts all the time, it can provide a useful way to study the interaction between price and volume.
Because the green line is the current volume, you can forego volume columns when using the indicator.
Volume Cloud does have practical uses. I will show here how I use volume to help me in selecting better probability entries, with only Volume Cloud and my TLD indicator on the chart (the Volume Columns are there to provide context for first-time users of the Volume Cloud).
When looking for entries, I’m trying to find spots where a reversal from a bottom or a continuation after a pause is confirmed by increasing volume (preferably above average) candles with proper wick/body structure. The candle structure of increasing volume candles is important because for me, it provides granularity on the volume action during the candle. I view wicks as failed tests and body height as reinforcement of the price movement. As for candles where volume is not increasing, I mostly ignore them. This is a simplified account of my mindset; just the stories I trade with and that I believe provide an edge—and profits. I certainly don’t pretend having found an infallible way to trade, and there is much more to it that I can explain here, but let’s look at a chart.
Point 1: Solid increasing volume and above average down candle, but I don’t enter on big candles. The volume on that candle has reached a new high though, so I’m thinking bearish sentiment for the next bars.
Point 2: Nicely formed above average increasing volume candle, but I’m looking to short. A similar’ish candle 4 bars back was followed by non-descript action. After 2, a test of past resistance fails before reaching it and a lower low and then a lower high bring us to point 3.
Point 3: Exactly what I’m looking for. No upper wick, solid body that’s not too big, and the highest volume reached on chart yet as a bonus. I enter on the following candle and because of the solid context, I can use a tight stop at the previous candle’s high. Going down, I will move my stop to the high of any increasing volume candle going in my direction, starting when that point is at least as far from my entry as my stop (RR=1).
Point 4: This is the last point where I move my stop at the candle’s high and get stopped out at the following candle for a RR=3.75 trade. Notice how the very high volume at point 4 generates a relatively small body. This is often a sign of stopping volume that portends a reversal or a pause.
Point 5: A first above average increasing volume candle, but with longish wicks that don’t fit my idea of a solid candle. Definitely not a strong enough sign to bet on a reversal from the recent strong descent.
Point 6: This candle is a different story altogether. No lower wick, reasonably sized body, double the volume of previous candle and a close way above the previous 20 candles. Long entry with stop at candle 6’s low. I don’t move my stop on the candle following my entry because it wouldn’t put me at RR=1, so the first time I move my stop up is at candle just before point 7.
Point 7: I get stopped out for RR=3 after that candle because I will have moved my stop a second time, at candle’s 7 low.
I didn’t make these trades (can’t even short on Binance yet), and while this is a typical a posteriori story, it does reflect what I do in reality.

Volume Value per UnitThis script will plot the result of Volume / Close.
This is meant to normalize the volume of tickers with exponential growth, for example a ticker like $BTC that went from $1 to $50k. Having the volume divided by the close will normalize the volume for when the price was $1 and $50k.
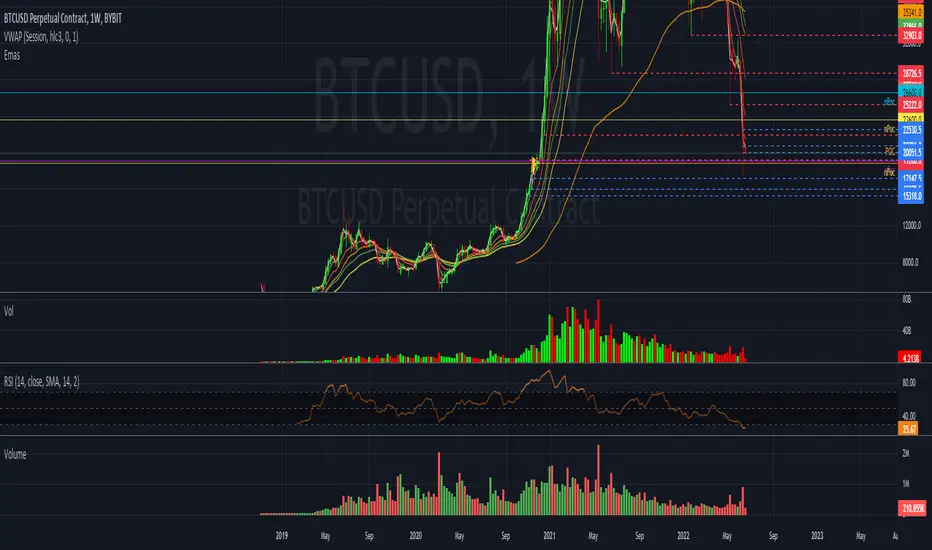
Volume MA * Fibo levelsIn the scrypt above, the SMA of Volume is taken as a basis and the Fibonacci levels are calculated.
This can be useful for analyzing the trend in accordance with changes in volume.
Any feedback is appreciated!
Good luck with your trading!

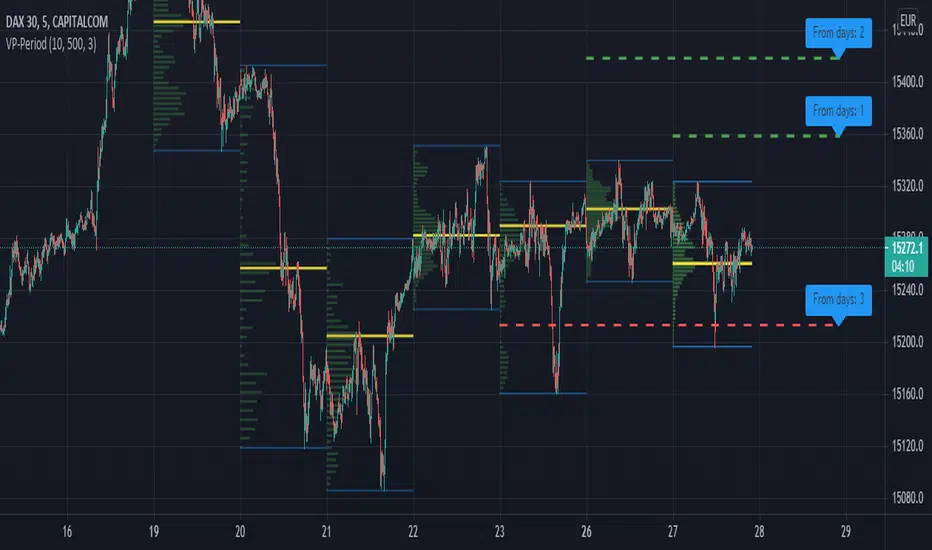
Volume Profile per day with support/resistance linesThis indicator shows the volume profile by daily blocks and draws on the chart the support or resistance lines produced by the previous volume profile block. A support line will be created if in the previous block, the VPOC line was closer to the lowest price line of that block. This support line will be placed below the VPOC line, at a distance equal to the difference between the highest price of that block and the VPOC price. For the case of the resistance line, the logic applied is analogous.
These support and resistance lines are introduced because, according to the Gaussian bell, the VPOC is likely to be located in the middle, and these deviations can be used to trace support and resistance.
In addition, the indicator includes the following features:
- Change the colors of all plotted lines.
- Define the number of daily blocks to be displayed.
- Define the resolution when calculating the volume of each candle.
- Define the number of support/resistance lines to be displayed.
- Highest and lowest price lines, as well as vpoc line, volume histogram and support and resistance lines.
- Display or not, the vpoc line and the volume histogram.
The calculations performed by the script improve if the candles used are of a lower timeframe. This indicator has been tested in several markets, including cryptos, CFDs, Forex and Indices.
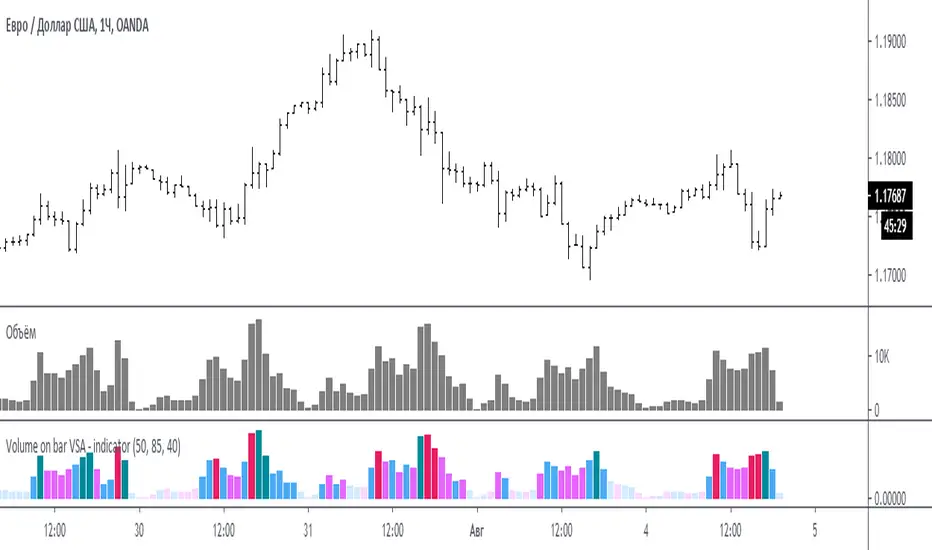
Volume on bar VSA - indicator V2Google translate.
This indicator compares the volume with its average value and tints it depending on whether the tail on the bar is bullish or bearish.
In the settings you can set (sensitivity) for tinting volumes of high and medium
Этот индикатор сравнивает объем со средним его значением и подкрашивает его в зависимости от того какой хвост на баре, бычий или медвежий.
В настройках можно задать (чувствительность) для подкрашивания объемов повышенных и средних
Volume spikesSimple indicator which shows volume spikes.
By default spike is defined as such when volume is 2 times higher than average volume for last 10 volume bars (this can be changed in settings)
Also instead of using average volume (SMA is used in this case) you can use WMA or EMA by changing settings
Volume Price Spread Analysis 2With the same idea of the VPSA i make the VPSA2 to make Heiken Ashi style synthetic graph of the price and the volume effect, its easy to see the volume trends. Each instrument have a more clear time frame to see the volume patterns.
I see very useful like a secondary analysis layer. in the graph show the same RSI with price and VPSA2 like source.
Can use others indicators over the VPSA, only write in CAPITAL letters open, high, low, close or hl2 at inputs section.
Ideas, corrections & comments.
They are always welcome.

Volume Price Spread AnalysisWith the same idea of the VSA i make the VPSA to make synthetic graph of the price and the volume effect, its easy to see the volume trends. Each instrument have a more clear time frame to see the volume patterns.
Can use others indicators over the VPSA, only write in CAPITAL letters open, high, low, close or hl2 at inputs section.

VolumeS as stochv1just to show a concept . I use volume S to make it as stoch and add to it MTF function
B=buy
S=sell
D=down
if you do not like the MTF fuction just remove it from code or put the time frame of graph to be exact as MTF one
I did not add alert as it just a concept idea , to make it more complex it easy if you add more indicators to it and then compare the signals
have fun

Volume (D)EMAA simple yet configurable indicator that shows recent traffic volumes.
The time period is specified as weeks/days/hours/minutes, not as bars.
Set the volume period to non-zero if you want to use a generalized double EMA instead of plain.
The ratio option will show the size of the current volume compared to the volume in the specified time period (expect to see something very non-Gaussian, say goodby to trusting your ATR and stddev, and say hello to fat tails.) With the "together" option, it compares the current volume to the both sides together (buy+sell), otherwise it compares it to just its own.

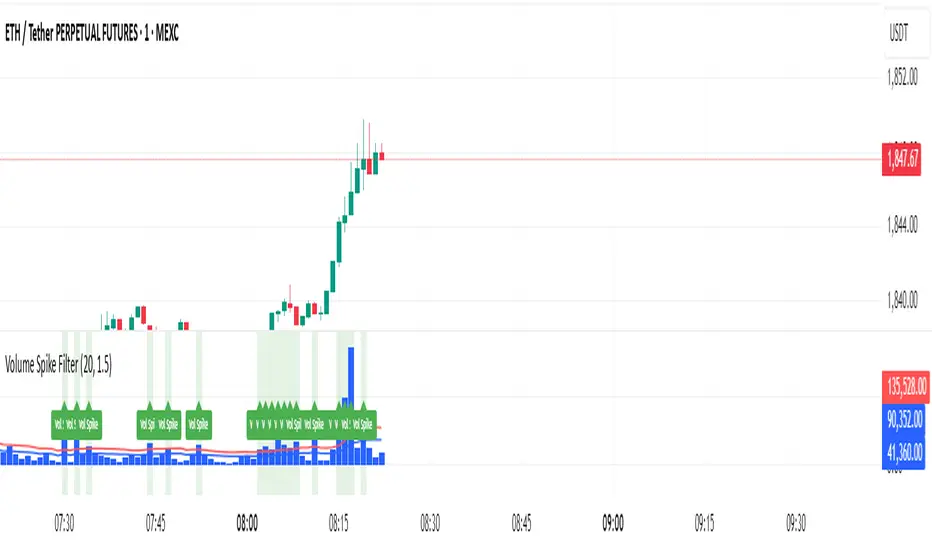
Volume Spike Filter### Volume Spike Detector with Alerts
**Overview:**
This indicator helps traders quickly identify unusual spikes in trading volume by comparing the current volume against a simple moving average (SMA) threshold. It's particularly useful for beginners seeking clear signals of increased market activity.
**Settings:**
* **SMA Length:** Defines the period for calculating the average volume (default = 20).
* **Multiplier:** Determines how much the volume must exceed the SMA to be considered a spike (default = 1.5).
* **Highlight Spikes:** Toggle to visually highlight spikes on the chart (default = enabled).
**Signals:**
* 🟩 **Highlighted Background:** Indicates a volume spike that surpasses the defined threshold.
* 🏷️ **"Vol Spike" Label:** Clearly marks the exact bar of the spike for quick reference.
**Usage:**
Use these clear volume spike alerts to identify potential trading opportunities, confirmations, or shifts in market momentum. Combine this with other technical indicators for enhanced analysis.
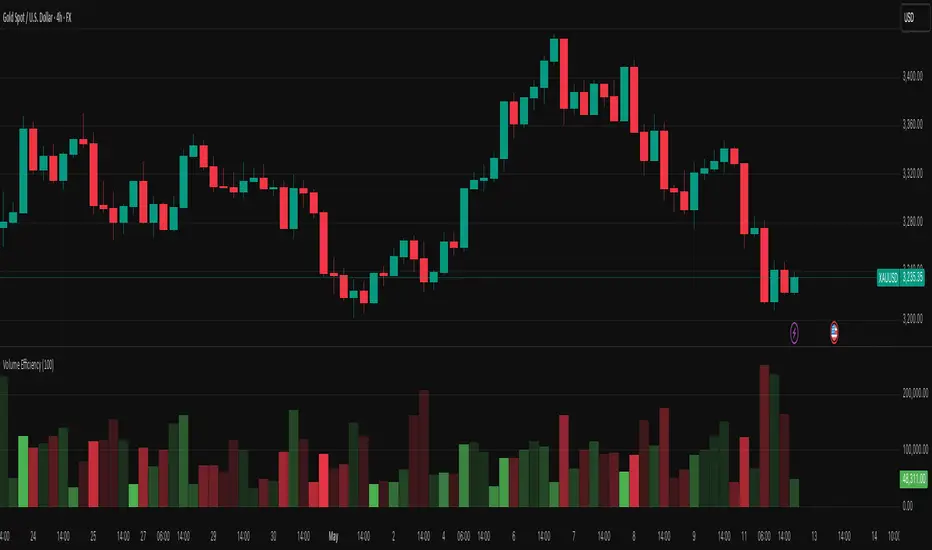
Volume EfficiencyThis indicator displays each candle's volume in an enhanced visual form, combining the amount of volume with the efficiency of the price movement.
Each volume bar changes its color intensity based on:
Higher efficiency (large price movement with low volume) → stronger color.
Lower efficiency (high volume with little price movement) → weaker color.
Additionally:
Green: Bullish candles (close > open).
Red: Bearish candles (close < open).
The color reflects not only the volume but also how "easily" the price moved.
The efficiency calculation is based on the actual body movement of the candle (abs(close - open)) divided by the total volume, dynamically adjusted to the maximum efficiency over the last N candles (configurable).
Interpretation:
Intensely green or red volume bars: clean and efficient movements (low resistance).
Pale bars: market absorption or indecision (high volume but little price movement).
Configurable parameter:
Efficiency period: number of candles used to normalise the maximum efficiency.
Volume Intelligence Suite (VIS) v2📊 Volume Intelligence Suite – Smart Volume, Smart Trading
The Volume Intelligence Suite is a powerful, all-in-one TradingView indicator designed to give traders deeper insight into market activity by visualizing volume behavior with price action context. Whether you're a scalper, day trader, or swing trader, this tool helps uncover hidden momentum, institutional activity, and potential reversals with precision.
🔍 Key Features:
Dynamic Volume Zones – Highlights high and low volume areas to spot accumulation/distribution ranges.
Volume Spikes Detector – Automatically marks abnormal volume bars signaling potential breakout or trap setups.
Smart Delta Highlighting – Compares bullish vs bearish volume in real time to reveal buyer/seller strength shifts.
Session-Based Volume Profiling – Breaks volume into key trading sessions (e.g., London, New York) for clearer context.
Volume Heatmap Overlay – Optional heatmap to show intensity and velocity of volume flow per candle.
Custom Alerts – Built-in alerts for volume surges, divergences, and exhaustion signals.
Optimized for Kill Zone Analysis – Pairs perfectly with ICT-style session strategies and Waqar Asim’s trading methods.
🧠 Why Use Volume Intelligence?
Most traders overlook the story behind each candle. Volume Intelligence Suite helps you "see the why behind the move" — exposing key areas of interest where smart money may be active. Instead of reacting late, this tool puts you in position to anticipate.
Use it to:
Validate breakouts
Detect fakeouts and liquidity grabs
Confirm bias during kill zones
Analyze volume divergence with price swings
⚙️ Fully Customizable:
From volume thresholds to visual styles and session timings, everything is user-adjustable to fit your market, timeframe, and strategy.
✅ Best For:
ICT/Smart Money Concepts (SMC) traders
Breakout & reversal traders
Kill zone session scalpers
Institutional footprint followers

Volume-Price Momentum IndicatorVolume-Price Momentum Indicator (VPMI)
Overview
The Volume-Price Momentum Indicator (VPMI), developed by Kevin Svenson , is a powerful technical analysis tool designed to identify strong bullish and bearish momentum in price movements, driven by volume dynamics. By analyzing price changes and volume surges over a user-defined lookback period, VPMI highlights potential trend shifts and continuation patterns through a smoothed histogram, optional labels, and background highlights. Ideal for traders seeking to capture momentum-driven opportunities, VPMI is suitable for various markets, including stocks, forex, and cryptocurrencies.
How It Works
VPMI calculates the difference between volume-weighted buying and selling pressure based on price changes over a specified lookback period. It amplifies signals during high-volume periods, applies smoothing to reduce noise, and uses momentum checks to detect sustained trends.
Indicator display:
A histogram that oscillates above (bullish) or below (bearish) a zero line, with brighter colors indicating stronger momentum and faded colors for weaker signals.
Optional labels ("Bullish" or "Bearish") to mark significant momentum shifts.
Optional background highlights to visually emphasize strong trend conditions.
Alerts to notify users when strong bullish or bearish momentum is detected.
Key Features
Customizable Settings:
Adjust the lookback period, volume threshold, momentum length, and smoothing to suit your trading style.
Volume Sensitivity:
Emphasizes price movements during high-volume surges, enhancing signal reliability.
Momentum Detection: Uses linear regression and momentum change to confirm sustained trends, reducing false signals.
Visual Clarity:
Offers a clear histogram with color-coded signals, plus optional labels and backgrounds for enhanced chart readability.
Alerts:
Configurable alerts for strong momentum signals, enabling timely trade decisions.
Inputs and Customization
Lookback Period (Default: 9):
Sets the number of bars to analyze price changes. Higher values smooth signals but may lag.
Volume Threshold (Default: 1.4):
Defines the volume level (relative to a 20-period SMA) that qualifies as a surge, amplifying signals.
High Volume Multiplier (Default: 1.5):
Boosts histogram values during high-volume periods for stronger signals.
Histogram Smoothing Length (Default: 4):
Controls the EMA smoothing applied to the histogram, reducing noise.
Momentum Check Length (Default: 4):
Sets the period for momentum trend analysis (recommended to be less than Lookback Period).
Momentum Threshold (Default: 6):
Defines the minimum momentum change required for strong signals.
Show Labels (Default: Off):
Toggle to display "Bullish" or "Bearish" labels on significant momentum shifts.
Show Backgrounds (Default: Off):
Toggle to highlight chart backgrounds during strong momentum periods.
Bullish/Bearish Colors:
Customize colors for bullish (default: green) and bearish (default: red) signals.
Faded Transparency (Default: 40):
Adjusts the transparency of weaker signals for visual distinction.
How to Use
Interpret Signals:
Above Zero (Green):
Indicates bullish momentum. Bright green suggests strong, sustained buying pressure.
Below Zero (Red):
Indicates bearish momentum. Bright red suggests strong, sustained selling pressure.
Faded Colors:
Weaker momentum, potentially signaling consolidation or trend exhaustion.
Enable Visuals:
Turn on "Show Labels" and "Show Backgrounds" in the settings for additional context on strong momentum signals.
Set Alerts:
Use the built-in alert conditions ("Strong Bullish Momentum" or "Strong Bearish Momentum") to receive notifications when significant trends emerge.
Combine with Other Tools:
Pair VPMI with support/resistance levels, trendlines, or other indicators (e.g., RSI, MACD) for confirmation.
Best Practices
Timeframe:
VPMI works on all timeframes, but shorter timeframes (e.g., 5m, 15m) may produce more signals, while longer timeframes (e.g., 1h, 4h, 1D) offer higher reliability.
Market Conditions:
Most effective in trending markets. In choppy or sideways markets, consider increasing the smoothing length or momentum threshold to filter noise.
Risk Management:
Always use VPMI signals in conjunction with a robust trading plan, including stop-losses and position sizing.
Limitations
Lagging Nature:
As a momentum indicator, VPMI may lag in fast-moving markets due to smoothing and lookback calculations.
False Signals:
In low-volume or ranging markets, signals may be less reliable. Adjust the volume threshold or momentum settings to improve accuracy.
Customization Required:
Optimal settings vary by asset and timeframe. Experiment with inputs to align with your trading strategy.
Why Use VPMI?
VPMI offers a unique blend of volume and price momentum analysis, making it a versatile tool for traders seeking to identify high-probability trend opportunities. Its customizable inputs, clear visuals, and alert capabilities empower users to tailor the indicator to their needs, whether for day trading, swing trading, or long-term analysis.
Get Started
Apply VPMI to your chart, tweak the settings to match your trading style, and start exploring momentum-driven opportunities. For questions or feedback, consult TradingView’s community forums or documentation. Happy trading!
