Smart Money Volume Matrix [Ata]Smart Money Volume Matrix
The Smart Money Volume Matrix (SMV Matrix) is an advanced volume-spread analysis (VSA) dashboard and charting tool designed to identify significant market anomalies by analyzing the relationship between price extremes and volume flow.
Unlike traditional indicators that rely solely on moving averages or oscillators, this tool performs a "Snapshot Analysis" of a defined lookback period (default: 100 bars) to rank price action based on Order Flow Dominance. It isolates the Top 10 Highest and Lowest Close prices and scrutinizes the volume behind them to categorize market sentiment into four distinct phases: Distribution, No Demand, Absorption, and Exhaustion.
Core Logic & Methodology
The script operates on a Zero-Lag Snapshot Engine. It does not print historical signals bar-by-bar; instead, it evaluates the current market structure relative to the recent history (Lookback Period).
1. Ranking Engine: The script scans the lookback period to find the Top 10 Highest Closes and Top 10 Lowest Closes.
2. Volume Classification: For each ranked bar, it calculates the "Intrabar Buy/Sell Volume" (or approximates it using candle geometry if Intrabar data is unavailable).
3. Dominance Detection: It compares Buying Volume vs. Selling Volume to determine who is in control at critical price levels.
Signal Classifications (VSA Logic)
The indicator generates labels on the chart and updates the dashboard table based on the following logic:
1. At Price Tops (Resistance Areas):
- Distribution (Supply): High Price + High Total Volume + Sellers Dominant.
Interpretation: Indicates heavy institutional selling into rising prices. Often precedes a reversal.
- Buy Climax: High Price + High Total Volume + Buyers Dominant.
Interpretation: Extreme buying frenzy. While bullish, it often marks a "trap" or temporary top due to exhaustion.
- No Demand: High Price + Low Volume.
Interpretation: Prices drifted higher but lack institutional participation. A sign of weakness.
2. At Price Bottoms (Support Areas):
- Absorption: Low Price + High Total Volume + Buyers Dominant.
Interpretation: Institutional money is absorbing selling pressure (passive buying). A strong sign of accumulation.
- Panic Sell: Low Price + High Total Volume + Sellers Dominant.
Interpretation: Extreme fear. High volume at lows typically indicates capitulation and potential hands-changing.
- Exhaustion: Low Price + Low Volume.
Interpretation: Selling pressure has dried up. The market may float upward due to lack of sellers.
Key Features
- Dashboard Matrix Table:
Displays the exact Close Price, Buy/Sell Volume, and Market State (Group) for the Top 10 ranking bars.
Smart Footer: Automatically detects the active "Resistance Zone" (derived from G1 Distribution levels) and "Support Zone" (derived from G3 Absorption levels) and reports the current price status relative to these zones (e.g., "Testing Resistance", "Breakout", "At Support").
- Smart Zones (Auto S/R):
Automatically draws Support and Resistance boxes extending into the future based on the most significant volume clusters found in the rankings. Includes logic to detect "Flips" (e.g., when Support breaks, it is labeled as a flip to Resistance).
- Average Trend Channels:
Calculates a Linear Regression trend line based specifically on the coordinates of the Top 10 Highs and Top 10 Lows, providing a "Best Fit" channel for the current market structure.
- Visual Clarity:
Labels utilize a "Smart Stacking" algorithm to prevent overlap on the chart. Guide lines connect labels to their respective candles for precise identification.
Settings & Configuration
- Matrix Settings: Lookback Period (default 100 bars) and Top Rank Count.
- Volume Engine: Choose between "Intrabar (Precise)" for accurate order flow or "Geometry (Approx)" for standard volume estimation.
- Visuals: Toggle Table, Labels, Lines, Zones, and Trend Lines. Adjust transparency and font sizes.
IMPORTANT NOTE ON SNAPSHOT LOGIC
This indicator is designed as a Real-Time Dashboard. It continuously updates the "Top 10" list as new candles form. Therefore, a label that appears on a candle may disappear if that candle falls out of the Top 10 ranking or leaves the lookback window. This is intended behavior to ensure the chart always reflects the current most critical levels, rather than a historical record of past signals. It is best used for live market analysis rather than historical back testing.
Disclaimer: This tool is for educational and analytical purposes only. Volume analysis is subjective and should be used in conjunction with other methods of technical analysis.
在腳本中搜尋"volume"

POC Volume Bar (Highest Volume in Range)What the highlighted POC bar means
🔶 1. Institutional interest
A POC often identifies where big money stepped in.
🔶 2. Support or resistance pivot
Large volume often signals:
• A reversal
• A breakout
• Or the beginning of a trend
🔶 3. Liquidity magnet
Price tends to revisit high-volume bars.
They act like magnets.
🔶 4. Trend confirmation or exhaustion
High volume on:
• Green candle → bullish participation
• Red candle → distribution / aggressive selling

Moving Average Volume (20, 50)Shows two moving averages of volume, the 20 and 50 periods.
white bars in the background show volume, look for breaks of the target lines to confirm a breakout with volume
green shaded regions show how much higher the current volume is compared to historical volume
the greener the shade, the higher the multiple is (cap is 10x higher)
indicator is to be used with other breakout identifiers, or to help confirm the strength of a move out of an SAR level.

Up/Down Volume Delta %this script is based on FractalTrade_'s rendition of the up/down volume bars.
the shortcomings of that chart were that large volume bars caused the auto-scaling to shrink smaller volume bar displays to the point where much of the data was too small to see.
in this chart, the bars are displaying the percent delta out of the total bar volume. this way, large overall volume bars do not cause visual compression to everything else in the chart.
I've used color modulation to indicate relation to a relative volume point, so users can still tell when overall volume is large or small. when volume is under a moving average, the bars will display at a basis transparency. when the volume is over the average, the brightness will increase up to a specific ratio of volume defined by the user.
for example, if basis transparency is at 20, and the full opacity ratio is at 3, and the volume average is at 1M, a volume of 750k will display the delta bar at the basis transparency. a volume of 3M will achieve full brightness. a volume of 2M will display with moderate brightness (about 60%), but still stand out against other bars with basis transparency.
areas of the chart that are either increasing bar sizes or increasing in brightness can indicate directional force. when volume delta direction contradicts the candle direction, this can indicate support / resistance.

Volumetric Expansion/Contraction### Indicator Title: Volumetric Expansion/Contraction
### Summary
The Volumetric Expansion/Contraction (PCC) indicator is a comprehensive momentum oscillator designed to identify high-conviction price moves. Unlike traditional oscillators that only look at price, the PCC integrates four critical dimensions of market activity: **Price Change**, **Relative Volume (RVOL)**, **Cumulative Volume Delta (CVD)**, and **Average True Range (ATR)**.
Its primary purpose is to help traders distinguish between meaningful, volume-backed market expansions and noisy, unsustainable price action. It gives more weight to moves that occur in a controlled, low-volatility environment, highlighting potential starts of new trends or significant shifts in market sentiment.
### Key Concepts & Purpose
The indicator's unique formula synthesizes the following concepts:
1. **Price Change:** Measures the magnitude and direction of the primary move.
2. **Relative Volume (RVOL):** Confirms that the move is backed by significant volume compared to its recent average, indicating institutional participation.
3. **Cumulative Volume Delta (CVD):** Measures the underlying buying and selling pressure, confirming that the price move is aligned with the net flow of market orders.
4. **Inverse Volatility (ATR):** This is the indicator's unique twist. It normalizes the signal by the inverse of the Average True Range. This means the indicator's value is **amplified** when volatility (ATR) is low (signifying a controlled, confident expansion) and **dampened** when volatility is high (filtering out chaotic, less predictable moves).
The goal is to provide a single, easy-to-read oscillator that signals when price, volume, and order flow are all in alignment, especially during a breakout from a period of contraction.
### Features
* **Main Oscillator Line:** A single line plotted in a separate pane that represents the calculated strength of the volumetric expansion or contraction.
* **Zero Line:** A dotted reference line to easily distinguish between bullish (above zero) and bearish (below zero) regimes.
* **Visual Threshold Zones:** The background automatically changes color to highlight periods of significant strength:
* **Bright Green:** Indicates a "Strong Up Move" when the oscillator crosses above the user-defined upper threshold.
* **Bright Fuchsia:** Indicates a "Strong Down Move" when the oscillator crosses below the user-defined lower threshold.
### Configurable Settings & Filters
The indicator is fully customizable to allow for extensive testing and adaptation to different assets and timeframes.
#### Main Calculation Inputs
* **Price Change Lookback:** Sets the period for calculating the primary price change.
* **CVD Normalization Length:** The lookback period for normalizing the Cumulative Volume Delta.
* **RVOL Avg Volume Length:** The lookback for the simple moving average of volume, used to calculate RVOL.
* **RVOL Normalization Length:** The lookback period for normalizing the RVOL score.
* **ATR Length & Normalization Length:** Sets the periods for calculating the ATR and its longer-term average for normalization.
#### Weights
* Fine-tune the impact of each core component on the final calculation, allowing you to emphasize what matters most to your strategy (e.g., give more weight to CVD or RVOL).
#### External Market Filter (Powerful Feature)
* **Enable SPY/QQQ Filter for Up Moves?:** A checkbox to activate a powerful regime filter.
* **Symbol:** A dropdown to choose whether to filter signals based on the trend of **SPY** or **QQQ**.
* **SMA Period:** Sets the lookback period for the Simple Moving Average (default is 50).
* **How it works:** When enabled, this filter will **only allow "Strong Up Move" signals to appear if the chosen symbol (SPY or QQQ) is currently trading above its specified SMA**. This is an excellent tool for aligning your signals with the broader market trend and avoiding bullish entries in a bearish market.
#### Visuals
* **Upper/Lower Threshold:** Allows you to define what level the oscillator must cross to trigger the colored background zones, letting you customize the indicator's sensitivity.
***
**Disclaimer:** This tool is designed for market analysis and confluence. It is not a standalone trading system. Always use this indicator in conjunction with your own trading strategy, risk management, and other forms of analysis.

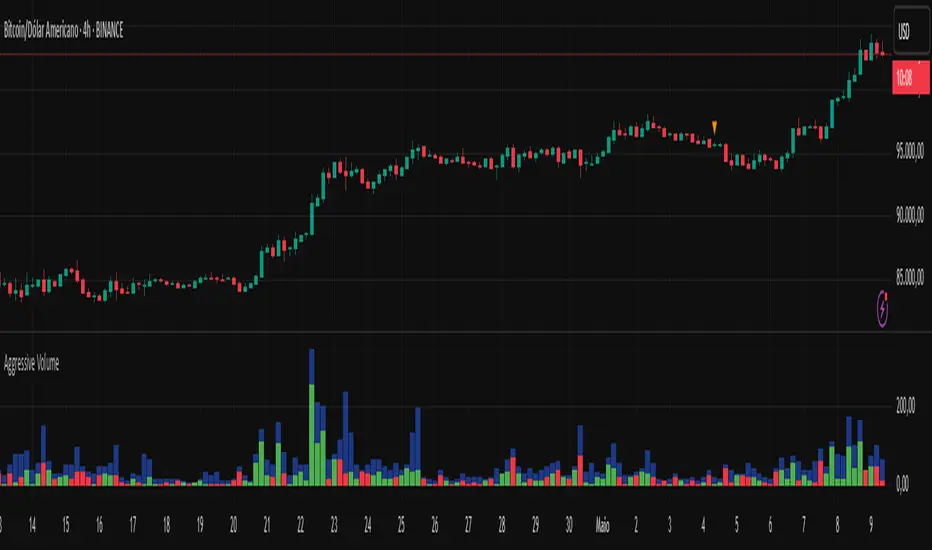
Aggressive Volume 📊 Indicator: Aggressive Volume – Simulated Buy/Sell Pressure
Aggressive Volume estimates delta volume using candle data to simulate the market’s internal buy/sell pressure. It helps visualize how aggressive buyers or sellers are moving the price without needing full order flow access.
⚙️ How It Works:
Calculates simulated delta volume based on candle direction and volume.
Bullish candles (close > open) suggest dominance by buyers.
Bearish candles (close < open) suggest dominance by sellers.
Delta is the difference between simulated buying and selling pressure.
🔍 Key Features:
Visual bars showing aggressive buyer vs seller dominance
Helps spot trend strength, momentum bursts, and potential reversals
Simple, effective, and compatible with any timeframe
Lightweight and ideal for scalping, day trading, and swing trading
💡 How to Use:
Look for strong positive delta during bullish trends for confirmation.
Watch for delta weakening or divergence as potential reversal signals.
Combine with trend indicators or price action for enhanced accuracy.
📊 Indicador: Volume Agressivo – Pressão de Compra/Venda Simulada
Volume Agressivo estima o delta de volume utilizando dados dos candles para simular a pressão interna de compra/venda do mercado. Ele ajuda a visualizar como os compradores ou vendedores agressivos estão movendo o preço, sem precisar de acesso completo ao fluxo de ordens.
⚙️ Como Funciona:
Calcula o delta de volume simulado com base na direção do candle e no volume.
Candles de alta (fechamento > abertura) indicam predominância de compradores.
Candles de baixa (fechamento < abertura) indicam predominância de vendedores.
O delta é a diferença entre a pressão de compra e venda simulada.
🔍 Principais Funcionalidades:
Barras visuais mostrando a dominância de compradores vs vendedores agressivos
Ajuda a identificar a força da tendência, explosões de momentum e possíveis reversões
Simples, eficaz e compatível com qualquer período de tempo
Leve e ideal para scalping, day trading e swing trading
💡 Como Usar:
Procure por delta positivo forte durante tendências de alta para confirmação.
Observe o delta enfraquecendo ou divergências como sinais de possível reversão.
Combine com indicadores de tendência ou price action para maior precisão.
Volume Order Blocks [BigBeluga]Volume Order Blocks is a powerful indicator that identifies significant order blocks based on price structure, helping traders spot key supply and demand zones. The tool leverages EMA crossovers to determine the formation of bullish and bearish order blocks while visualizing their associated volume and relative strength.
🔵 Key Features:
Order Block Detection via EMA Crossovers:
Plots bullish order blocks at recent lows when the short EMA crosses above the long EMA.
Plots bearish order blocks at recent highs when the short EMA crosses below the long EMA.
Uses customizable sensitivity through the “Sensitivity Detection” setting to fine-tune block formation.
Volume Collection and Visualization:
Calculates the total volume between the EMA crossover bar and the corresponding high (bearish OB) or low (bullish OB).
Displays the absolute volume amount next to each order block for clear volume insights.
Percentage Volume Distribution:
Shows the percentage distribution of volume among bullish or bearish order blocks.
100% represents the cumulative volume of all OBs in the same category (bullish or bearish).
Order Block Removal Conditions:
Bullish order blocks are removed when the price closes below the bottom of the block.
Bearish order blocks are removed when the price closes above the top of the block.
Helps maintain chart clarity by only displaying relevant and active levels.
Midline Feature:
Dashed midline inside each order block indicates the midpoint between the upper and lower boundaries.
Traders can toggle the midline on or off through the settings.
Shadow Trend:
Shadow Trend dynamically visualizes trend strength and direction by adapting its color intensity based on price movement.
🔵 Usage:
Supply & Demand Zones: Use bullish and bearish order blocks to identify key market reversal or continuation points.
Volume Strength Analysis: Compare volume percentages to gauge which order blocks hold stronger market significance.
Breakout Confirmation: Monitor block removal conditions for potential breakout signals beyond support or resistance zones.
Trend Reversals: Combine EMA crossovers with order block formation for early trend reversal detection.
Risk Management: Use OB boundaries as potential stop-loss or entry points.
Volume Order Blocks is an essential tool for traders seeking to incorporate volume-based supply and demand analysis into their trading strategy. By combining price action, volume data, and EMA crossovers, it offers a comprehensive view of market structure and potential turning points.

VSA Volume + Fibonacci (Volunacci)Overview
This indicator combines Volume Spread Analysis (VSA) with Fibonacci levels to identify key price zones based on volume behavior. It helps traders determine potential support and resistance levels influenced by volume strength.
How It Works
Volume Calculation
The indicator calculates volume levels based on the selected timeframe.
It identifies high volume spikes and low volume dips, which are critical for detecting supply and demand shifts.
It uses a simple moving average (SMA) of volume to smooth fluctuations.
Fibonacci Levels Integration
When a high-volume event is detected, the indicator records the highest high and lowest low of that candle.
It then plots Fibonacci retracement and extension levels to highlight potential price reaction zones.
Negative Fibonacci levels are included to identify possible deep retracements.
Visual Features
The indicator adapts to both light and dark themes for better visibility.
Fibonacci lines are color-coded based on key retracement and extension levels.
A table displaying key Fibonacci levels and their corresponding prices is provided for quick reference.
Why Is This Indicator Useful?
It helps traders spot accumulation and distribution phases by analyzing volume at key price points.
The combination of VSA and Fibonacci allows traders to confirm trend strength and identify potential reversal points.
Works well for trend-following strategies, scalping, and breakout trading.
How to Use This Indicator?
Use it to confirm breakouts or reversals at Fibonacci levels when volume supports the move.
Watch for high-volume spikes near key Fibonacci zones—these can signal strong trend continuation or reversal.
Use the displayed Fibonacci table to quickly assess price reaction levels.
Credits
This script was inspired by the Hidden Gap’s VSA Volume indicator by HPotter and has been enhanced by integrating Fibonacci-based analysis.
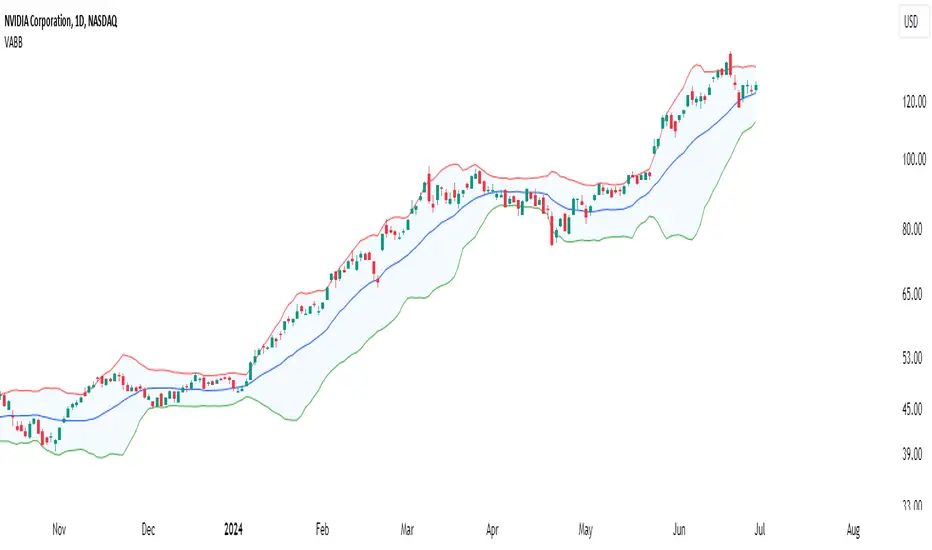
Volume-Adjusted Bollinger BandsThe Volume-Adjusted Bollinger Bands (VABB) indicator is an advanced technical analysis tool that enhances the traditional Bollinger Bands by incorporating volume data. This integration allows the bands to dynamically adjust based on market volume, providing a more nuanced view of price movements and volatility. The key qualities of the VABB indicator include:
1. Dynamic Adjustment with Volume: Traditional Bollinger Bands are based solely on price data and standard deviations. The VABB indicator adjusts the width of the bands based on the volume ratio, making them more responsive to changes in market activity. This means that during periods of high volume, the bands will expand, and during periods of low volume, they will contract. This adjustment helps to reinforce the significance of price movements relative to the central line (VWMA).
2. Volume-Weighted Moving Average (VWMA): Instead of using a simple moving average (SMA) as the central line, the VABB uses the VWMA, which weights prices by volume. This provides a more accurate representation of the average price level, considering the trading volume.
3. Enhanced Signal Reliability: By incorporating volume, the VABB can filter out false signals that might occur in low-volume conditions. This makes the indicator particularly useful for identifying significant price movements that are supported by strong trading activity.
How to Use and Interpret the VABB Indicator
To use the VABB indicator, you need to set it up on your trading platform with the following parameters:
1. BB Length: The number of periods for calculating the Bollinger Bands (default is 20).
2. BB Multiplier: The multiplier for the standard deviation to set the width of the Bollinger Bands (default is 2.0).
3. Volume MA Length: The number of periods for calculating the moving average of the volume (default is 14).
Volume Ratio Smoothing Length: The number of periods for smoothing the volume ratio (default is 5).
Interpretation
1.Trend Identification: The VWMA serves as the central line. When the price is above the VWMA, it indicates an uptrend, and when it is below, it indicates a downtrend. The direction of the VWMA itself can also signal the trend's strength.
2. Volatility and Volume Analysis: The width of the VABB bands reflects both volatility and volume. Wider bands indicate high volatility and/or high volume, suggesting significant price movements. Narrower bands indicate low volatility and/or low volume, suggesting consolidation.
3. Trading Signals:
Breakouts: A price move outside the adjusted upper or lower bands can signal a potential breakout. High volume during such moves reinforces the breakout's validity.
Reversals: When the price touches or crosses the adjusted upper band, it may indicate overbought conditions, while touching or crossing the adjusted lower band may indicate oversold conditions. These conditions can signal potential reversals, especially if confirmed by other indicators or volume patterns.
Volume Confirmation: The volume ratio component helps confirm the strength of price movements. For instance, a breakout accompanied by a high volume ratio is more likely to be sustained than one with a low volume ratio.
Practical Example
Bullish Scenario: If the price crosses above the adjusted upper band with a high volume ratio, it suggests a strong bullish breakout. Traders might consider entering a long position, setting a stop-loss just below the VWMA or the lower band.
Bearish Scenario: Conversely, if the price crosses below the adjusted lower band with a high volume ratio, it suggests a strong bearish breakout. Traders might consider entering a short position, setting a stop-loss just above the VWMA or the upper band.
Conclusion
The Volume-Adjusted Bollinger Bands (VABB) indicator is a powerful tool that enhances traditional Bollinger Bands by incorporating volume data. This dynamic adjustment helps traders better understand market conditions and make more informed trading decisions. By using the VABB indicator, traders can identify significant price movements supported by volume, improving the reliability of their trading signals.
The Volume-Adjusted Bollinger Bands (VABB) indicator is provided for educational and informational purposes only. It is not financial advice and should not be construed as a recommendation to buy, sell, or hold any financial instrument. Trading involves significant risk of loss and is not suitable for all investors. Past performance is not indicative of future results.
Volume-Enhanced Momentum Moving Average (VEMMA)Volume-Enhanced Momentum Moving Average (VEMMA)
Overview:
The Volume-Enhanced Momentum Moving Average (VEMMA) helps you spot market trends by combining momentum and volume as a moving average. This unique moving average adjusts itself based on the strength and activity of the market, giving you a clearer picture of what’s happening.
How It Works:
1. Key Settings (all of these are adjustable in the settings panel of the indicator):
◦ Base Length: Looks back over the last 50 days by default.
◦ Momentum Length: Uses the past 14 days to measure market strength.
◦ Volume Length: Uses the past 30 days to average trading volume.
◦ High/Low Thresholds: Considers RSI values above 70 as high momentum and below 30 as low momentum.
2. Momentum and Volume:
◦ Momentum: Calculated using the Relative Strength Index (RSI) to see if the market is gaining or losing strength.
◦ Volume: Average trading volume is calculated over the last 30 days to gauge trading activity.
3. VEMMA Calculation:
◦ For each of the past 50 days:
▪ Check Momentum: If RSI > 70, it’s high momentum; if RSI < 30, it’s low.
▪ Weight by Volume: High momentum days with high volume get more weight; low momentum days get less.
▪ Combine: Multiply the closing price by this weight and sum it up.
◦ Average: Divide the total by 50 to get the VEMMA value.
4. Visuals:
◦ Lines: Two lines, VEMMA1 (blue) and VEMMA2 (orange), show the adjusted moving averages.
◦ Colours: Background colors help you quickly spot high (green) and low (red) momentum periods.
How to Use:
• Spot Trends: Rising VEMMA lines suggest an uptrend; falling lines suggest a downtrend.
• Confirm Signals: When both VEMMA1 and VEMMA2 move together, it indicates a strong trend.
• Identify Reversals: Watch for background color changes from green to red or vice versa to catch potential trend reversals.
If the market has been strong and active, the VEMMA line will rise more sharply. If the market is weak and quiet, the line will be smoother.
Benefits:
• Integrated View: Combines market strength and trading activity for a fuller picture.
• Responsive: Adapts to significant market changes, highlighting key movements.
• Easy to Read: Clear visuals with color-coded backgrounds make interpretation simple.
Remember, just like any other indicator, this is not supposed to be used alone. Use it as part of your greater trading strategy. I do however believe it works exceptionally well for finding longer term trends early. The default VEMMA settings work very well as replacement for the EMA 200. Try it and see how it goes. Play around with the settings. Feedback appreciated.

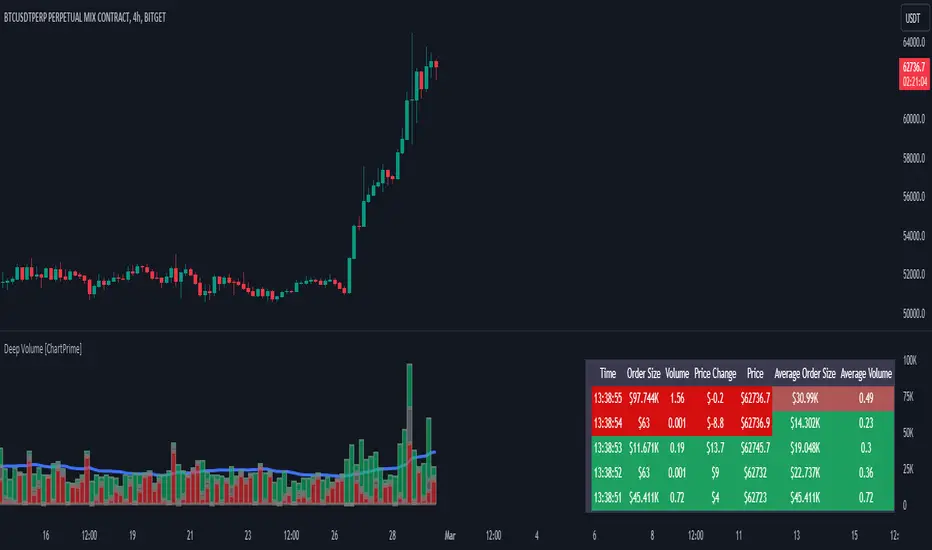
Deep Volume [ChartPrime]Deep Volume is an indicator designed to give you high fidelity volume information. It does this by utilizing real time data provided by Tradingview to generate a wide range of metrics. We have included a convenient column chart to visualize the polarity of the volume, and a table to see the real time data. This works by utilizing pine script's varip feature to get information within candles. This is convenient as it allows users to get lower time frame information without the use of ltf functions. The result is seconds level data with out the need to be on a lower time frame chart. As a result, as you increase the time frame of the chart the updates will become slower. This is because Tradingview doesn't update the chart information as frequently on higher time frames as there isn't as much of a need.
This indicator works on real time data so to compensate for this we generate a simulated history based on candle structure. This helps in estimating the state of the moving average before the real time data starts. As a result the estimated history isn't as accurate and should be treated as such. That being said it is nice to have an estimation when the indicator is first loaded onto the chart.
Finally we have included a cumulative volume comparison that shows you how much volume there is compared to the average cumulative volume for the day. This metric utilizes a gradient to help you interpret the information at a glance. Low daily volume is represented with grays by default, while normal volume and greater is represented with a green color by default.
The table is partitioned into two sections; tick data, and average data. On the left you will see color coded information based on the direction of the move. On the left, the information is color coded based on the average movement direction. You can control how much information is displayed in the table within the indicators settings. This is defaulted to 20 but it can be as long or short as you like. Every new candle open the far left of the table you will see a 🗘 symbol and at the start of a new session you will see a 🗓 symbol.
The included metrics are as follows:
Time: This displays the time of the real time data update.
Time Delta: This displays the elapsed time between updates.
Order Size: This is the volume times the price change between updates.
Volume: This is the volume change for the update.
Price Change: This is the change in price since the last update.
Price: This is the price of the asset at the time of the update.
Speed of Tape: This is the average time delta. Use this to see how quickly the market is moving.
Average Order Size: This is the average order size.
Average Volume: This is the average volume
Volume Ratio: This the the ratio of bullish to bearish volume as expressed by a percent. 100% is all bullish within the window and -100% is all bearish within the window.
Average Price Change: This is the average price change within the window.
Sensitivity: This is a volatility metric designed to show you the price change per 1 volume unit.
Relative Sensitivity: This is a volatility metric designed to show you the average price change per average volume.
Enjoy
Volume Speed [By MUQWISHI]▋ INTRODUCTION :
The “Volume Dynamic Scale Bar” is a method for determining the dominance of volume flow over a selected length and timeframe, indicating whether buyers or sellers are in control. In addition, it detects the average speed of volume flow over a specified period. This indicator is almost equivalent to Time & Sales (Tape) .
_______________________
▋ OVERVIEW:
_______________________
▋ ELEMENTS
(1) Volume Dynamic Scale Bar. As we observe, it has similar total up and down volume values to what we're seeing in the table. Note they have similar default inputs.
(2) A notice of a significant volume came.
(3) It estimates the speed of the average volume flow. In the tooltip, it shows the maximum and minimum recorded speeds along with the time since the chart was updated.
(4) Info of entered length and the selected timeframe.
(5) The widget will flash gradually for 3 seconds when there’s a significant volume occurred based on the selected timeframe.
_______________________
▋ INDICATOR SETTINGS:
(1) Timezone.
(2) Widget location and size on chart.
(3) Up & Down volume colors.
(4) Option to enable a visual flash when a single volume is more than {X value} of Average. For instance, 2 → means double the average volume.
(5) Fetch data from the selected lower timeframe.
(6) Number of bars at chosen timeframe.
(7) Volume OR Price Volume.
_____________________
▋ COMMENT:
The Volume Dynamic Scale Bar should not be taken as a major concept to build a trading decision.
Please let me know if you have any questions.
Thank you.

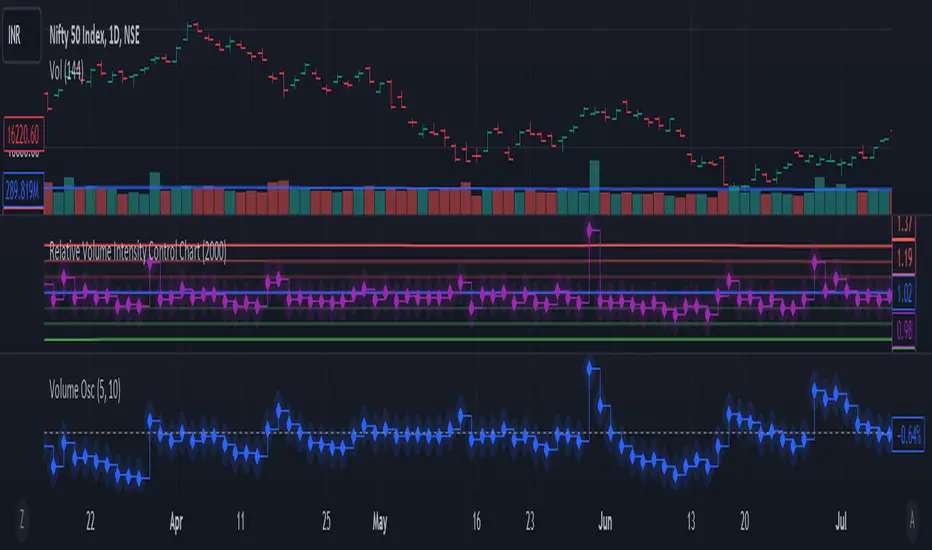
Relative Volume Intensity Control Chart***NOTE THE VOLUME OSCILATOR PROVIDED AT THE BOTTOM IS FOR COMPARSION AND IS NOT PART OF THE INDICATOR****
This indicator provides a comprehensive and a nuanced representation of volume relative to historical volume. The indicator aims to provide insights into the relative intensity of trading volume compared to historical data. It calculates two types of relative volume intensity: mean volume intensity and point volume intensity. The final indicator, "Relative_volume_intensity," is a combination of these two.
1. Point Volume Intensity:
Calculate the ratio of the current volume to the corresponding SMA from the previous period for each of the periods.
Normalize each ratio by dividing it by the corresponding normalized SMA.
Assign weights to each normalized ratio and calculate the point volume intensity.
Point volume intensity calculates the intensity of the current trading volume at a specific point in time relative to its historical moving average. It assesses how much the current volume deviates from the previous historical average for different lookback periods(current volume/ average volume of previous n days). The calculation involves dividing the current volume by the corresponding previous historical moving average and normalizing the result. The purpose of point volume intensity is to capture the immediate impact of the current volume on the overall intensity, providing a more dynamic and responsive measure.
2. Mean Volume Intensity:
Calculate the simple moving averages (SMA) of the volume for different periods (5, 8, 13, 21, 34, 55, 89, 144).
Normalize each SMA by dividing it by the SMA with the longest lookback (144).
Assign weights to each normalized SMA and calculate the mean volume intensity.
Mean volume intensity, on the other hand, takes a broader approach by looking at the mean (average) of various historical moving averages of volume. Instead of focusing on the current volume alone, it considers the historical average intensity over multiple periods. The purpose of mean volume intensity is to provide a smoother and more stable representation of the overall historical volume intensity. It helps filter out short-term fluctuations and provides a more comprehensive view of how the current volume compares to historical norms.
Purpose of Both:
Both point volume intensity and mean volume intensity contribute to the calculation of the final indicator, "Relative_volume_intensity." The idea is to combine these two perspectives to create a more comprehensive measure of relative volume intensity. By assigning equal weights to both components and taking a balanced approach, the indicator aims to capture both short-term spikes in volume and trends in volume intensity over a relatively extended periods.
In calculation of both point volume intensity and mean volume intensity, shorter-term moving averages (e.g., 5, 8) have higher weights, suggesting a greater emphasis on recent volume behavior.
Visualization:
The script then calculates the mean and standard deviation of the relative volume intensity over a specified lookback length.
Plot lines for the centerline (mean), upper and lower 3 standard deviations, upper and lower 2 standard deviations, and upper and lower 1 standard deviation.
Plot the relative volume intensity as a step line with diamond markers.
It is displayed like a control chart where we can see how the relative intensity is behaving when compared to longer historical lookback period.
Filtered Volume Profile [ChartPrime]The "Filtered Volume Profile" is a powerful tool that offers insights into market activity. It's a technical analysis tool used to understand the behavior of financial markets. It uses a fixed range volume profile to provide a histogram representing how much volume occurred at distinct price levels.
Profile in action with various significant levels displayed
How to Use
The script is designed to analyze cumulative trading volumes in different price bins over a certain period, also known as `'lookback'`. This lookback period can be defined by the user and it represents the number of bars to look back for calculating levels of support and resistance.
The `'Smoothing'` input determines the degree to which the output is smoothed. Higher values lead to smoother results but may impede the responsiveness of the indicator to rapid changes in volatility.
The `'Peak Sensitivity'` input is used to adjust the sensitivity of the script's peak detection algorithm. Setting this to a lower value makes the algorithm more sensitive to local changes in trading volume and may result in "noisier" outputs.
The `'Peak Threshold'` input specifies the number of bins that the peak detection mechanism should account for. Larger numbers imply that more volume bins are taken into account, and the resultant peaks are based on wider intervals.
The `'Mean Score Length'` input is used for scaling the mean score range. This is particularly important in defining the length of lookback bars that will be used to calculate the average close price.
Sinc Filter
The application of the sinc-filter to the Filtered Volume Profile reduces the risk of viewing artefacts that may misrepresent the underlying market behavior. Sinc filtering is a high-quality and sharp filter that doesn't manifest any ringing effects, making it an optimal choice for such volume profiling.
Histogram
On the histogram, the volume profile is colored based on the balance of bullish to bearish volume. If a particular bar is more intense in color, it represents a larger than usual volume during a single price bar. This is a clear signal of a strong buying or selling pressure at a particular price level.
Threshold for Peaks
The `peak_thresh` input determines the number of bins the algorithm takes in account for the peak detection feature. The 'peak' represents the level where a significant amount of volume trading has occurred, and usually is of interest as an indicative of support or resistance level.
By increasing the `peak_thresh`, you're raising the bar for what the algorithm perceives as a peak. This could result in fewer, but more significant peaks being identified.
History of Volume Profiles and Evolution into Sinc Filtering
Volume profiling has a rich history in market analysis, dating back to the 1950s when Richard D. Wyckoff, a legendary trader, introduced the concept of volume studies. He understood the critical significance of volume and its relationship with market price movement. The core of Wyckoff's technical analysis suite was the relationship between prices and volume, often termed as "Effort vs Results".
Moving forward, in the early 1800s, the esteemed mathematician J. R. Carson made key improvements to the sinc function, which formed the basis for sinc filtering application in time series data. Following these contributions, trading studies continued to create and integrate more advanced statistical measures into market analysis.
This culminated in the 1980s with J. Peter Steidlmayer’s introduction of Market Profile. He suggested that markets were a function of continuous two-way auction processes thus introducing the concept of viewing markets in price/time continuum and price distribution forms. Steidlmayer's Market Profile was the first wide-scale operation of organized volume and price data.
However, despite the introduction of such features, challenges in the analysis persisted, especially due to noise that could misinform trading decisions. This gap has given rise to the need for smoothing functions to help eliminate the noise and better interpret the data. Among such techniques, the sinc filter has become widely recognized within the trading community.
The sinc filter, because of its properties of constructing a smooth passing through all data points precisely and its ability to eliminate high-frequency noise, has been considered a natural transition in the evolution of volume profile strategies. The superior ability of the sinc filter to reduce noise and shield against over-fitting makes it an ideal choice for smoothing purposes in trading scripts, particularly where volume profiling forms the crux of the market analysis strategy, such as in Filtered Volume Profile.
Moving ahead, the use of volume-based studies seems likely to remain a core part of technical analysis. As long as markets operate based on supply and demand principles, understanding volume will remain key to discerning the intent behind price movements. And with the incorporation of advanced methods like sinc filtering, the accuracy and insight provided by these methodologies will only improve.
Mean Score
The mean score in the Filtered Volume Profile script plays an important role in probabilistic inferences regarding future price direction. This score essentially characterizes the statistical likelihood of price trends based on historical data.
The mean score is calculated over a configurable `'Mean Score Length'`. This variable sets the window or the timeframe for calculation of the mean score of the closing prices.
Statistically, this score takes advantage of the concept of z-scores and probabilities associated with the t-distribution (a type of probability distribution that is symmetric and bell-shaped, just like the standard normal distribution, but has heavier tails).
The z-score represents how many standard deviations an element is from the mean. In this case, the "element" is the price level (Point of Control).
The mean score section of the script calculates standard errors for the root mean squared error (RMSE) and addresses the uncertainty in the prediction of the future value of a random variable.
The RMSE of a model prediction concerning observed values is used to measure the differences between values predicted by a model and the values observed.
The lower the RMSE, the better the model is able to predict. A zero RMSE means a perfect fit to the data. In essence, it's a measure of how concentrated the data is around the line of best fit.
Through the mean score, the script effectively predicts the likelihood of the future close price being above or below our identified price level.
Summary
Filtered Volume Profile is a comprehensive trading view indicator which utilizes volume profiling, peak detection, mean score computations, and sinc-filter smoothing, altogether providing the finer details of market behavior.
It offers a customizable look back period, smoothing options, and peak sensitivity setting along with a uniquely set peak threshold. The application of the Sinc Filter ensures a high level of accuracy and noise reduction in volume profiling, making this script a reliable tool for gaining market insights.
Furthermore, the use of mean score calculations provides probabilistic insights into price movements, thus providing traders with a statistically sound foundation for their trading decisions. As trading markets advance, the use of such methodologies plays a pivotal role in formulating effective trading strategies and the Filtered Volume Profile is a successful embodiment of such advancements in the field of market analysis.

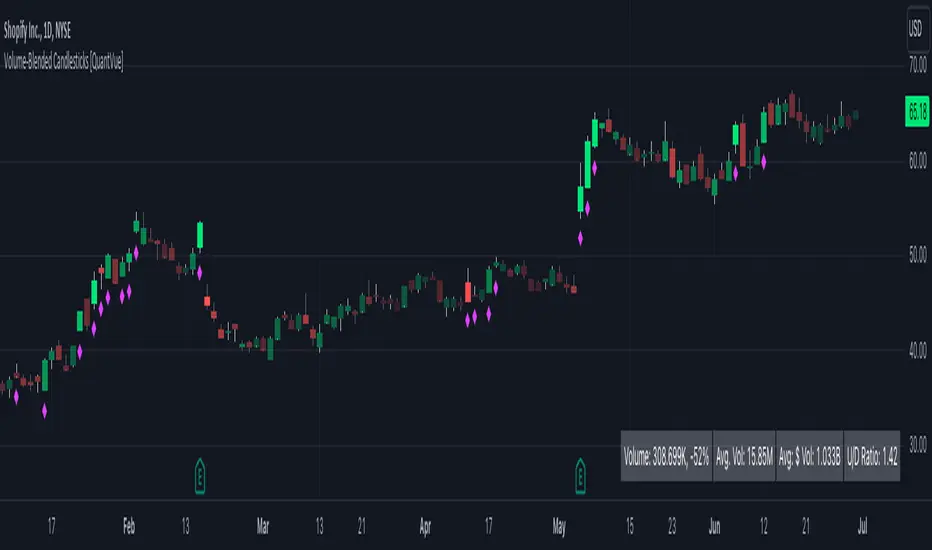
Volume-Blended Candlesticks [QuantVue]Introducing the Volume-Blended Candlestick Indicator, a powerful tool that seamlessly integrates volume information with candlesticks, providing you with a comprehensive view of market dynamics in a single glance.
The Volume-Blended Candlestick Indicator employs a unique approach of projecting volume totals by calculating the total volume traded per second and comparing it to the time left in the session as well as the historical average length selected by the user.
The indicator then dynamically adjusts the opacity of the candlestick colors based on the intensity of the projected volume. As volume intensifies, the candlestick colors become more pronounced, while low volume will cause colors to fade allowing you to visually perceive the level of buying or selling.
One of the standout features of the Volume-Blended Candlestick Indicator is its ability to identify pocket pivots. A pocket pivot is an up day with volume greater than any of the down days volume in the past 10 days. By highlighting these pocket pivots on your chart, the indicator helps you identify potential stealth accumulation.
In addition to blending volume with candlesticks and spotting pocket pivots, this versatile indicator provides you with an insightful table displaying key volume metrics. The table includes the average volume, average dollar volume, and the up-down volume ratio, allowing you to get a clear picture of buying and selling pressure.
Settings Include:
🔹Sensitivty Level: Normal, More, Less
🔹Volume MA Length
🔹Toggle Color based on previous close
🔹Show or hide volume info
🔹Chose candlestick colors
🔹Show or hide pocket pivots
🔹Show or hide volume info table
Don't hesitate to reach out with any questions or concerns.
We hope you enjoy!
Cheers.
OSPL Volume [Community Edition]NSE:BANKNIFTY1!
This indicator is based on the concepts popularized by @OptionsScalper123 "Siva" of OiPulse. His ideology Is that large moves come after high volume candles. For Nifty, high volume is considered to be a candle above 125k volume and for BankNifty it’s 50k.
This indicator allows you to cut the noise and focus only on the high volume candle. It shows high volume candle in a brighter shade and lower volume candles in a less visible shade.
You can set the minimum volume threshold limit for Nifty and BankNifty. The indicator smartly recognizes which index you are using it in and uses the respective threshold volume limit.
All colors are customizable.
Thanks for Siva for all the ideas and wonderful products he has given to the community
Thanks to all the wonderful Pinescipters for developing awesome indicators and keeping the source open.
The source code of this indicator is just a few lines. Hope you can use it in your projects and learn something from this just how I learned from other scripts.
Any changes or updates needed in this indicator, please suggest. I was thinking some kind of alerts can be added when volume crosses the threshold. Let me know.
Boost/like this indicator and comment if you find this useful. Cheers and happy trading!!!

Up/Down Volume + DeltaThis simple script is a modification of Tradingview's Up/Down Volume. In this case the delta between the buys and sells is plotted in columns style above the regular up/down volume columns. This gives a better visual of the dominant volume and is useful to spot divergences in tops and bottoms.
The indicators uses data from lower timeframe volumes. By default the lowest timeframe it will use is 1m, but for those that have a premium account you can try using a custom LTF set to seconds when scalping on the 1m chart.
Enjoy :)

[potatoshop] Volume Profile lower timeframeThis script is a volume profile that displays the volume of transactions in price blocks over a recent period of time.
For a more detailed representation, OHCLV values on the time frame lower than the time zone on the chart were called and expressed.
Low time frames are adjustable.
You can adjust the number of blocks and the most recent time period that you want to view.
Although it cannot be compared to the volume indicators provided for paid users of Trading-View, it has functioned by displaying transactions that are difficult to find on open source.
Displays the amount traded in each block and the percentage of the total over a given period.
POC represents the middle value of the block with the highest transaction volume as a line.
TPOC represents the block that stayed the longest regardless of the volume of transaction.
The reversal line appears when you determine the trading advantage of the rising and falling closing on a block basis and then have a different value from the neighboring blocks.
(I didn't mean it much, but I just put it in for fun.)
It represents the total volume of transactions traded in each block, and there are also check boxes in the settings window that represent the volume of transactions that closed higher and closed lower.
You can specify the color of each block.
The highest and lowest values for the set period and the total sum of each block are displayed at the bottom of the box.
Because it was made using a lot of arrays, the total transaction volume was marked separately to check the value.
When expressing the price block according to the trading volume percentage, it was a pity that the minimum pixel was 1 bar, so it could not be expressed delicately.
Although set to bar_time in Box properties xloc, 1 bar was actually the minimum unit of the X-axis value.
The logic used to place the transaction volume for each block is as follows.
1. Divide the difference between the high and low values of 1 LTF bar by the transaction volume .
2. Find the percentage of this LTF bar within each block.
3. Multiply the ratio by the transaction volume again.
4. Store the value in each block cell.
Below are the codes of the people I referred to this time.
1. ‘Time & volume point of control (TPOC & VPOC)’ by quantifytools
2. ‘Volume Profile ’ by LuxAlgo
3. ‘Volume Profile and Volume Indicator by DGT’ by dgtrd
The script is for informational and educational purposes only.
이 스크립트는 최근 일정 기간동안의 거래량을 가격 블록단위로 표시해 주는 볼륨 프로화일입니다.
좀 더 자세한 표현을 위해 차트상의 시간대보다 낮은 시간 프레임상의 OHCLV 값들을 호출하여 표현하였습니다.
낮은 시간 프레임은 조절 가능합니다..
보고 싶은 최근 일정 기간과 블럭 갯수를 조절할 수 있습니다.
트뷰 유료 사용자들을 위해 제공하는 지표와는 비교할 수는 없지만, 오픈 소스상에서는 찾기 힘든 거래량을 표시해 기능을 넣었습니다.
각 블럭에서 거래되었던 양 과 주어진 기간 동안의 총량 대비 퍼센트를 표시해 줍니다.
POC는 거래량이 가장 많았던 블럭의 중간값을 라인으로 표현해 줍니다.
TPOC는 거래량에 상관없이 가장 오랜 시간 머물렸던 블럭을 표현해 줍니다.
반전선은 블럭 단위로 상승 마감과 하락 마감의 거래량 우세를 결정한 뒤, 이웃 블럭들하고 다른 값을 가질 때 나타납니다.
(어떤 뜻을 갖고 만든 건 아니고 그냥 재미로 넣어 보았습니다.)
각 블럭에서 거래되었던 총거래량을 표현해 주며, 또한 설정창에서 상승 마감한 거래량과 하락 마감한 거래량을 표현하는 체크 박스가 있습니다.
각 블럭의 색깔을 지정하실 수 있습니다.
설정된 기간 동안의 최고값과 최저값, 각 블럭을 합친 총량을 박스 하단에 표시해 두었습니다.
어레이를 많이 사용하여 만들었기 때문에 값의 확인을 위해 전체 거래량을 따로 표시하였습니다.
가격 블럭을 거래량 퍼센트에 따라 표현할 때, 최소 픽셀이 1bar 이어서 섬세하게 표현 할 수 없어 안타까웠습니다.
박스 속성을 xloc.bar_time 로 설정하였지만 실제로는 1 bar가 X축 값의 최소 단위였습니다.
각 블록 별로 거래량을 배치 할 때 쓰인 로직은 다음과 같습니다.
1. 1 LTF bar의 하이 와 로우 값의 차이를 거래량으로 나누어 줍니다.
2. 각 블록 안에서 이 LTF bar가 차지 하는 비율을 구합니다.
3. 그 비율에 다시 거래량을 곱해 줍니다.
4. 그 값을 각 블록 셀에 저장해 줍니다.
밑에 제가 이번에 참고한 분들의 코드들입니다.
1. ‘Time & volume point of control (TPOC & VPOC)’ by quantifytools
2. ‘Volume Profile ’ by LuxAlgo
3. ‘Volume Profile and Volume Indicator by DGT’ by dgtrd

Volume profile zonesHi all!
This script calculates and shows the volume profile for the range of a higher timeframe candle. It then shows support or resistance (/supply or demand) zones based on the volume profiles with the most volume. The defaults are just my preferred settings so feel free to play with them! Also feel free to let me know about bugs and features. I already have a list of features to make, e.g.:
base on pivots
more info zone calculations, e.g. breaks and retests, virgin point of control etc.
add alerts
get rid of getPriceLevels()
get rid of _barVolumeProfile prefix
handle realtime
...
Best of trading luck!

Volume Analysis*Sourced code from Volume Flow v3 by oh92 for Bull\Bear volume flow calculations. Thank you so much for your engineering skills!
This indicator integrates the Ma-over-MA crossover strategy in oh92's V3 DepthHouse calculation with a volume-over-MA
calculation to further narrow down "Areas of Interest" levels for a potential re-test zone to the right of the chart.
I added a Moving Average calculation for a multi-level cloud and further broke down more conditions to highlight both
volume flow crossover on the High and Extreme High MA's and also high and extreme high volume spikes on set period average
without bull\bear conditions. Original Bull/Bear Spikes are still viewable although that was the only plot from oh92's script
that was integrated.
Session backgrounds set for research purposes.
Please note: Setting MA Cloud to "None" will remove all plots calculated with the MA Cloud from the chart entirely. Turn off visuals
in the Style tab.

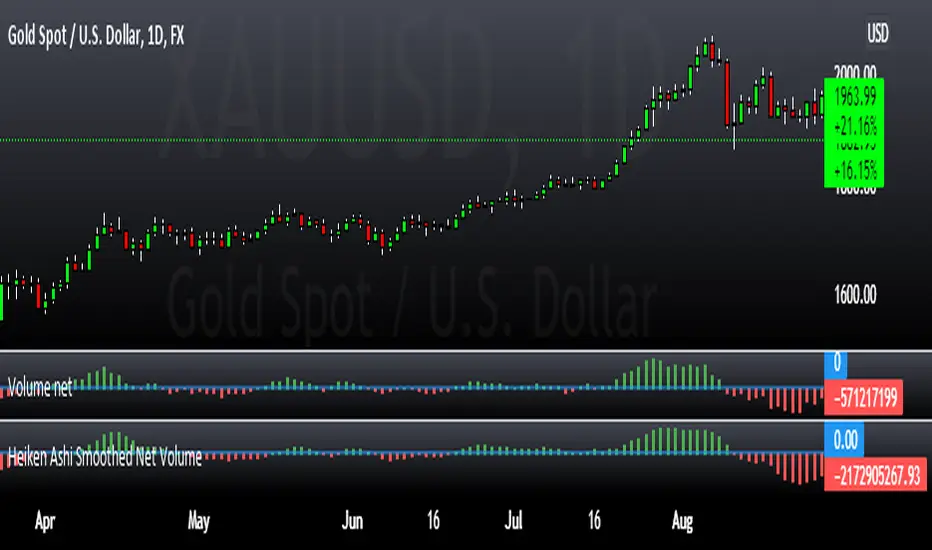
Heiken Ashi Smoothed Net VolumeThis indicator attempts to use Heiken Ashi calculations to smooth the Volume net histogram indicator by RafaelZioni. Long above zero line, short below zero line.
Candle Color by VolumeA simple but effective indicator that paints candles with different shades of colors based on the volume transacted.
-> Supports 6 levels of sensitivity at present. Might enhance the granularity later.
-> Darkest indicates the most volume transacted. Lightest, the least. Change it around however you see fit and based on your theme.
-> Use it for your Volume Spread Analysis and/or in conjunction with any other strategies that you employ.
-> Note that the volume ratio is calculated relative to the average volume of the last n candles ( EMA 20 by default).
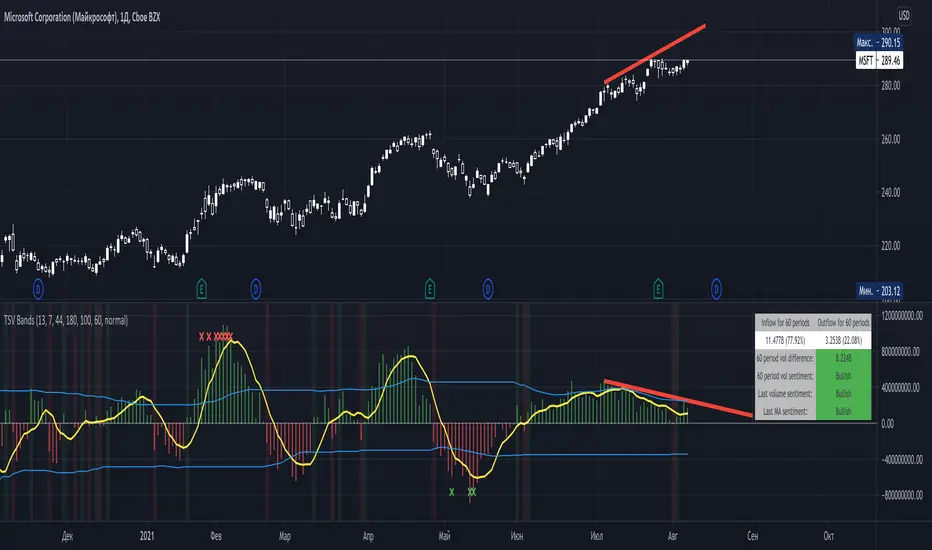
Time Segmented Volume BandsTime Segmented Volume Bands
This time I took as a basis TSV - Time Segmented Volume, a rather rare one, almost never mentioned on TradingView.
TSV is a leading indicator because its movement is based on both the movement of the stock price and its volume. Ideal entry and exit points are usually found when a stock moves through a baseline. This indicator is similar to the more well-known balance volume (OBV) because it measures the amount of money flowing in or out of a particular stock.
What is their main difference between TSV and OBV?
Time Segmented Volume is used to eliminate distortions of the standard volume graph. OBV is based on cumulative total volume, while TSV compares the current time period with the previous one, without a subtotal.
What I added on my own script
Bands, similar to Bollinger. The main idea is to have an idea of the average inflow and outflow of volumes from / to shares for a particular period. We have an opportunity to estimate how much the current volumes differ from the average for 60 days (all values can be flexibly adjusted).
Excess markers by the current average volume (sensitivity can be adjusted separately).
A table that calculates the total sentiment (force) of volume on average for N periods in comparison with the current one.
Sell/buy markers
How to read a TSV graph
The main graph is a histogram. Green bars mean an inflow of volume, red bars mean an outflow. When the red volume crosses the baseline zero, it is considered a buy signal (in the classic TSV version). A similar sell signal - just the opposite. I highlight them with a colored background fill.
It is especially important to find divergences on the chart. For example, when the volume peaks getting lower but the price rises (short).
The yellow line is the average TSV for 7 periods. Just a smoother lagging line.
Blue stripes. Above - the average inflow of volumes over N periods (44 days). Below - the average outflow.
Markers are additional buy / sell signals generated when the current TSV value exceeds the average for N periods. In the script settings, you can choose how many percent deviations from the average should occur in order to count it as a strong signal (by default, an excess of 180% for selling, 100% for buying). The main idea of the marker is to catch a better price than with the standard TSV logic (take at the intersection of the zero line). The marker can serve as both an assistant and drive into a trap. If you are not very confident, then it is better to adhere to standard practice, and set the excess of markers to completely abnormal situations, so that it triggers less often.
Colored background - a classic buy or sell zone (when crossing the TSV baseline).
Table - you can configure its presence and size in the settings. On it you can estimate the sentiment of the movement of money for the last N periods. Pay particular attention to the % value in parentheses. It shows the strength of the trend in volumes over N periods.
The basic rule, as with any trend indicator: do not trade against the trend. A sell signal in a constantly rising channel is not a short signal. This is a signal for a possible fixation of a part of the position. No more.
How do I use this indicator?
For starters, I never make decisions purely based on an indicator. TSV plays the role of a clearer visualization of volumes for me. If I see that the volumes are fading away (thin market), then I try not to enter the trade. For the last two weeks, while picking charts, I completely abandoned standard volume bars in favor of TSV due to it's greater informative.