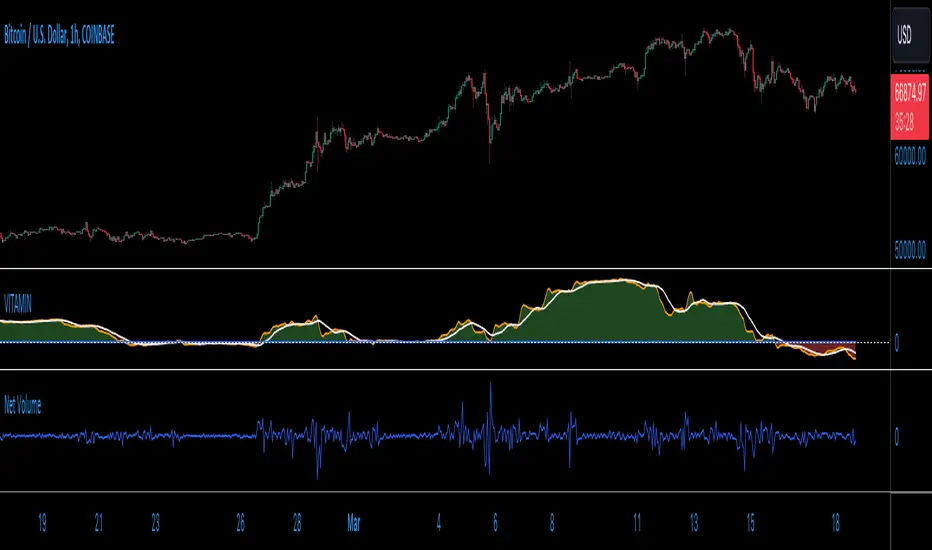
VITAMIN: Volume Insight Trend Analyzer - Multilayered INdicator)Meet VITAMIN, an indicator created mainly to function as a confirmation volume indicator to integrate into strategies as a signal filter, but it can also be used as a general-purpose indicator to enhance market analysis through volume trend insights.
The name was choses to help with recall, with VITAMIN short for "Volume Insight Trend Analyzer - Multilayered INdicator".
The indicator is grounded in the net volume calculation, using TradingView's built-in Net Volume indicator as a starting point, and taking as a series of simple Moving Averages based on the Net Volume data.
Core Features:
Multilayered Analysis: VITAMIN layers multiple moving averages on top of net volume—volume adjusted for price movement direction—to filter market noise and reveal clearer volume trends.
Foundation in Net Volume: The starting point is net volume, which combines volume magnitude with the direction of price changes, offering a baseline for momentum analysis.
Visual Trend Indicators: The indicator uses green and red shading between its moving average layers and a reference zero line to visually denote bullish (green) and bearish (red) volume trends, simplifying the interpretation of market sentiment.
Utility of VITAMIN:
Volume plays a crucial role in market analysis, but interpreting volume directly can be complex due to inherent market noise. Net Volume in particular features a great deal of noise, as a sequence of spikes and dips from bar to bar. My purpose with this indicator was to separate the signal from the noise. VITAMIN's multilayered moving averages provide a smoother, more interpretable trend line that distinguishes significant market moves from short-term fluctuations.
Applications:
Confirming Trends: VITAMIN can help validate price trends. A price uptrend paired with a bullish volume trend indicated by VITAMIN may reinforce the strength of the movement.
Identifying Divergences: Observing discrepancies between price trends and VITAMIN's volume trends can highlight potential reversals or continuations.
Assessing Market Sentiment: The overall trend and colour shading within VITAMIN aims to provide insight into market sentiment.
VITAMIN is designed for simplicity and effectiveness, aiming to provide deeper insights into volume trends, supporting more informed decisions.
Like any indicator featuring moving averages, and averages of those averages, there is a built-in lag to this indicator, but this is the trade-off for removing noise from the signal. Adjust the user inputs to suit your time frame.
在腳本中搜尋"volume"
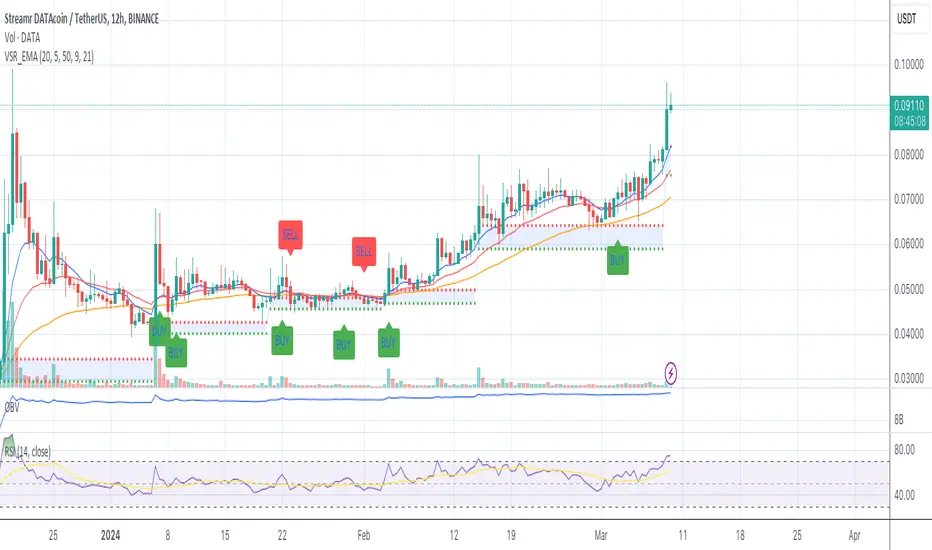
Volume Based S/R with EMA Crossover SignalsThis Pine Script indicator, titled "Volume Based S/R with EMA Crossover Signals," is designed for use on the TradingView platform and overlays on price charts to help traders identify potential buy and sell opportunities based on volume changes and EMA (Exponential Moving Average) crossovers. Let's break down its components for a detailed understanding:
Inputs
length: The number of bars used to calculate the standard deviation of the volume change. This parameter helps in identifying significant changes in volume over a specified period.
threshold: A multiplier applied to the standard deviation of volume change to determine significant spikes in volume, which are then used to identify support and resistance levels.
smoothLength: The length of the EMA used to smooth the price data, providing a clearer view of the overall price trend and helping to confirm trade signals.
fastEMALength and slowEMALength: The lengths of the fast and slow EMAs, respectively. These are used to generate crossover signals, where the crossing of the fast EMA over the slow EMA may indicate a potential entry or exit point.
Calculations
Volume Change and Standard Deviation: The script calculates the percentage change in volume from one bar to the next and then computes the standard deviation of these changes over the specified length. This process helps identify unusual volume activity, which can precede significant price movements.
Signal Generation Based on Volume: When the absolute value of the volume change divided by its standard deviation exceeds the threshold, it signals significant volume activity, potentially indicating strong support or resistance levels at previous highs or lows.
Smoothed Price: An EMA applied to the closing prices over smoothLength bars helps to confirm the trend direction and filter out noise.
EMA Crossover Signals: The script calculates two EMAs based on the fastEMALength and slowEMALength inputs. A crossover of these two averages generates potential buy or sell signals.
Logic for Buy/Sell Signals
Buy Signal: Generated when the price is above the identified support level (determined by significant volume activity), the fast EMA crosses above the slow EMA, and the price is also above the smoothed price. This confluence of conditions suggests upward momentum and potential buying opportunity.
Sell Signal: The opposite conditions generate a sell signal — when the price is below the identified resistance level, the fast EMA crosses below the slow EMA, and the price is below the smoothed price, indicating downward momentum and a potential selling opportunity.
Plotting
Support and Resistance Levels: Plotted as circles on the chart, with resistance levels in red and support levels in green, based on significant volume activity.
Smoothed Price and EMAs: The smoothed price line and both EMAs are plotted on the chart to help visually assess the trend and the crossover signals.
Buy and Sell Signals: Represented by shapes plotted on the chart, indicating the recommended trading action (buy or sell) based on the combined indicator logic.
Filling Between Support and Resistance: For visual clarity, the area between the identified support and resistance levels is filled, highlighting the range within which the price is expected to fluctuate.
This indicator offers a multi-faceted approach to trading, combining volume analysis with trend following via EMA crossovers. By identifying significant volume-based support and resistance levels and confirming trend direction with EMA crossovers and smoothed price trends, traders can make more informed decisions regarding entry and exit points. However, it's important to use this indicator as part of a comprehensive trading strategy, considering other factors such as market conditions, news, and technical analysis from other indicators.
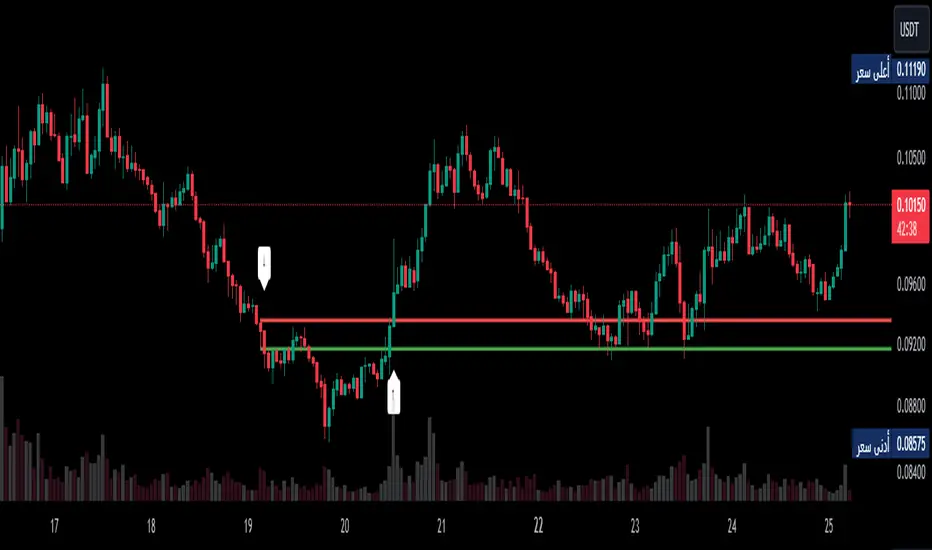
Volume-Based Reversal and Breakout [The_lurker]Indicator Overview:
The "Volume-Based Reversal and Breakout Indicator" is designed for use on the TradingView platform. Its primary function is to identify potential reversal candles using volume and price criteria and to mark significant breakout points. This tool is particularly valuable for traders who incorporate reversal patterns and volume analysis in their trading strategies.
Detailed Functionality:
Customizable Label Color:
Traders can choose the color of the labels that mark breakout points, allowing for personalization and better visibility on different chart backgrounds.
Volume Multiplier Input:
Users can set a 'Volume Multiplier' to define what constitutes significant trading volume. This multiplier is used to compare the current candle's volume with that of the previous candle. A higher volume on the current candle, as defined by this multiplier, is indicative of a significant trading activity.
Reversal Candle Criteria:
The script identifies a candle as a reversal candle if it meets the following conditions:
The closing price of the candle is lower than its opening price, indicating a bearish sentiment.
The trading volume of the candle is greater than the product of the previous candle's volume and the user-set volume multiplier. This implies increased trading activity during the formation of this candle.
The length of the candle's lower tail is greater than its body, suggesting a rejection of lower prices and potential bullish sentiment building up.
Breakout Identification and Marking:
Upon detecting a reversal candle, the indicator draws lines at the high and low of this candle.
These lines represent potential breakout levels. A breakout is confirmed if the price crosses above the high (indicating a bullish breakout) or below the low (indicating a bearish breakout) of the reversal candle.
When a breakout occurs, the indicator places an arrow marker at the breakout point. The direction of the arrow (upwards or downwards) and its color (customizable by the user) indicate the nature of the breakout.
Breakout Alerts:
The indicator includes an alert condition that notifies traders when a breakout occurs. This feature helps traders to quickly react to potential trading opportunities.
Practical Application:
The indicator is best used in markets with distinct volume patterns, as volume is a key component of its analysis.
It can be combined with other technical analysis tools, such as trend lines or moving averages, for additional confirmation of trading signals.
Traders should consider adjusting the volume multiplier based on the typical volume characteristics of the specific asset they are analyzing.
Conclusion:
This "Volume-Based Reversal and Breakout Indicator" is a robust tool that aids traders in identifying potential reversals and breakouts with an emphasis on volume analysis. It's customizable and alert-enabled features make it a versatile addition to a trader's toolkit, suitable for various trading styles and market conditions.
Disclaimer:
This indicator is provided "as is" without any warranties, either express or implied. The information and data contained within this indicator do not constitute investment advice or a recommendation to buy or sell any security. Users assume full responsibility for any trading decisions made based on the use of this indicator.
Past performance of indicators does not guarantee future results. Investing in financial markets involves risks, including the potential loss of capital. It is strongly advised to consult with a qualified financial advisor before making any investment decisions.
The development of this indicator does not constitute an endorsement or recommendation by TradingView or any other entity. All trademarks and trade names mentioned herein are the property of their respective owners.
Volume Profile with a few polylinesThe base of "Volume Profile with a few polylines" is another script of mine, Volume Profile (Maps) .
The structure of maps is used to gather the data. However, the drawings is done with polylines.
This enables coders to draw an entire volume profile with just a few polylines, while the range is broader.
This results in the benefit to draw more "lines" than with line.new() / box.new() alone.
🔶 CONCEPTS
🔹 Polylines
polyline.new creates a new polyline instance and displays it on the chart, sequentially connecting all of the points in the `points` array with line segments.
The segments in the drawing can be straight or curved depending on the `curved` parameter.
In this script, points are connected, starting from the bottom. The created line moves up until there is a price level where a volume value needs to be displayed,
at which the line goes to the left to the concerning volume value, coming back at the same price level until the line returns to its initial x-axis,
after which the line will continue to rise until all values are displayed.
A polyline can contain maximum 10000 points (10K).
Since the line has to go back and forth, each price/volume line takes 3 points.
In the case that 20K bars all have a different price, we would need 60K points, or just 6 polylines. A maximum of 100 polylines can be displayed.
The 3 highest volume values are displayed with line.new(), each with their own colour.
🔹 Maps
A map object is a collection that consists of key - value pairs
Each key is unique and can only appear once. When adding a new value with a key that the map already contains, that value replaces the old value associated with the key .
You can change the value of a particular key though, for example adding volume (value) at the same price (key), the latter technique is used in this script.
Volume is added to the map, associated with a particular price (default close, can be set at high, low, open,...)
When the map already contains the same price (key), the value (volume) is added to the existing volume at the associated price.
A map can contain maximum 50K values, which is more than enough to hold 20K bars (Basic 5K - Premium plan 20K), so the whole history can be put into a map.
🔹 Rounding function
This publication contains 2 round functions, which can be used to widen the Volume Profile
Round
• "Round" set at zero -> nothing changes to the source number
• "Round" set below zero -> x digit(s) after the decimal point, starting from the right side, and rounded.
• "Round" set above zero -> x digit(s) before the decimal point, starting from the right side, and rounded.
Example: 123456.789
0->123456.789
1->123456.79
2->123456.8
3->123457
-1->123460
-2->123500
Step
Another option is custom steps.
After setting "Round" to "Step", choose the desired steps in price,
Examples
• 2 -> 1234.00, 1236.00, 1238.00, 1240.00
• 5 -> 1230.00, 1235.00, 1240.00, 1245.00
• 100 -> 1200.00, 1300.00, 1400.00, 1500.00
• 0.05 -> 1234.00, 1234.05, 1234.10, 1234.15
•••
🔶 FEATURES
🔹 Volume * currency
Let's take as example BTCUSD, relative to USD, 10 volume at a price of 100 BTCUSD will be very different than 10 volume at a price of 30000 (1K vs. 300K)
If you want volume to be associated with USD, enable Volume * currency . Volume will then be multiplied by the price:
• 10 volume, 1 BTC = 100 -> 1000
• 10 volume, 1 BTC = 30K -> 300K
Polylines has the attributes curved & closed.
When "curved" is enabled the drawing will connect all points from the `points` array using curved line segments.
When "closed" is enabled the drawing will also connect the first point to the last point from the `points` array, resulting in a closed polyline.
They are default disabled, but can be enabled:
🔶 DETAILS
🔹 Put
When the map doesn't contain a price, it will be added, using map.put(id, key, value)
In our code:
map.put(originalMap, price, volume)
or
originalMap.put(price, volume)
A key (price) is now associated with a value (volume) -> key : value
Since all keys are unique, we don't have to know its position to extract the value, we just need to know the key -> map.get(id, key)
We use map.get() when a certain key already exists in the map, and we want to add volume with that value.
if originalMap.contains(price)
originalMap.put(price, originalMap.get(price) + volume)
-> At the last bar, all prices (source) are now associated with volume.
🔶 SETTINGS
Source : Set source of choice; default close , can be set as high , low , open , ...
Volume & currency : Enable to multiply volume with price (see Features )
Amount of bars : Set amount of bars which you want to include in the Volume Profile
🔹 Round -> ' Round/Step '
Round -> see Concepts
Step -> see Concepts
🔹 Display Volume Profile
Offset: shifts the Volume Profile (max. 500 bars to the right of last bar, see Features )
Max width Volume Profile: largest volume will be x bars wide, the rest is displayed as a ratio against largest volume (see Features )
Colours
Curved: make lines curved
Closed: connect last with first point
🔶 LIMITATIONS
• Lines won't go further than first bar (coded).
• The Volume Profile can be placed maximum 500 bar to the right of last price.

Volume Z-Score [SuperJump]Hello Guys.
I'm very very happy to release a new indicator after a really long time
The reason I created this indicator is, we often forget the importance of volume.
Volume is a signal of the start of a strong trend, and a very good example of how long a trend can continue.
Why do we forget the importance of trading volume?
Right, because we use a timeframe that is too small,
Most of the time we trade, the candles are largely free of volatility and low in volume.
So if we forget to check volume sometimes, no problem.
But when trading on a big trend, we can't ignore it.
I hope this volume indicator made using Z-Score will help you.
===========================================================================================
People sometimes call us gamblers.
They even accuse us of being unnecessary for the things we study with passion.
But I believe, we can definitely find a good meaning.

PriceCatch-Intraday VolumeHi TV Community,
Greetings to you.
This is a script that may be of use to intra-day traders. Knowing how much volume is getting traded and in which direction can help with decision-making in trading - especially when trading Futures.
So, this script, displays volume, number of candles and trades on intra-day time-frames.
FUTURES CHART
NOTE: The instrument must contain volume information for this script to work.
Number of trades will be accurate on Futures Chart because Volume / lot-size will give number of trades on a specific time-interval. For cash chart, please ignore this value.
Please use this script on Intra-day time-frame only.
Hope this script may be of use to you. All the best.
Comments/queries welcome.
PriceCatch
PS: As always with trading you and you alone are responsible for your actions and the profits/losses resulting from your trading activity.

Leveraged Share VolumeHello everyone,
Did this quick reference indicator and figured I would share it as nothing like it exists that I could find.
What this does is it pulls leveraged share data and displays the bull share and bear share volume.
There are 5 pre-programmed shares. These include:
SPY
Pulls bull share data from: SPXL and UPRO
Pulls bear share data from: SPXU and SPXS
IWM
Pulls bull share data from: TNA
Pulls bear share data from: TZA
DIA
Pulls bull share data from: UDOW
Pulls bear share data from: SDOW
QQQ
Pulls bull share data from: TQQQ
Pulls bear share data from: SQQQ
XLE
Pulls bull share data from: ERX
Pulls bear share data from: ERY
As there continues to be more leveraged shares available (for example, AAPU, APPD, MSFT, TSLA, etc.) there is also the option to use these manual tickers as these shares become available. The image below shows the data input screen:
The indicator will default to show the data as a ratio. The ratio is calculated by the total bear shares over the total bull shares (sell to buy ratio). If you unselect the Ratio option (displayed in the image above), it will show the raw volume.
When data is displayed as a ratio, you will see the white SMA line. This will show you the average ratio over a 14 period lookback. This is customizeable under the SMA Length input (shown in the image above).
Indicator's purpose:
The aim of the indicator is to provide context as to where the current sentiment is. Its similar in concept to a put to call ratio. The idea is, the more bearish people are, the more inverse shares are being bought, the higher the ratio or raw volume for bear shares and vice versa for bullish situations.
If you would like some more contextual information about the powers of tracking this type of data for trading purposes, you can check out this idea I published about the relationship between leveraged shares and market sentiment/behaviour:
Otherwise, the indicator is pretty straight forward!
Its not meant to be anything but a reference indicator to help give you context of the current market positioning.
If you have any questions or suggestions, please feel free to leave them below.
Thank you for reading and checking out the indicator!
Safe trades everyone!

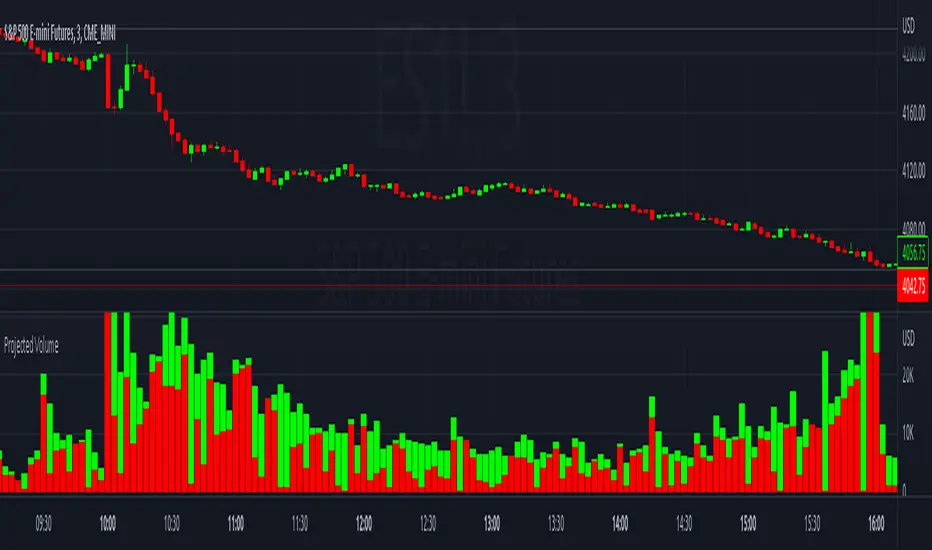
Projected VolumeThe indicator projects what each candle's final volume will be based on the amount of volume per second so far.
Options:
Disable Projected Volume: Show current volume Instead of projecting the final volume
Show Volume Pressure: Adds a visual representation of the volume from the candle wick that is moving against the current direction.
When Volume Pressure is enabled:
On a green candle:
The red part represents the upper wick, the volume as the price comes back down from its high
The green part represents the rest of the candle, the volume as the price goes up from its low to the close
On a red candle:
The green part represents the lower wick, the volume as the price comes back up from its low
The red part represents the rest of the candle, the volume as the price goes down from its high to the close
If Volume Bars Overlap with Chart:
By default, the volume bars are overlayed in the same chart pane as the candles, with the scale on the left side. If they overlap and interfere with the candles, you can fix with these options:
To move indicator to a new pane below the chart:
Select the indicator and click on the 3 dots "..."
Select Move To > New Pane Below
Select Pin to Scale > Pin to Scale A (this will move the scale to the right side)
To adjust volume bar scale:
Go to the scale on the left/right side, hold down the mouse and drag it up/down to make the volume bars longer/shorter
To move the entire volume block up/down on the chart, click on the volume bars and hold down the mouse, then drag it up/down
To update to the latest version, just close the indicator and add it again.
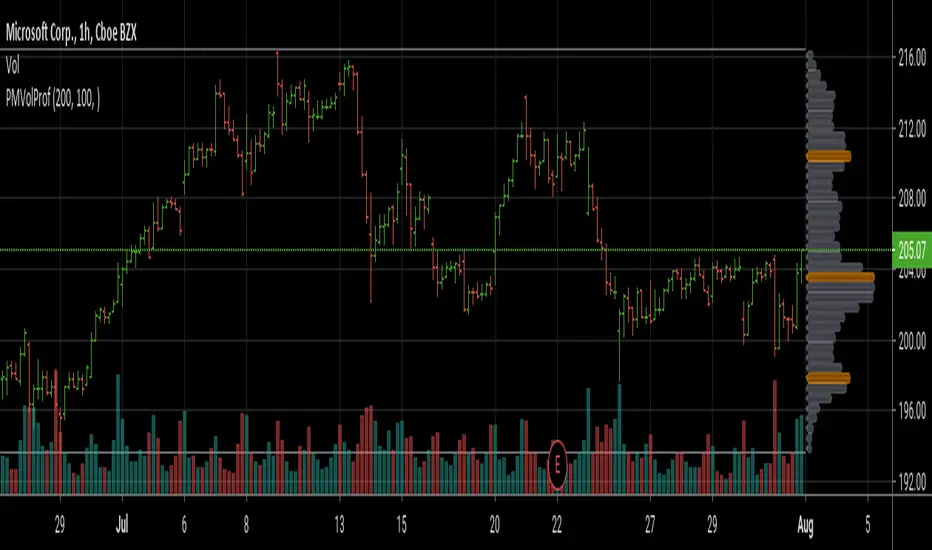
Volume Histogram [SpiritualHealer117]This indicator is a histogram produced with Pinescript's boxes and is helpful for spotting support, resistance, and key levels. The indicator shows the volume executed at each source price over a customizable time period. The "Key Level" in this indicator is the price at which the most volume was executed, and the "Major Levels" are levels where volume was over a percentile threshold, which you can customize in settings. Feel free to give any feedback on the indicator or make a copy for yourself!

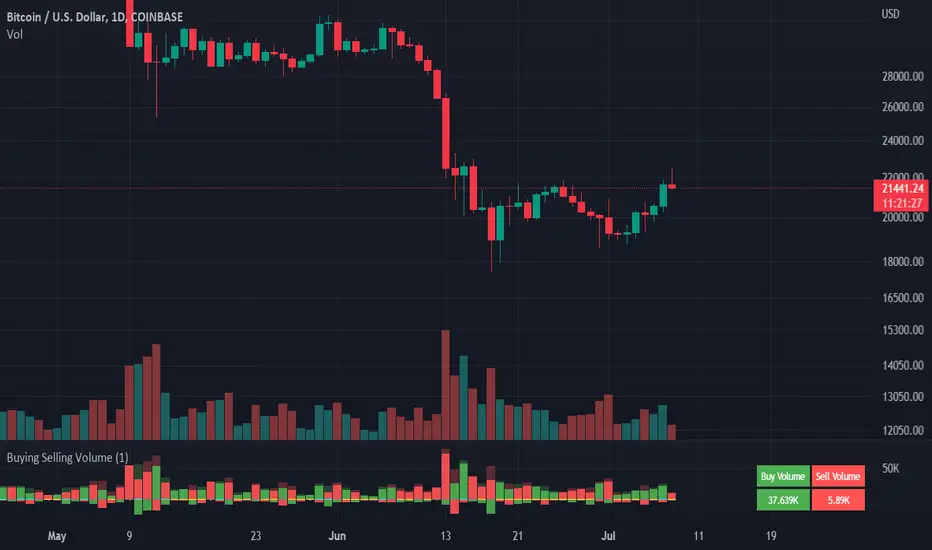
Buying Selling Volume v3Bug fixed from v2. Currently adds up values correctly.
Note: To get more accurate readings reduce the time frame. For some reason it isn't counting the last bar and I am not smart enough to figure out why.
Builds on Ceyhun's "Buying Selling Volume" indicator. This version allows users to define periods by effortlessly dragging two points or you may define periods by manually entering the start and end times in the settings window. Once the period is defined, both buying and selling volume will be totaled thus displaying the amount of buys and sells in that period.
I have found the information provided from the script helps in defining a period of consolidation as either being accumulative or distributive.
[blackcat] L1 Markos Katsanos Volume Flow IndicatorLevel 1
Background
Markos Katsanos’ volume flow indicator (VFI) calculation uses a default period of 130 days for daily charts. As a result, when applying the strategy, you will need to set the maximum number of bars the study will reference in the general tab of properties for all to at least 130. In order to compare the system objectively with the buy & hold results, he specified a trade size as a percent of equity.
Function
For more information see Markos Katsanos's articles in the June 2004 and July 2004 issues of Technical Analysis of Stocks & Commodities magazine. Period=days for VFI calculation. Default values are 130 for daily and 26 for weekly charts.Coef=coefficient for minimal price cut-of (use 0.2 for daily and 0.1 for intraday 5-15 min data) Vcoef=coefficient for volume cut-off (use 2.5 for daily and 3.5 for intraday charts)
Remarks
This is a Level 1 free and open source indicator.
Feedbacks are appreciated.

[MACLEN] VolumenTotal
With this indicator, it is intended to know the total volume of the market, adding the volume of the different exchanges in a single indicator.

Total VolumeThis simple indicator unifies the volumes of multiple exchanges/brokers. The idea of this indicator stems from the need to monitor the movements made by whales on other markets that can actually influence the price (manipulations, arbitrage, etc.).
Basically, we can:
* choose the number and symbols
* choose with which algorithm to merge the volumes (sum, average, weighted average, maximum)
* color the histogram (based on the dominant exchange, classic green/red color, no color)
Furthermore, there is a summary table which, in addition to indicating the volume for each exchange, also indicates the color attributed.
you can see the volume of the current exchange behind the volume obtained by the algorithm.
If you have any questions, doubts or suggestions please write to me.

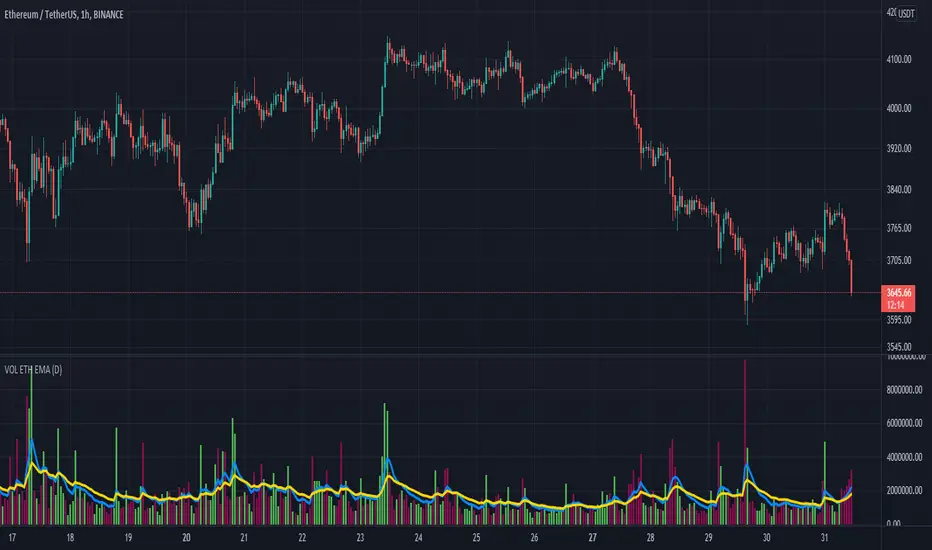
Performante's Average Ethereum Volume Indicator EMAThis indicator takes the volume from the biggest exchanges and plots the average volume. Exchanges incorporated in this average include Bitfinex, Coinbase, Bitstamp, Bitmex, Kraken, Binance, Bithumb, Flyer, OkEx, and CEX. The chart also has two Exponential Moving Averages (9-candle EMA & 21-candle EMA) added onto the volume pane to better understand relative volume. Thank you Julio and Mitch for this indicator
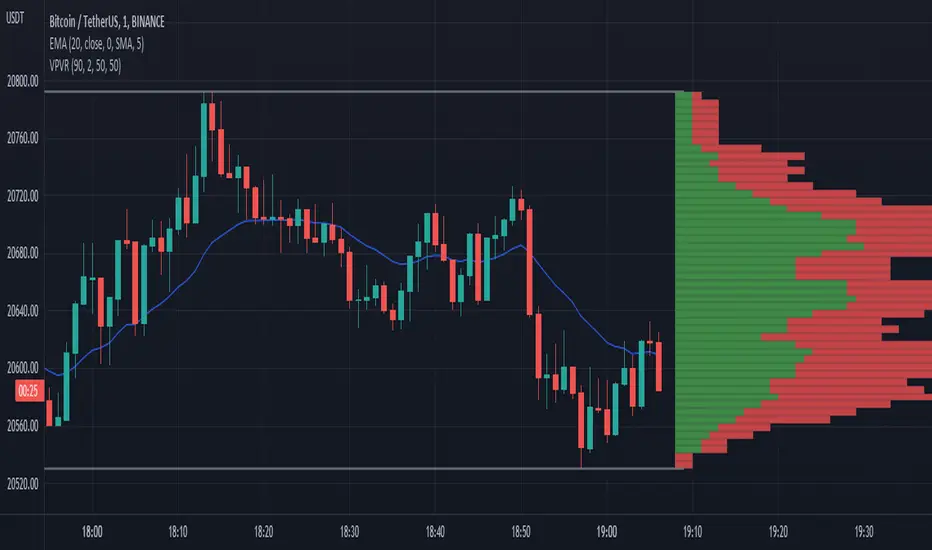
Fr3d0's Volume Profile Visible RangeLow level implementation
At the core of VPVR there’s a concept called “bucketization”.
Question : what is bucketization?
Answer : bucketization consists of identifying metrics with high predictive power and combine them appropriately.
I think this is a problem of bucketization because what the VPVR does is to take a price range, divide it into buckets and fill them up with the volume that was produced in each bucket’s range over the given period.
The more we divide our price range the finer the resolution, but also the less significant each bucket will become.
The steps are :
1. Get the price range with min and max over the give period;
2. Divide the range into buckets;
3. Loop over each candle of the given period and proportionally assign volume to one or more bucket.
Question : how to assign volume to buckets?
Answer : we need to calculate the right amount to add to each bucket for each candle. If 20% of a candle lies on a bucket then that bucket needs to have 20% of the volume of that candle, the rest 80% belongs to other buckets.
To get the percentage of a candle on a given bucket we have to find the price range of the candle contained within the bucket, then divide that amount by the entire length of the candle.
How to bucketize
Question : what are the formulas of A, B, C and Target respectively?
Answer :
- A = Max(candle_high, bucket_top) - Min(candle_low, bucket_bottom);
- B = Max(candle_high, bucket_top) - Min(candle_high, bucket_top);
- C = Max(candle_low, bucket_bottom) - Min(candle_low, bucket_bottom);
- Target = A - B - C.
Now that we now how to calculate the price range belonging to each bucket we need to calculate a percentage of volume to fill the bucket with.
The formula is trivially simple :
Volume * Target / (candle_high - candle_low).
Question : can we distinguish between buy volume and sell volume? If so, how?
Answer : yes we can and the following paragraph will teach you how.
Put it simply we can use the difference between the extremes of a candle (low and high) and its close price to get the buy and sell volumes.
The formulas for that are :
- Buy volume = Volume * (close - low) / (high - low);
- Sell volume = Volume * (high - close) / (high - low).
I know this is rather simplicistic but it makes sense.
Closing thoughts
This script is a working progress and I’m going to give more details if necessary, just let me know in the comments down below.
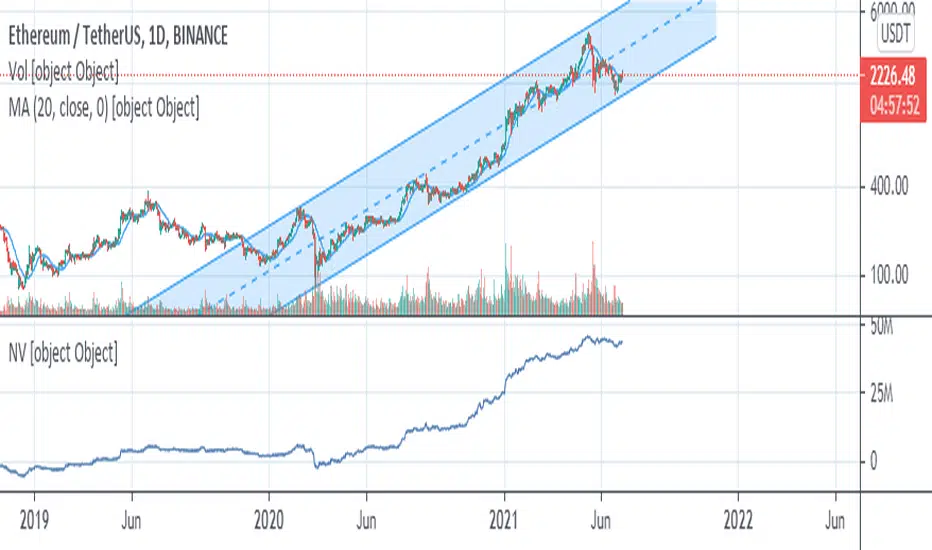
Net VolumeNet Volume, or NV in short, is a cumulative volume indicator similar to OBV and A/D. Though it might look similar to these two indicators (especially A/D), rest assured it's better and more accurate than both. What it basically does, is dividing the volume session into buyers and sellers volumes; then subtracts former from the latter and adds the result to previous session's net volume (In the script, these two intermediate volumes are not calculated and only the subtraction is formulated in an integrated form).
Another important difference between NV and A/D indicator, is that it brings price gaps into account. That's why it requires next session's open price to calculate current session's NV. What it actually mean is that the price gap, in either direction, is the result of the traders' efforts in respective direction in previous session, as if the current session closes where next session opens.
Close and Open for Volume Profile AnalysisThis script adds arrows to where Open and/or Close are.
It is usually better to study seasonal volume with candles off, yet it is worth knowing where the closing price is.

Poor man's volume profileThis is an attempt to get something more or less similar to the volume profile for free.
The code is generated using a template. To change the settings, you may need to regenerate the code. The code has a link to the repository with the template.
Renko Weis Wave VolumeThis is live and non-repainting Renko Weis Wave Volume tool. The tool has it’s own engine and not using integrated function of Trading View.
Renko charts ignore time and focus solely on price changes that meet a minimum requirement. Time is not a factor on Renko chart but as you can see with this script Renko RSI created on time chart.
Renko chart provide several advantages, some of them are filtering insignificant price movements and noise, focusing on important price movements and making support/resistance levels much easier to identify.
As source Closing price or High/Low can be used.
Traditional or ATR can be used for scaling. If ATR is chosen then there is rounding algorithm according to mintick value of the security. For example if mintick value is 0.001 and brick size (ATR/Percentage) is 0.00124 then box size becomes 0.001. And also while using dynamic brick size (ATR), box size changes only when Renko closing price changed.
This tool is based on the Weis Wave described by David H. Weis (a Wyckoff specialist). The Weis Waves Indicator sums up volumes in each wave. This is how we receive a bar chart of cumulative volumes of alternating waves and The cumulative volume makes the Weis wave charts unique.
If there is no volume information for the security then this tool has an option to use “True Range” instead of volume .
Better to use this script with the following one:
Enjoy!

Delta Volume Columns [LucF]Displays delta volume columns using intrabar volume information. Each volume column is divided into three sections: buying, selling and neutral volume. Volume for each section is determined from the volume and price movement of each intrabar at a user-selected lower resolution.
Features include:
- Choice of color themes for either dark or light chart backgrounds
- Delta volume columns
- Volume Balance displayed as the difference between the MAs of buying and selling volume
- Display of divergences between a bar’s volume balance and the bar’s price movement (example: buying volume > selling volume but close < open). Divergences can be shown in 2 different color schemes (including green/red showing a tentative direction), on volume columns and/or on chart bars
- Display of bar by bar volume balance with highlighting of above average volume
- Display of the usual total volume MA
- Choice of the lower resolution used to retrieve intrabar information
- Alerts configurable on any combination of the markers, with control over long/short direction
- Choice of 3 different markers:
1. Double bumps: two consecutive bars where buying or selling volume is in the same direction and where volume > volume MA
2. Divergence confirmations: direction of the price bar following a price/volume balance divergence
3. Volume balance shifts: zero level crossings of the volume balance MA delta
The chart shows the two main modes of display:
- Top pane : shows the stacked volume columns with divergences in orange and the flattened volume balance MAs delta at the bottom of the volume columns. This volume balance is the same shown in the bottom pane. The top pane also shows the instant volume balance strip above the volume columns. The strip’s colors show which of the buying or selling volume was greater, and colors are brighter if the total volume was above the total volume MA.
- Bottom pane : shows the volume balance MAs delta with markers 1 and 2. Given that this graphic has no price momentum component, I find quite eerie how it often looks like a momentum-based signal.
The default 5 minute intrabar resolution is used in combination with the weekly chart, which is excessive.
This script uses a special characteristic of the security() function’s behavior when it is sent to a resolution lower than the chart’s resolution. Details are given in the script’s comments. This method has the advantage of working under more circumstances than some of the other loop-based methods, but it also has its limits.
IMPORTANT
This is what you need to know:
- The method used does not work on the realtime bar—only on historical bars. Consequently, the volume column shown on the realtime bar is a normal volume column plotted in green or red, following price movement. The column will only show delta volume information after it closes and becomes a historical bar.
- The indicator only works on some chart resolutions: 5, 10, 15 and 30 minutes, 1, 2, 4, 6, and 12 hours, 1 day, 1 week and 1 month. The script’s code can be modified to run on other resolutions, but chart resolutions must be divisible by the lower resolution used for intrabars.
- Intrabar resolutions can be selected from 1, 5, 15, 30, 45 minutes, 1, 2, 3, 4 hours, 1 day, 1 week and 1 month. The intrabar resolution must of course be smaller than the chart’s resolution.
- Contrary to my other indicators where alerts must be configured to trigger “Once Per Bar Close” in order to avoid false triggers (or repainting), all this indicator’s alerts are designed to trigger using previous bar information since the indicator’s calculations in the realtime bar are not exact. Markers are not plotted with a negative offset; they appear at the beginning of the realtime bar following confirmation of the marker’s condition on the previous bar. Alerts for this indicator should thus be configured to trigger “Once Per Bar” so they trigger at the beginning of the realtime bar. Note that the penalty is not that great, as it is simply the instant between the close of the previous realtime bar and the opening of the next. The advantage of using this technique is that the indicator does not repaint; a marker that appears at the beginning of the realtime bar will never disappear.
- The script only plots information that is reliable in the realtime bar, i.e., total volume and markers. All other plots are set to n/a to prevent misleading traders.
- When the difference between the chart’s resolution and the lower resolution is too important, volume columns will not calculate for all bars in the dataset.
On Delta Volume
Buying or selling volume are misnomers, as every unit of volume transacted is both bought and sold by 2 different traders. There is no such thing as “buy only” or “sell only” volume, but trader lingo is riddled with original fabulations.
Without access to order book information, traders work with the assumption that when price moves up during a bar, there was more buying pressure than selling pressure. The built-in volume indicator available on TradingView uses this logic to color the volume columns green or red. While this script’s numbers are more precise because it analyses a number of intrabars to calculate its information, it uses the exact same imperfect logic to calculate its buying/selling/neutral sections.
Until Pine scripts can have access to how much volume was transacted at the bid/ask prices, our so-called buying/selling volume information will always be a mere proxy.
Divergences
You may wonder how there can be divergences between buying/selling volume information and price movement. This will sometimes be due to the methodology’s shortcomings we have just discussed, but divergences may also occur in instances where because of order book structure, it takes less volume to increase the price of an asset than it takes to decrease it.
As usual, divergences are points of interest because they reveal imbalances, which may or may not become turning points. I do not share the overwhelming enthusiasm traders have for divergences. To your pattern-hungry brain, the orange bars this indicator shows on chart will—as divergences on other indicators do–appear to often indicate turnarounds. My opinion is that reality is generally quite sobering, as many who have tried building automated rules based on divergences will tell you. I do not have hard numbers on the lack of performance of divergences—only many failed attempts to make them perform, which a few experienced strategy modelers I know share with me. Please don’t try to read too much into them. While they look great on past data, I find they are often difficult to use in realtime to make bets with good odds.
Thanks to:
- A guy called Kuan who commented on a Backtest Rookies presentation of an intrabar delta volume indicator using a for loop. The heart of “my” indicator is code borrowed from Kuan; I just built a hopefully useful wrapper around it.
- @theheirophant, my partner in the exploration of the sometimes weird abysses of security() ’s behavior at lower resolutions.

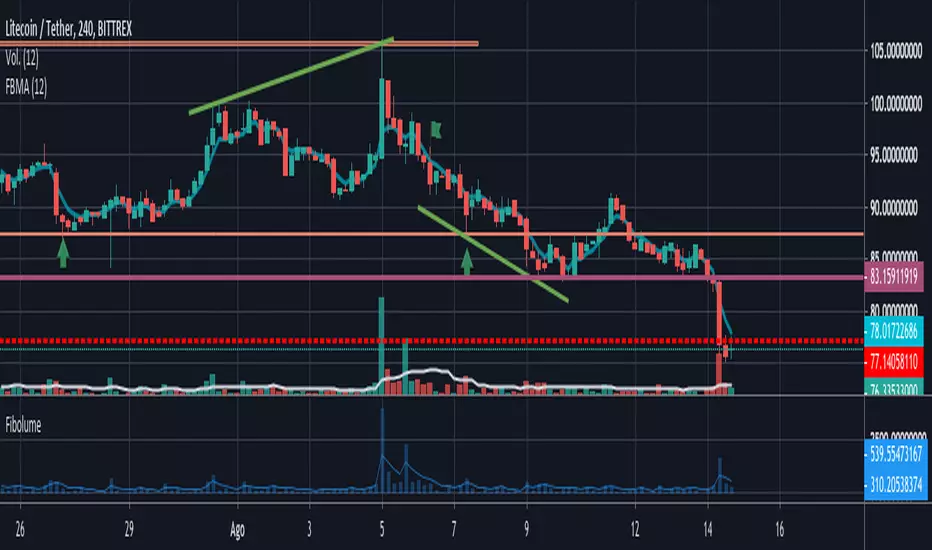
Fibonacci Volume Average FIBOLUMEEl gráfico de volumen por defecto determina el promedio del volumen asignando el mismo peso o importancia a los volúmenes del rango de días, con FIBOLUME se asigna un peso o importancia mayor y de forma incremental a los últimos precios y asignando menos pesos o importancia a los mas antiguos. en algunos casos un gran volumen de un día afecta mucho el promedio de otros días con un volumen menor no devolviendo un dato real del comportamiento del mercado a lo largo del rango de fechas
Volume Adaptive BandsIntroduction
I have been asked by @Coppermine and @Verbena to make bands that use volume to provide adaptive results. My first approach was to use exponential averaging, in order to do so i needed to quantify volume movement using rescaling with the objective to make the bands go away from each others when there is low volume, this approach is efficient and can work on any time frame, however i decided at the end to use another method which rely on recursive weighting, cleaner but more parametric. Those bands aim to highlight great breakouts point to go with the trend.
The Indicator
length control the period of the moving averages used in the script, however low length's don't necessarily provide indications for shorter terms breakouts as shown here :
As i said the bands are close to each others when there is high volume and away when there is low volumes.
Low volume period, bands will avoid to cross price
High volume, bands will be close to generate signals.
Correction Factor
Higher time frames will lower the distance between each band, this is because volume is higher during higher time frames, remember that the indicator bands are close to each others when volume is high.
1h chart eurusd.
This is why i added a correction factor, this factor can help you control the distance between each bands, when the correction factor is greater than 1 the bands will be closer to each others, this is useful for low time frames where the average volume is lower. When the time frame is high, use values between 0 and 1 to increase distance between each bands.
Correction factor = 0.2
Conclusion
I presented a new adaptive band indicator that adapt to trading volume by using recursive weighting, volume can be replaced by other indicators but you can have results going nuts, at the end its about experimentation. I hope you will find an use to it, thanks to @Coppermine and @Verbena for the request :)
Thanks for reading !

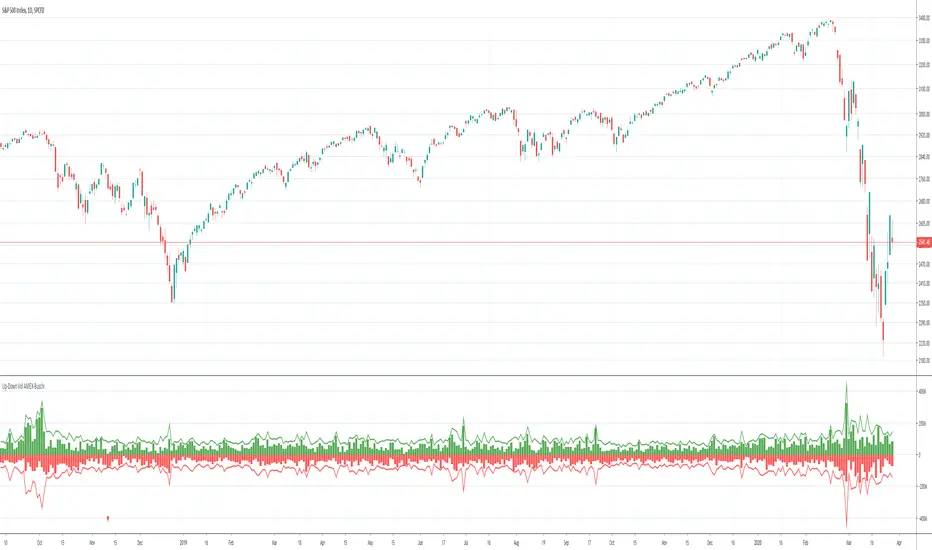
Up-Down Volume AMEX-Buschi
English:
This indicator shows the AMEX's up volume (green) and down volume (red).
Extreme trading days with more than 90 % up or down volume are marked via lines (theoretically values) and triangles (breaches).
Deutsch:
Dieser Indikator zeigt das Aufwärts- (grün) und Abwärts-Volumen (rot) der AMEX.
Extreme Handelstage mit mehr als 90 % Aufwärts- oder Abwärts-Volumen ist gekennzeichnet über Linien (theoretische Werte) und Dreiecke (Überschreitungen).