Volume MédioEsse script cria uma temperatura no volume comparando ele com o seu valor médio, assim se o volume é muito menor que a média, ele fica frio, ou seja, azul escuro, e conforme aumenta vai ficando com cores mais quentes
在腳本中搜尋"volume"

UP & DOWN VOLUMEIndicator draws UP & DOWN VOLUME for both NYSE and NASDAQ - just choose the appropriate exchange in settings.

High Volume BarsThis script colors bars whenever their volume has exceeded more than a standard deviation (or multiples of it) from a given amount of bars in the past.
Volume is commonly used as confirmation for a break of a significant level, or as indicative of offside positions when a level fails to be defended. Conviction or Excess, depending on the context.

Customizable Volume DetailsThis script allows you to gain insight into volume such as differentiating between buy and sell volume, 30 day average, 30 bar average, and more.

Volume Zone Oscillator (VZO)My interpretation of Walid Khalil's Volume Zone Oscillator (VZO) as published in the 2009 International Federation of Technical Analysis Journal.
This VZO indicator is also the same as Danielle Shay's popular Simpler Trading TurboVZO indicator.
ABOUT:
The oscillator breaks up volume activity into positive and negative categories. It is positive when the current closing price is greater than the prior closing price and negative when it's lower than the prior closing price. The resulting curve plots through relative percentage levels that yield a series of buy and sell signals, depending on level and indicator direction.
HOW TO USE THE INDICATOR:
The default period is 14 but can be adjusted after backtesting.
The VZO points to a positive trend when it rises above and maintains the 5% level, and a negative trend when it falls below the 5% level and fails to turn higher. Oscillations between the 5% and 40% levels mark a bullish trend zone, while oscillations between -40% and 5% mark a bearish trend zone. Meanwhile, readings above 40% signal an overbought condition, while readings above 60% signal an extremely overbought condition. Alternatively, readings below -40% indicate an oversold condition, which becomes extremely oversold below -60%.
Kahlil recommends confirming VZO signals with a 14-period average directional index (ADX), with values greater than 18 pointing to a trending market - search Tradingview's built-in indicators for the Directional Movement Index (DMI).
INTRADAY SCALPING:
Whilst the VZO is already smoothed with an exponential moving average, the indicator settings include an additional 'smoothing' function to remove any excess 'noise' in the plots for intraday use.

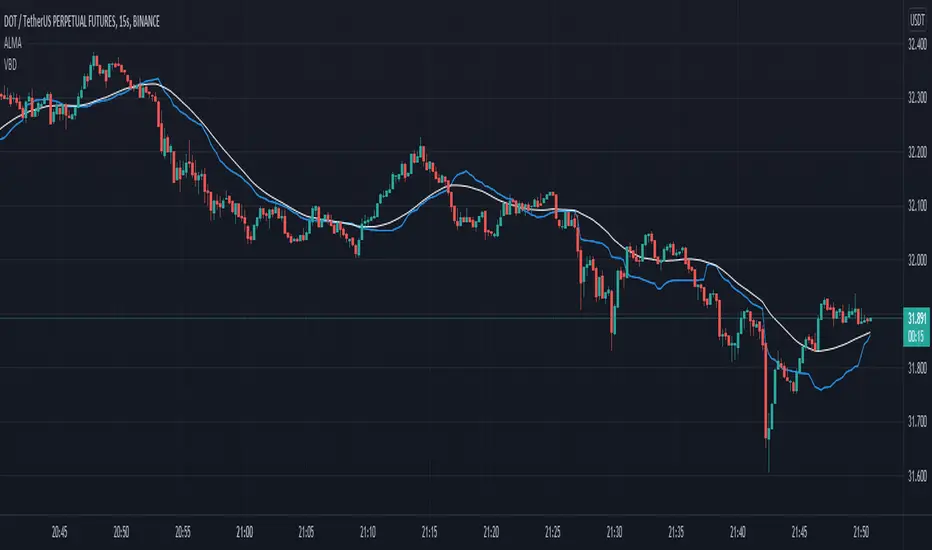
Volume Based DonchianA simple experiment that mixes volume and Donchian's algorithm.
In this version I have implemented a more elegant version of the formula, using the VWMA function instead of spelling out the steps.
I have kept both formulas for educational purposes.
I also plot an Alma Moving Average, how you can see a 16 periods Volume Based Donchian is pretty similar to a 80 period Alma. I think it could be nice stuff if you wanna ask me something write me.
Volume-based Support & Resistance ZonesThe new and improved Support & Resistance Zones indicator is here. This indicator is based on high volume at fractal lows or fractal highs with the zones based on the size of the wick for that timeframe’s candle.
This helps traders visualize which price levels are of the most significance for either reversals or continuation of the trend when zones are broken and then re-tested.
Original script is thanks to synapticex and additional modifications is thanks to Lij_MC. Credit to both of them for most of the logic behind this script.
Since then I have made many changes to this script as noted below:
Changed default S/R lines from plots to lines, and gave option to user to change between solid line, dashed line, or dotted line for both S/R lines.
Added additional time frame and gave more TF options for TF1 other than current TF. Now you will have 4 time frames to plot S/R zones from.
Gave user option to easily change line thickness for all S/R lines.
Made it easier to change colors of S/R lines and zones by consolidating the options under settings (rather than under style).
Added extensions to active SR Zones to extend all the way right.
Added option to extend or not extend the previous S/R zones up to next S/R zone.
Added optional time frame labels to active S/R zones, with left and right options as well as option to adjust how far to the right label is set.
Fixed issue where the higher time frame S/R zone was not properly starting from the high/low of fractal. Now any higher time frame S/R will begin exactly at the High/Low points. Note that this may not work perfectly on stocks and if a fractal high/low is too many bars in the past, it will revert to a default max bars back to avoid script errors.
Added to script a function that will prevent S/R zones from lower time frames displaying while on a higher time frame. This helps clean up the chart quite a bit.
Created arrays for each time frame's boxes and lines so that the number of S/R zones can be controlled for each time frame and limit memory consumption.
New alert options added and customized alert messages.
- The way this indicator works is it looks for fractal highs or fractal lows with volume that pierces above the volume's Moving Average. This moving average value can be modified in the settings for each time frame.
- The fractal highs will be confirmed with 3 successive higher highs followed by 2 successive lower highs and vice versa for the fractal lows.
- The zone is created from the fractal high/low and the close of the candle for whatever time frame you selected. The bigger the zone, the more significant that zone is.
- You can disable any zone, change the zones to show lines only, and modify all the colors, transparencies, and thickness of lines for all the zones.
- To create alerts, you first want to enable the types of alerts you want for each time frame in the indicator's settings. Then after you apply changes, right click on one of the zones on the chart, and click "Add Alert on Vol S/R Zones". You do not need to add a title as the correct alert messages are already built-in.
- More changes will be coming in the future!
I hope you find this indicator useful, if so please give it a thumbs up!
If you have any suggestions or features you would like to see, just let me know in the comment section. Thanks and enjoy!

Illuminati VolumeIlluminati volume, indicatore scritto e pensato da Francesco La Via .
Questo indicatore utilizza i contratti e il prezzo per determinare le reale liquidità presente nel mercato.
Può essere usato:
Divergenze
Profile volume
Tendenze
Supporti e resistenze
Forza
L'indicatore a Time-Frame 1 minuti indica la quantità di Fiat che si sta muovendo, se è positiva sta entrando liquidità, se è negativa sta uscendo liquidità.
A time-Frame "grafico" indica la forza psicologica di ogni candela.
Il risultato dell'indicatore nel forex deve essere moltiplicato per la quantità di fiat per contratto, ad esempio EURUSD*100.000.

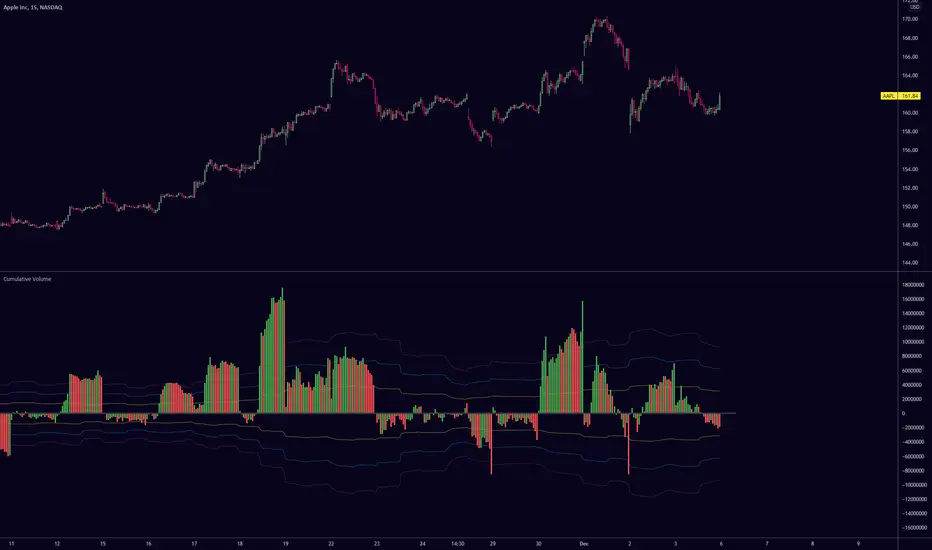
Cumulative VolumeCumulative Volume oscillator with Bollinger bands. Resets with each new day. Based on cumulative tick.
Enjoy!
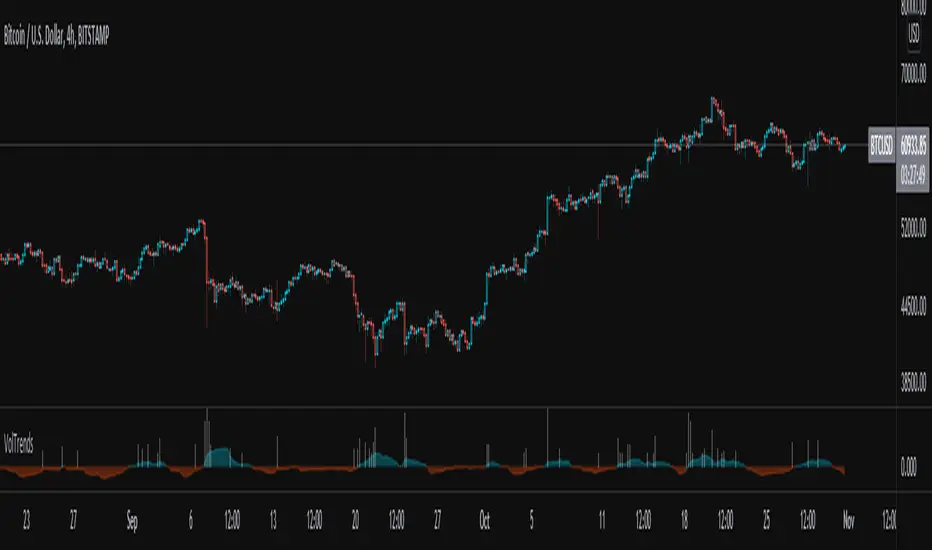
Volume TrendsThis script provides clear volume trends on any time frame. You set a long term volume trend moving average (ex 100 periods). A shorter term MA of your choice (10 in this example) will oscillate above and below based on the standard deviations of its current value relative to the long term #.
Similarly, large volume bars are plotted in terms of st dev above the long term MA.
Very useful in spotting capitulation bottoms and/or blow-off tops.
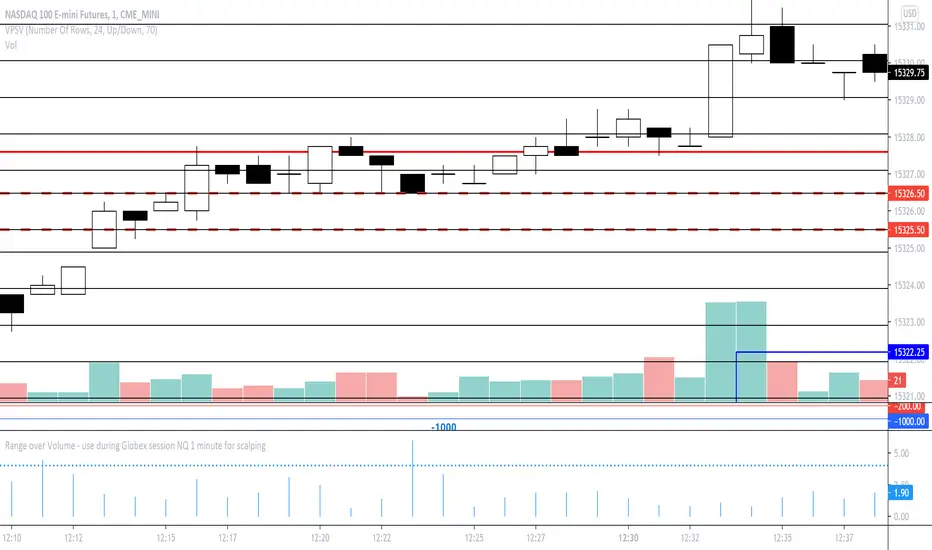
Range over Volume This is a scalping aid for NQ in the 1 minute time range for the Globex session.
Mathematically, the plot is range in ticks divided by 0.1*volume
This returns a histogram plot for RoV (range over volume)
The idea is that candles that ascribe a larger range with minimal volume does because there is unilateral aggression from the buy side, or sell side, and the subsequent behavioural outcome of this will either be an extension of that aggression unilaterally, or commonly, a counter to that aggression!
Wait for a candle to close with the RoV above 4.00. For that candle which formed the RoV above 4.00, plot the highs and lows of that candle and draw a 1.618x and -0.618x Fibonacci extension across it.
Enter short on the -0.618x and take profits at the -1.618x. Use the low of the ROV > 4 candle as a protective stop
Enter long on the 1.618 and take profits at 2.618. Use the high of the ROV > 4 candle as a protective stop
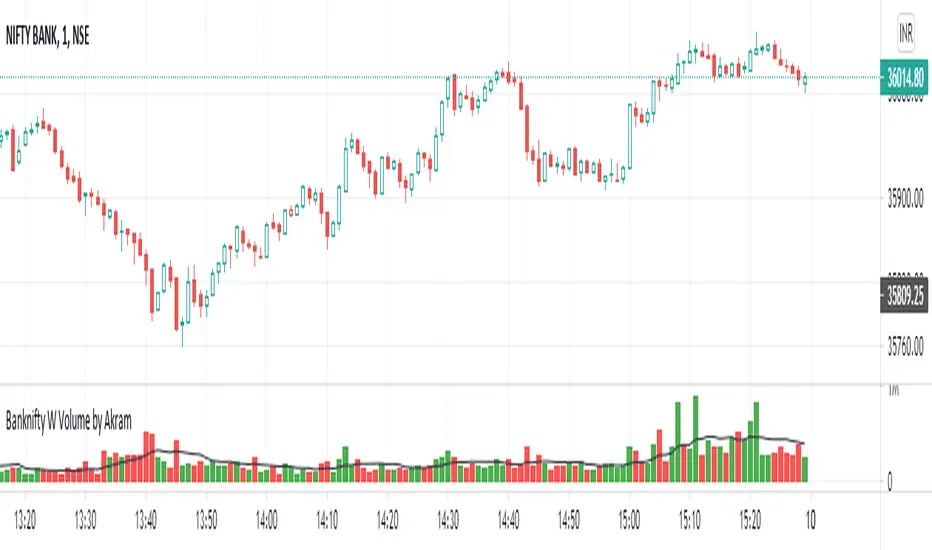
Banknifty Weighted volume by AkramulBanknifty Weighted volume as per share ratio.
HDFC Bank – 27.56%
ICICI Bank – 22.91%
State Bank of India (SBI) – 12.42%
Kotak Mahindra Bank – 11.77%
Axis Bank – 11.49%
IndusInd Bank – 5.20%
AU Small Finance Bank Ltd. – 2.35%
Bandhan Bank – 1.73%
Federal Bank – 1.53%
IDFC First Bank Ltd. – 1.22%
Punjab National Bank (PNB)- 1.03%
RBL Bank – 0.79%
and moving average plotted on volume
Volume Prism RibbonNASDAQ:SPWR
The purpose of this script is to give insight into the volume action. The relative volume is calculated (based on 400 ticks) with the volume of down days (close-close <0) being given a negative value. This function is then summed over 100 ticks. WMA's are used to generate a rainbow ribbon who's color order is easily recognized buy all of us. Watch and Warning points are added using crossover points. I find it to be a good supplement to my favorite Buy/Sell indicator. In addition to the wrapping of the ribbon, pay attention to where the zero line is as well.

Aggregated Volume Colored (Bitcoin, ETH, Altcoins, everything)BITSTAMP:BTCUSD
This indicator aggregates trading volume data of up to 10 symbols and can display the individual data by color.
It is useful for assets which are traded on multiple exchanges, like cryptocurrencies, commodities, forex and derivatives showing you what is happening across the market and on the individual exchanges to give you beter insights.
You can change the symbols from which the indicator gathers data in the settings under inputs, just like the colors, and you can add a moving average.
By default trading volume is aggregated from the following symbols:
Binance, BTC /USDT
Binance, BTC /BUSD
Bingbon, BTC /USD
Huobi, BTC /USDT
OkeX, BTC /USDT
Coinbase, BTC /USD
Bitfinex, BTC /USD
Gemini, BTC /USD
Kraken, XBT/USD
Bitstamp, BTC /USD

Equivolume Overlay - Volume BarsThis is an addon for displaying volume bars along with Equivolume bars which can be found here

Relative Volume Screener AlertsThis script will screen 12 different stocks and current chart (13 in total) for entry points from my relative volume indicator.
1. Enter in any ticker ID's from charts you wish to scan in the settings.
2. Go to desired timeframe.
3. Click add alert button at top toolbar.
4. Select RVOL Screener Alerts indicator, input alert notification settings and/or change alert name and click create.
The script will then scan the stocks and alert you of any entry points from the timeframe you set the alerts.
A new alert needs to be created for each timeframe you wish to screen.
You can find my relative volume indicator here:
