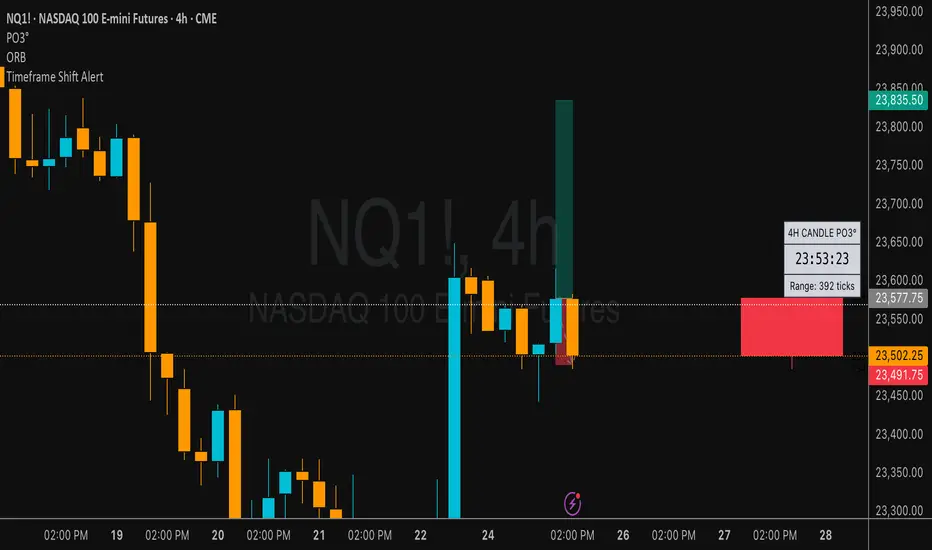
Timeframe Shift AlertIf the higher timeframe flips bullish, you’ll get a notification like:
“✅ Higher TF (240) just flipped from Bearish → Bullish”
• If it flips bearish, you’ll get:
“❌ Higher TF (240) just flipped from Bullish → Bearish”
Statistics
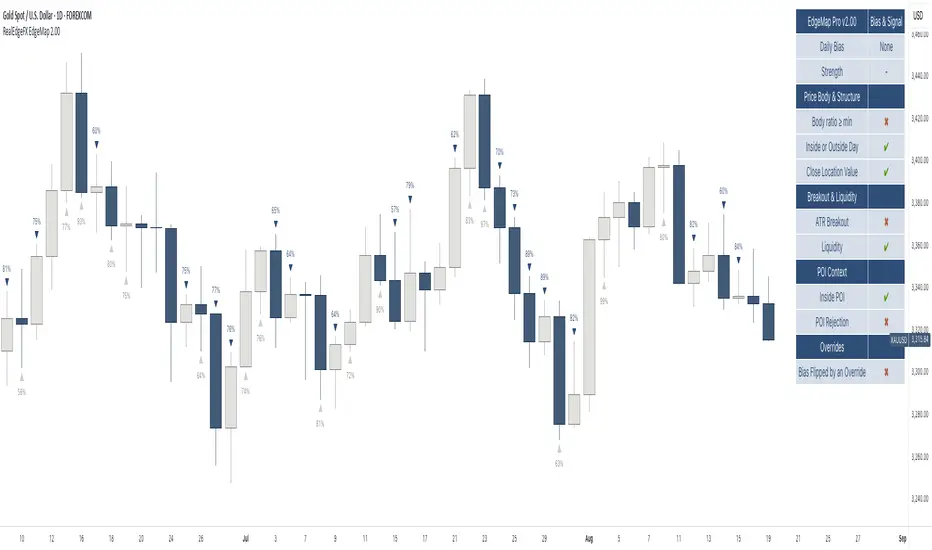
RealEdgeFX EdgeMap ProPresentation
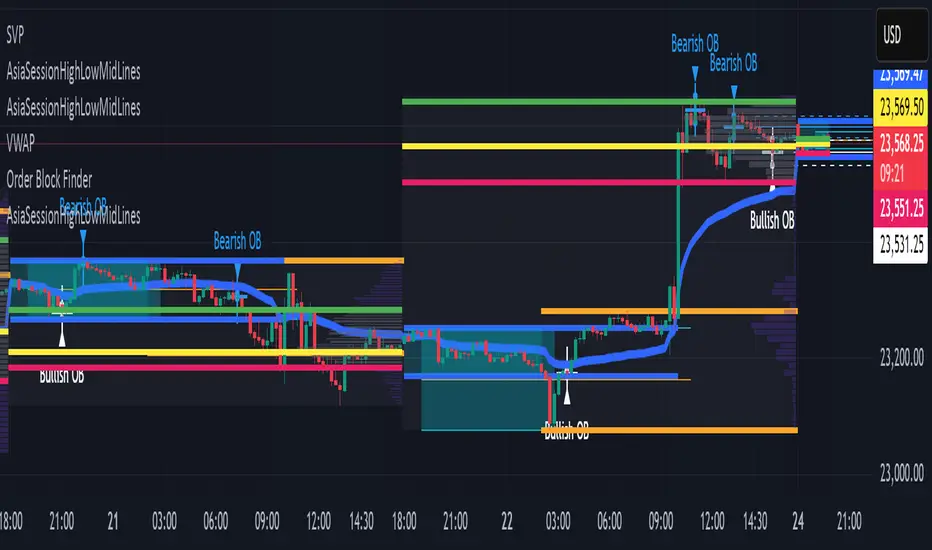
RealEdgeFX EdgeMap Pro is built for systematic intraday decision-making. It combines a rule-based Daily Bias engine with an intraday (1-hour) regime engine based on medium timeframe engulfing (a structure change where a new directional run overwhelms the prior one). The study continuously evaluates candlestick behavior, session-level displacement, previous-day range interaction, and clearly defined points of interest (price areas left by sharp moves that often act as magnets or rejection zones). Intraday highs/lows inside an active regime are updated in real time on lower timeframes, so levels expand tick-by-tick when price makes new extremes.
Description
RealEdgeFX EdgeMap Pro is built on the idea that price alternates between contraction and expansion. Expansion begins when price drives in one direction with conviction. The study blends higher-timeframe daily context with a confirmed 1-hour structure shift called ME (Medium timeframe engulfing)—the moment a fresh run closes beyond the opening level that began the previous opposite run. From that confirmation forward, the active range’s high and low are maintained in real time on lower timeframes, expanding tick-by-tick whenever price prints new extremes. The tool also marks points of interest derived from zones where the price usually reacts following the 1h order flow context. Only the most relevant, side-aligned area is shown, and it is removed as soon as price trades decisively through it.
The engine outputs a Buy/Sell/Neutral stance and a 0–100 strength score. The definitive rules are the ones displayed in the on-chart table: the bias is produced when at least three of those criteria are active, or when a rule-based override flips the stance. Strength is calculated from the same table and increases with the number and intensity of active checks.
Tools
- Daily Bias & Strength (table-driven): Produces a Buy/Sell/Neutral bias and a 0–100 strength score for the day. The decision follows the rules shown in the on-chart table; the bias is set when at least three table criteria are active, or when a rule-based override flips it. Strength scales with how many checks are active and how strong they are.
- Medium-Timeframe Engulfing (ME) on 1-Hour: Detects a confirmed 1-hour structure shift when a new move closes beyond the opening price that started the prior opposite move. From that moment, the active range’s high/low is maintained in real time on lower timeframes, expanding tick-by-tick as new extremes print. A 1-hour close through the invalidation clears the ME and its dependents.
- Points of Interest (POI): Marks areas created by a distinct three-candle move on the 1-hour chart where the middle bar’s range does not overlap the bar from two candles earlier, or the initial candle that produces the Medium-Timeframe Engulfing. Only POIs formed after the current ME begins and lying inside the active ME range are eligible. Overlapping same-side areas merge; only the nearest, side-aligned POI is shown and it is removed once price trades decisively through it.
- ME-Based Fibonacci Levels: Draws three live reference lines tied to the active ME range—100% at the active extreme, 50% at the midpoint, and 0% at the opposite extreme. These levels extend forward, update in real time as the ME range grows, and hide automatically when no valid ME is active.
- Intraday Visuals: On the first bar of each new trading day (on intraday charts), prints an up/down arrow reflecting the current Daily Bias and a clean text label with its strength. Sizes and colors are configurable to keep the chart readable.
- On-Chart Diagnostic Table: Displays the exact rules used to build the Daily Bias and Strength, broken down by sections (Price Body & Structure, Breakout & Liquidity, POI Context, Overrides). A check mark means the criterion is currently contributing; this table is the single source of truth for the engine’s decisions.
What can you customize?
- ME Level & Label (Medium-Timeframe Engulfing): Choose line style (solid, dashed, dotted), line width, and separate colors for bullish and bearish levels. Set the label text (e.g., “ME”), its color, and size. Control how far the line/label project forward in time. Once a 1-hour close invalidates the setup, the ME line and label are removed automatically, keeping the view clean.
- POI Areas (Points of Interest): Toggle on/off. Pick separate fill colors for bullish/bearish areas, adjust transparency, and set border color, width, and style. Define how far each area extends forward. Only the most relevant, side-aligned area is shown; when price closes decisively through it, the box is cleared to avoid clutter.
- ME-Based Fibonacci Levels (100/50/0): Toggle the three reference lines, and customize each level’s color, width, and style. Turn labels on/off and set label text size and color. Control forward extension so levels project the way you prefer. Levels auto-update in real time as the ME range expands and hide when no valid ME is active.
- Intraday Day-Change Arrows & Strength Labels: Select arrow size (Tiny, Small, Normal, Large) and separate colors for buy/sell arrows. Choose text color and size for the strength percentage, also separated for buy/sell. Control the history window (how many past days’ arrows/labels remain visible) to keep the chart minimal or more informative.
- Diagnostics Table (Daily Bias & Strength): Toggle the table on/off and place it in any corner (top/bottom, left/right). Customize header background/text colors, row background/text colors, and the colors used for Buy/Sell/Neutral states. Set border width and overall text size to match your chart theme.
- Forward Extensions & History Windows: Independently control how far ME lines, POI boxes, and ME-Fibonacci levels extend into the future, and how much intraday arrow/label history is kept. These controls let you balance context vs. cleanliness on any timeframe.
How to use properly
- Add RealEdgeFX EdgeMap Pro to any TradingView symbol and timeframe.
- For execution, use intraday charts (e.g., 1–15 minutes).
- The study pulls its higher-timeframe context from the Daily and confirms structure on the 1-hour engine.
Originality & value
This study is not a mashup; it integrates a daily rule engine with a 1-hour regime detector that maintains live extremes on lower timeframes and a single, side-aligned point-of-interest filter with merging/invalidations. The combination produces a table-audited bias and strength built from measurable, configurable checks rather than generic overlays.
Terms and Conditions
Purpose and no advice. These charting tools are provided for informational and educational purposes only. They do not predict markets or provide financial, investment, or trading advice. Past performance is not indicative of future results.
User responsibility and liability. By using these tools, you agree that all decisions and outcomes are your sole responsibility. RealEdgeFX EdgeMap Pro and its creator(s) are not liable for any losses or consequences arising from the use of these products. You agree to indemnify and hold RealEdgeFX EdgeMap Pro harmless from any claims related to your use.
Access and use. Access may be granted via TradingView invite and requires an active subscription. Access is personal and non-transferable. Sharing, reselling, redistributing, copying, decompiling, or attempting to reverse engineer the code is prohibited. Access may be suspended or revoked for violations of these terms or platform policies.
Subscriptions, discounts, and cancellation. If you receive access through a Friends & Family program or use a discount code, the discount applies only to the first purchase or first billing cycle unless explicitly stated otherwise. You are solely responsible for canceling—or requesting cancellation of—your subscription if you do not wish to continue after the discounted period and/or at full price.
Refund policy. No reimbursements, refunds, or chargebacks are provided, to the maximum extent permitted by law.
Acceptance and updates. By continuing to use these tools, you acknowledge and agree to these Terms and Conditions. RealEdgeFX EdgeMap Pro may update these terms from time to time; continued use after updates constitutes acceptance of the revised terms.
Weekly pecentage tracker by PRIVATE
Settings Picture below this link: 👇
i.ibb.co
What it is
A lightweight “Weekly % Tracker” overlay that lets you manually enter weekly performance (in percent) for XAUUSD + up to 10 FX pairs, then shows:
a small table panel with each enabled symbol and its % result
one TOTAL row (Sum / Average / Compounded across all enabled symbols)
an optional mini badge showing the % for a single selected symbol
Nothing is auto-calculated from price—you type the % yourself.
Key settings
Panel: show/hide, position, number of decimals, colors (background, text, green/red).
Total mode:
Sum – adds percentages
Average – mean of enabled rows
Compounded –
(
∏
(
1
+
𝑝
/
100
)
−
1
)
×
100
(∏(1+p/100)−1)×100
Symbols:
XAUUSD (toggle + label + % input)
10 FX pairs (each has On/Off, label text, % input). You can rename labels to any symbol text you want.
Mini badge: show/hide, position, and symbol to display.
How it works
Overlay indicator: overlay=true; just draws UI on the chart (no plots).
Arrays (syms, vals, ons) collect the row data in order: XAU first, then FX1…FX10.
Helpers:
posFrom() converts a position string (e.g., “Top Right”) into a position.* constant.
wp_col() picks green/red/neutral based on the sign of the %.
wp_round() rounds values to the selected decimals.
calc_total() computes the TOTAL with the chosen mode over enabled rows only.
Table creation logic:
Counts how many rows are enabled.
If none enabled or panel is off: the panel table is deleted, so no box/background is visible.
If enabled and on: the panel is (re)created at the chosen position.
On each last bar (barstate.islast), it clears the table to transparent (bgcolor=na) and then fills one row per enabled symbol, followed by a single TOTAL row.
Mini badge:
Always (re)created on position change.
Shows selected symbol’s % (or “-” if that symbol isn’t enabled or has no value).
Colors text green/red by sign.
Notes & limits
It’s manual input—the script doesn’t read trades or P/L from price.
You can rename each row’s label to match any symbol name you want.
When no rows are enabled, the panel disappears entirely (no empty background).
Designed to be light: only draws tables; no heavy plotting.
If you want the TOTAL row to be optional, or different color thresholds, or CSV-style export/import of the values, say the word and I’ll add it.

Positive Close RatioThe Positive Close Ratio is a simple sentiment indicator that measures the percentage of days within a chosen lookback period where the closing price finished higher than the previous day.
• Calculation:
It counts how many daily closes were positive compared to the previous day, then divides by the total number of days in the lookback window.
\text{Positive Close Ratio} = \frac{\text{Number of Up Days}}{\text{Lookback Days}} \times 100

DM Impulse Enhanced [BackQuant]DM Impulse Enhanced
What this is (and what it isn’t)
DM Impulse Enhanced is a signal-driven overlay that classifies market action into two practical regimes: Long (risk-on) and Cash (risk-off). It’s built around a proprietary impulse model from the directional-movement family, wrapped in a persistence test and a state machine. Because this script is private, the core mechanics are intentionally abstracted here; what follows explains how to read and use it without revealing the protected calculation.
Why traders use it
Many tools oscillate or describe “how stretched” price is; fewer make a firm, operational call that you can automate. DM Impulse Enhanced aims to do exactly that declare when upside pressure is broad and durable enough to justify a long bias, and when deterioration is strong enough to stand aside (cash/short discretion). The emphasis is on impulse persistence rather than one-off spikes.
What you see on the chart
• Long / Cash markers – Green up-triangles (Long) and red down-triangles (Cash) plot at the bar where the regime changes.
• Regime-tinted bars (optional) – Candles can be softly shaded green during Long and red during Cash for at-a-glance context.
• Trend ribbon (context only) – A narrow ribbon (fast/slow moving averages) is tinted by the current regime to show trend alignment; it does not generate signals on its own.
• No separate sub-pane – Signals are intended to sit directly on price for immediate decision-making.
How the logic behaves (high-level)
Impulse core – A directional-movement–based engine estimates the strength of buying vs. selling pressure over a user-defined horizon.
Persistence gate – Instead of reacting to a single reading, the model evaluates how consistently that impulse dominates across a configurable lookback range.
State machine – When persistence clears (or fails) a pair of thresholds, the model flips and stays in that regime until evidence justifies a change. This “stickiness” is intentional; it reduces whipsaws in choppy tape.
Inputs & controls
Calculation Settings
• DM Length – The base horizon for the impulse engine. Longer = smoother/steadier; shorter = quicker/more reactive.
• Start / End – Defines the span of the persistence check. Expanding the span asks the market to prove itself against more history before changing regime.
Signal Settings
• Long Threshold – The persistence level required to promote the model into Long.
• Short Threshold – The level that, once crossed to the downside, demotes the model into Cash. Using a cross-under event for risk-off helps avoid premature exits on noise.
Visual Settings
• Long / Short colours – Customize marker and shading hues.
• Color Bars? – Toggle candle tinting by regime (off if you prefer a clean chart).
Reading the signals
• Long prints only when the model observes sustained upside pressure across the configured span. Treat this as permission to engage with pullbacks, breakouts, or your preferred setups in the direction of the trend.
• Cash prints when downside deterioration is strong enough to invalidate the prior regime. It’s a risk-off directive—flatten, hedge, or switch to short strategies according to your plan.
• Regime persistence is a feature: once Long, the model won’t flip on minor dips; once Cash, it won’t re-arm on minor bounces. If you want more flips, shorten the spans and relax thresholds; if you want fewer, do the opposite.
Practical tuning guide
Match DM Length to your timeframe
– Intraday: smaller length for timely response.
– Swing/Position: larger length to filter desk-noise and track higher-timeframe flows.
Size the persistence span to your goal
– Narrow span: faster regime changes, more trades, more noise.
– Wide span: fewer, higher-conviction calls, longer holds.
Set realistic thresholds
– The Long threshold should be reachable with your chosen span; the Short threshold should be low enough to catch genuine deterioration but not so tight that it flips on every dip.
Decide on cosmetics
– Turn on bar tinting for discretionary reading, or keep it off when exporting screenshots or running other overlays.
Suggested workflows
• Trend-following with discipline – Trade only in the Long regime; use structure (higher lows, anchored VWAP, or pullbacks to your MA stack) for entries and the Cash flip as a portfolio-level exit.
• Risk overlay – Keep your normal strategy, but: reduce size when Cash appears; re-enable full risk only after Long reasserts.
• Multi-timeframe gating – Require Long on a higher timeframe (e.g., 4H or 1D), then take entries on a lower one. If the high-TF posts Cash, stand down.
How the ribbon fits in
The ribbon visualizes short- vs. intermediate-term trend in the same colour as the regime. It’s deliberately “dumb”: it does not change the signal, it just helps you see when price action and regime are in harmony (e.g., pullbacks during Long that hold above the ribbon).
Alerts included
• DM Impulse LONG – Triggers as the persistence measure clears the Long threshold.
• DM Impulse CASH – Triggers when deterioration crosses the Short threshold from above.
Configure alerts to fire on bar close if you want final (non-intrabar) decisions.
Strengths
• Actionable binary output – Long/Cash is unambiguous and easy to automate.
• Persistence-aware – Focuses on runs that endure, not one-bar excitement.
• Asset/timeframe agnostic – Works anywhere you trust directional-movement concepts (equities, futures, crypto, FX).
Limitations & cautions
• Not a reversal caller – It’s a regime classifier. If you need early bottoms/tops, pair it with your own exhaustion or liquidity tools.
• Parameter feasibility matters – If your thresholds are set beyond what your span can reasonably achieve, signals may rarely (or never) trigger.
• Chop happens – In mean-reverting or news-driven tape, expect more frequent flips unless you widen spans and thresholds.
• Intrabar movement – Like any responsive model, provisional intrabar states can appear before the bar closes. Use “bar close” alerts for finality.
Getting started (safe defaults you can adapt)
• Intraday bias – Shorter DM Length, modest span, moderately tight thresholds.
• Swing filter – Longer DM Length, wider span, stricter Long and sufficiently low Short.
• Conservative overlay – Keep thresholds firm and spans wide; use signals to scale risk rather than flip directions frequently.
Summary
DM Impulse Enhanced is a persistence-focused regime classifier built on directional-movement concepts. It answers a narrow question clearly “Risk-on or risk-off?” and stays with that answer until the evidence meaningfully changes. Use it as a bias switch, a portfolio risk overlay, or a gate for your existing entry logic, and size its spans/thresholds to the cadence of the market you trade.

ETH/BTC/XRP Strategy - Powered by BCHETH/BTC/XRP Strategy — Cross-Asset Momentum-Based Strategy
Overview
This strategy aims to identify medium-term long trade opportunities on ETH/BTC/XRP 2 or 4 hour charts by leveraging cross-asset momentum signals from Bitcoin Cash (BCH) relative to Ethereum (ETH). It integrates volatility filters, volume validation, and momentum confirmations to improve trade timing and risk management.
Key Features and Logic
Cross-Asset Momentum Filter: Enters long trades when BCH outperforms ETH in the prior candle, supporting relative strength confirmation.
Volume Confirmation: BCH volume must exceed 135% of its 20-period average, validating market interest before entry signals.
Volatility Filter: ETH price near or below 110% of the lower Bollinger Band (20 periods, 2σ) indicates oversold conditions.
Momentum Indicators: ETH RSI below 70 ensures the asset is not overbought, coupled with BCH MACD line crossing above its signal line for bullish bias.
Risk Controls: Includes trailing stop losses and take profit targets to protect gains and limit drawdowns.
Timing Constraints: Controlled cooldown periods between trades help prevent overtrading and false signals.
Usage Recommendations
Optimized for 2 or 4hour ETH/BTC/XRP USDT candles; 5-minute data optionally used for finer entries and exits.
Suitable for traders seeking dynamic timing based on multi-asset interactions rather than blind holding.
Works as a complement within diversified or rotational strategies focusing on Ethereum exposure.
Performance Summary (Backtest Jan 2023 – Jul 2025) ; ETHUSDT 2hour basis.
Total trades: 65
Win rate: 61.5%
Profit factor: 5.1
Note: The sample size is limited; results should be interpreted with caution. Past performance is not indicative of future results.
Important Notes
This script represents an original combination of cross-asset momentum with volatility and volume filters tailored to ETH and BCH interaction.
Source code is protected to safeguard unique implementation details while allowing free usage without restrictions.
Use appropriate risk management, and consider these signals as part of a broader trading analysis.
No guarantees on profitability; trading involves significant risk.

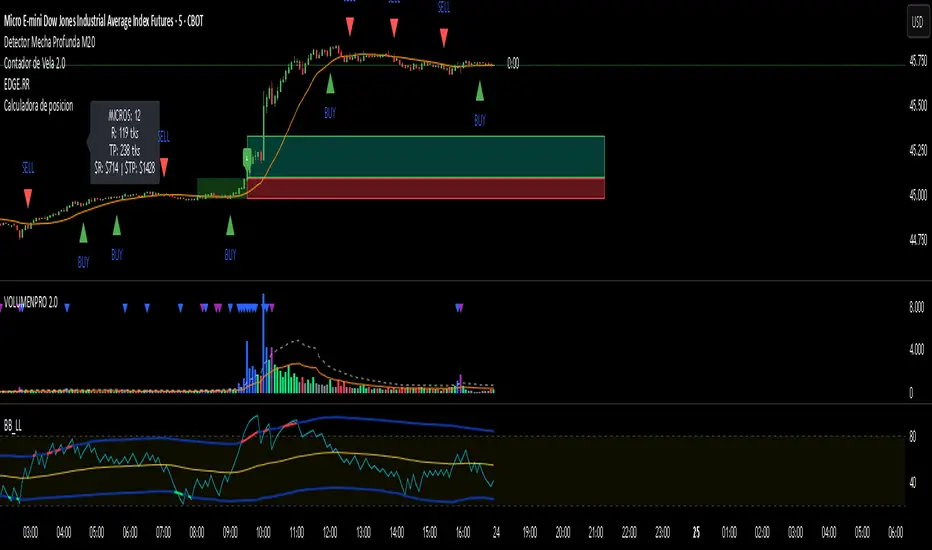
Auto Orderblock Generator Pro Version 3.1 IndicatorThis indicator automatically generates order blocks on any time frame so you can analyze charts with precision and know where high areas of liquidity lie in real time.
Daily Weekly Monthly HLC (بهداد)خطوط مهم روزانه هفتگی ماهانه This is an indicator that shows the closing lines and the highest and lowest prices for daily, weekly and monthly periods. In addition, we can divide the entire weekly period into several parts.
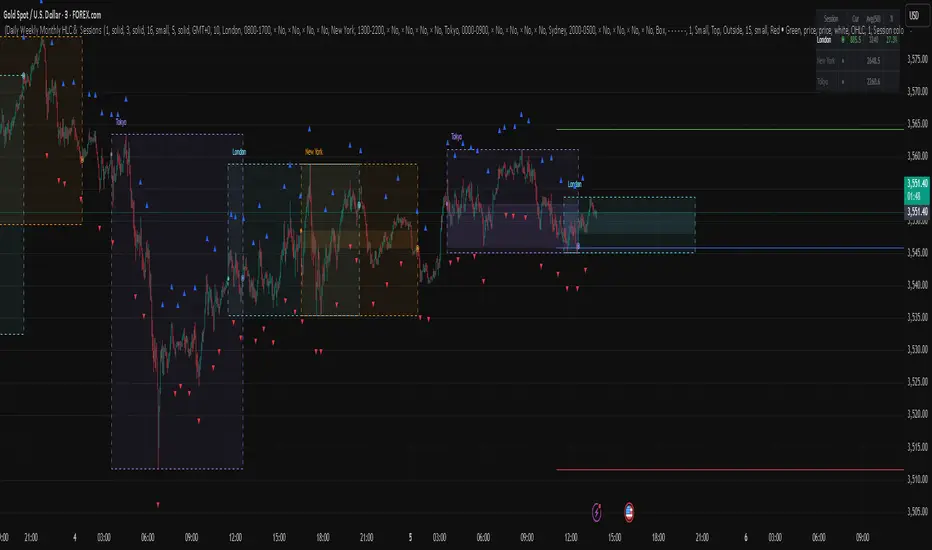
Androlog DailyWeeklyMonthlyAndrologLevel — Daily / Weekly / Monthly Levels
This indicator visualizes the Daily, Weekly, and Monthly key levels introduced by Daniel. It’s intentionally minimal and fast, focused on clean higher‑timeframe references for intraday and daily trading.
What it shows:
Daily open and prior‑day high/low
Weekly and Monthly “open”-based levels
Optional labels for quick price readouts
Controls
Show only new levels or keep/extend old ones
Choose whether levels extend to the right
Alerts
Optional alert conditions for level touches (per your settings)
Uses confirmed higher‑timeframe bars; no historical repaint
Lunar calendar day Crypto Trading StrategyLunar calendar day Crypto Trading Strategy
This strategy explores the potential impact of the lunar calendar on cryptocurrency price cycles.
It implements a simple but unconventional rule:
Buy on the 5th day of each lunar month
Sell on the 26th day of the lunar month
No trades between January 1 (solar) and Lunar New Year’s Day (holiday buffer period)
Research background
Several academic studies have investigated the influence of lunar cycles on financial markets. Their findings suggest:
Returns tend to be higher around the full moon compared to the new moon.
Periods between the full moon and the waning phase often show stronger average returns than the waxing phase.
This strategy combines those observations into a practical implementation by testing fixed entry (lunar day 5) and exit (lunar day 26) points, while excluding the transition period from solar New Year to Lunar New Year, effectively capturing mid-month lunar effects.
How it works
The script includes a custom lunar date calculation function, reconstructing lunar months and days for each year (2020–2026).
On lunar day 5, the strategy opens a long position with 100% of equity.
On lunar day 26, the strategy closes the position.
No trades are executed between Jan 1 and Lunar New Year’s Day.
All trades include:
Commission: 0.1%
Slippage: 3 ticks
Position sizing uses the entire equity (100%) for simplicity, but this is not recommended for live trading.
Why this is original
Unlike mashups of built-in indicators, this script:
Implements a full lunar calendar system inside Pine Script.
Translates academic findings on lunar effects into an applied backtest.
Adds a realistic trading filter (holiday gap) based on cultural/seasonal calendar rules.
Provides researchers and traders with a framework to explore non-traditional, time-based signals.
Notes
This is an experimental, research-oriented strategy, not financial advice.
Results are highly dependent on the chosen period (2020–2026).
Using 100% equity per trade is for simplification only and is not a viable money management practice.
The purpose is to investigate whether cyclical patterns linked to lunar time can provide any statistical edge in ETHUSDT.

Parabolic CCI Pro — Long & Short + ATR Risk — [AlphaFinansData]English Description (Enhanced)
🔹 CCI + Parabolic SAR Strategy (Long & Short, Smart Risk Management)
This indicator combines the power of CCI (Commodity Channel Index) and Parabolic SAR, creating a highly reliable trading system that adapts to market conditions.
🚀 How It Works:
Trend Hunting: CCI detects weakening momentum and potential reversal zones.
Confirmation: Parabolic SAR confirms the trend direction, reducing false signals.
Smart Risk Management: Offers both fixed-percentage and ATR-based dynamic Stop Loss & Take Profit, adjusting to volatility automatically.
Performance Dashboard: Tracks win rate, average profit/loss, max drawdown, and winning/losing streaks for deeper strategy insights.
⚡ Who Is It For?
Day traders looking for quick entries and exits,
Swing traders seeking to capture trend reversals,
Risk-conscious investors who want disciplined SL/TP management.
💡 More than just a signal generator, this indicator provides traders with a structured trading framework that helps maintain consistency and discipline.

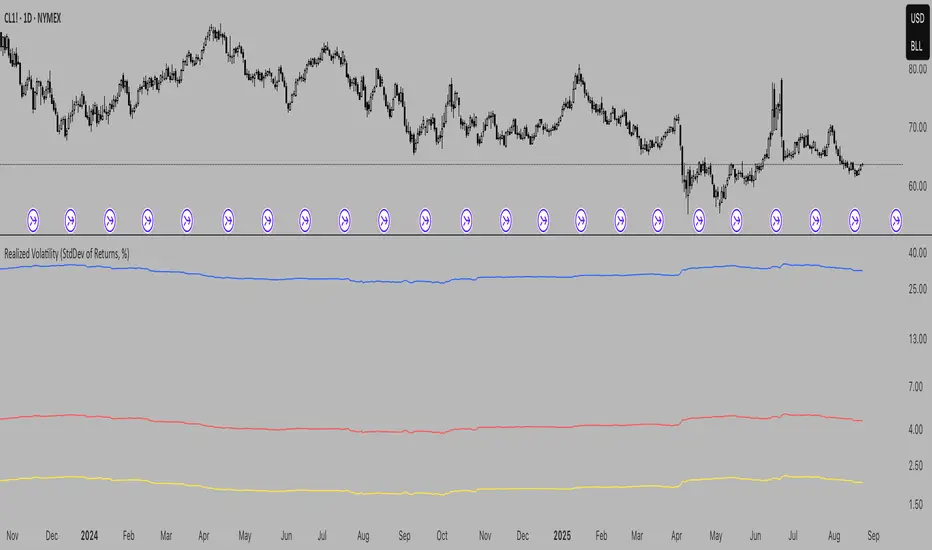
Realized Volatility (StdDev of Returns, %)Realized Volatility (StdDev of Returns, %)
This indicator measures realized (historical) volatility by calculating the standard deviation of log returns over a user-defined lookback period. It helps traders and analysts observe how much the price has varied in the past, expressed as a percentage.
How it works:
Computes close-to-close logarithmic returns.
Calculates the standard deviation of these returns over the selected lookback window.
Provides three volatility measures:
Daily Volatility (%): Standard deviation over the chosen period.
Annualized Volatility (%): Scaled using the square root of the number of trading days per year (default = 250).
Horizon Volatility (%): Scaled to a custom horizon (default = 5 days, useful for short-term views).
Inputs:
Lookback Period: Number of bars used for volatility calculation.
Trading Days per Year: Used for annualizing volatility.
Horizon (days): Adjusts volatility to a shorter or longer time frame.
Notes:
This is a statistical measure of past volatility, not a forecasting tool.
If you change the scale to logarithmic, the indicator readibility improves.
It should be used for analysis in combination with other tools and not as a standalone signal.
Crypto Position Size CalculatorPosition Size Calculator for Crypto.
This indicator uses the current price and a selected stop loss to calculate your position size without having to work it out elsewhere!
Simply set your account size, desired risk percentage and stop loss level and it will work out how many lots and the dollar value of your desired position.
Hope you enjoy!

Calculadora de posicion)Position Size Calculator is a simple tool that helps traders instantly know how many contracts or lots to use based on their risk.
Just set your account size, risk percentage, and stop loss distance — the calculator does the rest.
Stay disciplined, control your risk, and trade with confidence.
Trojan Cycle: Dip & Profit Hunter📉 Crypto is changing. Your signals should too.
This script doesn’t try to outguess price — it helps you track capital rotation and flow behavior in alignment with the evolving macro structure of the digital asset market.
Trojan Cycle: Dip & Profit Hunter is a signal engine built to support and validate the capital rotation models outlined in the Trojan Cycle and Synthetic Rotation theses — available via RWCS_LTD’s published charts
It is not a classic “buy low, sell high” tool. It is a structural filter that uses price/volume statistics to surface accumulation zones, synthetic traps, and macro context shifts — all aligned with the institutionalization of crypto post-2024.
🧠 Purpose & Value
Crypto no longer follows the retail-led, halving-driven pattern of 2017 or 2021.
Instead, institutional infrastructure, regulatory filters, and equity-market Trojan horses define the new path of capital.
This tool helps you visualize that path by interpreting behavior through statistical imbalances and real-time momentum signals.
Use it to:
Track where capital is accumulating or exiting
Identify signals consistent with true cycle rotation (vs. synthetic traps)
Validate your macro view with real-time statistical context
🔍 How It Works
The engine combines four signal layers:
1. Z-Score Logic
- Measures how far price and volume have deviated from their mean
- Detects dips, blowoffs, and exhaustion zones
2. Percentile Logic
- Compares current price and volume to historical rank distribution
- Flags statistically rare conditions (e.g. bottom 10% price, top 90% volume)
3. Combined Context Engine
- Integrates both models to generate one of 36 unique output states
- Each state provides a labeled market context (e.g., 🟢 Confluent Buy, 🔴 Confluent Sell, 🧨 Synthetic Trap )
4. Momentum Spread & Divergence
- Measures whether price is leading volume (trap risk) or volume is leading price (accumulation)
- Outputs intuitive momentum context with emoji-coded alerts
📋 What You See
🧠 Contextual Table UI with key Z-Scores, percentiles, signals, and market commentary
🎯 Emoji-coded signals to quickly grasp high-probability setups or risk zones
🌊 Optional overlays: price/volume divergence, momentum spread
🎨 Visual table customization (size, position) and chart highlights for signal clarity
🔔 Alert System
✅ Single dynamic alert using alert() that only fires when signal context changes
Prevents alert fatigue and allows clean webhook/automation integration
🧭 Use Cases
For macro cycle traders: Track where we are in the Trojan Cycle using statistical context
For thesis explorers: Use the 36-output signal map to match against your rotation thesis
For capital rotation watchers: Identify structural setups consistent with ETF-driven or compliance-filtered flow
For narrative skeptics: Avoid synthetic altseason traps where volume lags or flow dries up
🧪 Suggested Pairing for Thesis Validation
To use this tool as part of a thesis-confirmation framework , pair it with:
BTC.D — Bitcoin Dominance
ETH/BTC — Ethereum strength vs. Bitcoin
TOTALE100/ETH — Altcoin strength relative to ETH
RWCS_LTD’s published charts and macro cycle models
🏁 Final Note
Crypto has matured. So should your signals.
This tool doesn’t try to game the next 2 candles. It helps you understand the current phase in a compliance-filtered, institutionalized rotation model.
It’s not built for hype — it’s built for conviction.
Explore the thesis → Validate the structure → Trade with clarity.
🚨 Disclaimer
This script is not financial advice. It is an analytical tool designed to support market structure research and rotation thesis validation. Use this as part of a broader framework including technical structure, dominance charts, and macro data.

ATR by Session Library [1CG]Library "ATRxSession"
This library shows you how big the bars usually are during a trading session. It looks only at the times you choose (like New York or London hours), measures the “true range” of every bar in that session, then finds the average for that session. It keeps the last N sessions and gives you their overall average, so you can quickly see how much the market typically moves per bar during your chosen session.
Call getSessionAtr(timezone, session, sessionCount) from your script, and it will return a single number: the average per-bar volatility during the chosen session, based on the last N completed sessions. This makes it easy to plug session-specific volatility into your own indicators or strategies.
getSessionAtr(_timezone, _session, _sessionCount)
getSessionAtr - Computes a session-aware ATR over completed sessions.
Parameters:
_timezone (string) : (string) - Timezone string to evaluate session timing.
_session (string) : (string) - Session time range string (e.g., "0930-1600").
_sessionCount (int) : (int) - Number of past completed sessions to include in the rolling average.
Returns: (float) - The average ATR across the last N completed sessions, or na if not enough data.

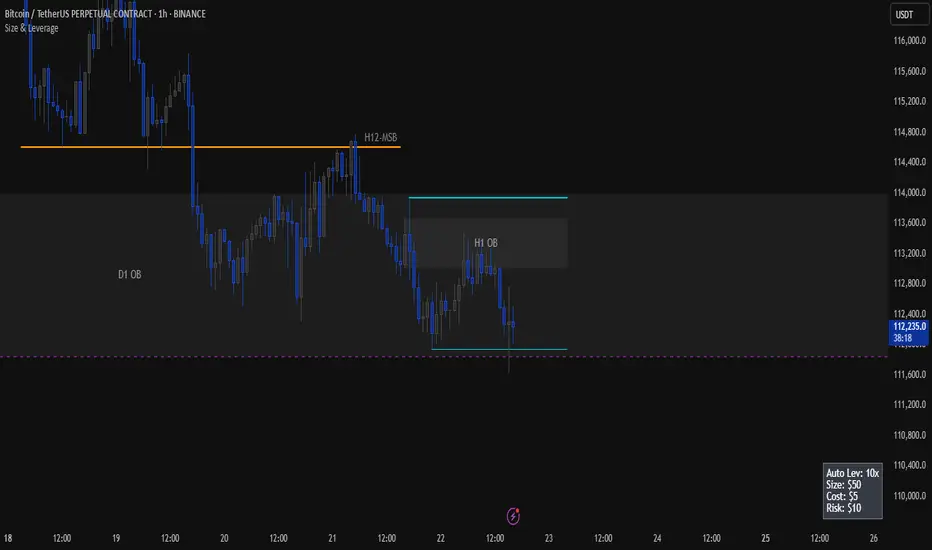
Size & LeverageSize and Leverage calculator for trading, using market orders. It will calculate maximum possible leverage by default in order to prioritize capital efficiency. If you wish to use manual leverage you need to manually enter it in the settings. The script rounds both auto leverage and size to your liking. Entry price is always last price. Size is the actual size you need to input, adjusted to your leverage, cost means the margin required to open the trade. I made this indicator as a binance futures user.
AndrologQuartileAndrologQuartile
This indicator is based on the assumption that if a candle closes in the upper or lower quartile of its range, the next candle often tends to take out the high or low of that candle.
The script does two things:
It calculates and displays live statistics on how often this condition occurs and how often it is successful.
It highlights candles that meet the quartile condition so you can track them in real time.
It is most meaningful to use this indicator on higher timeframes (from 1h upwards).
You can also set an alert: once configured, the alert will always trigger for the timeframe that was active at the moment of setup.
Usage tip:
Click the statistics panel in the top right corner to adjust settings and alerts.
Adjustable parameters:
Quartiles: Default values are 25% and 75%.
Min Distance: Defines how far the high/low must be from the candle’s close (in %) to be considered relevant. A smaller value is applied automatically on intraday timeframes under 5 minutes.

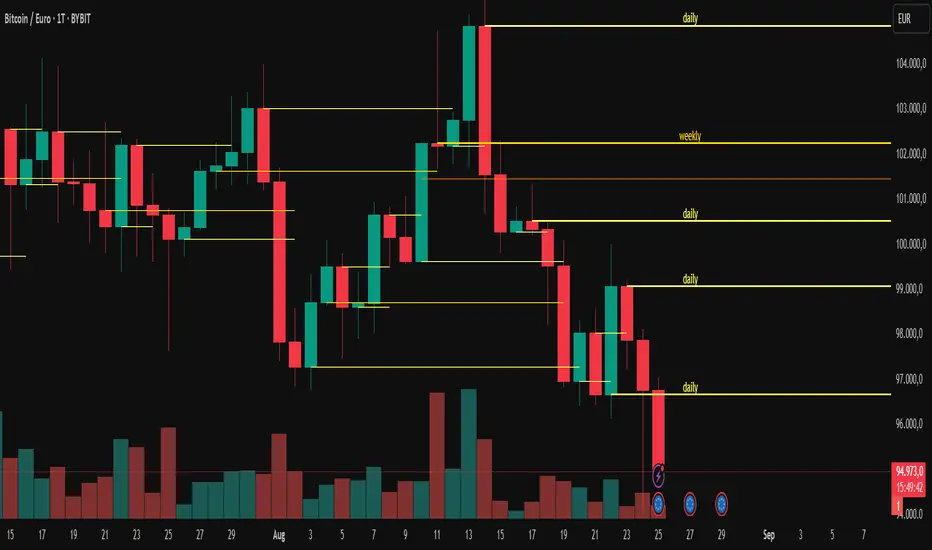
Custom Support & Resistance Levels (Manual Input)This indicator lets you plot your own support levels (and can be extended for resistance) directly on the chart by entering them as comma-separated values.
📌 Supports manual input for multiple price levels.
📊 Lines are extended across the chart for clear visualization.
🎨 Dynamic coloring:
Green if the current price is above the level.
Red if the current price is below the level.
🧹 Old lines are automatically cleared to avoid clutter.
This tool is ideal if you:
Prefer to mark your own key zones instead of relying only on auto-detected levels.
Want clean and simple visualization of critical price areas.
👉 Coming soon: Resistance levels input (commented in the code, can be enabled).
VSA Highlight & Relative Strength of Volume [odnac]This is a TradingView indicator combining VSA (Volume Spread Analysis) signals with a relative strength of volume visualization.
The indicator has two main parts:
1. VSA Volume Highlight:
Detects common VSA signals, including Stopping Volume, Buying Climax, No Supply, No Demand, Test, Up-thrust, Shakeout, Demand Absorption, and Supply Absorption.
Supports a trend filter using a user-selectable moving average type (SMA, EMA, WMA, or VWMA) and length.
Calculates spread and volume moving averages to determine wide/narrow spreads and high/low volume relative to the averages.
Determines relative bar positions (close near high, close near low, or mid-close) to categorize VSA signals.
Optionally colors the background based on the detected VSA signal.
Supports alerts for each VSA signal type.
2. Relative Strength of Volume:
Splits total volume into buying and selling components based on the candle’s high, low, and close.
Buying volume is calculated as volume times the proportion of the candle’s close above the low.
Selling volume is calculated as volume times the proportion of the candle’s close below the high.
Plots buying and selling volume as colored columns in the pane.
Plots total volume in the status line colored according to the dominant side (buying or selling).
Inputs include:
Toggle visibility for each VSA signal.
Trend filter options (type and length).
Volume and spread moving average lengths and multipliers for high/low volume and wide/narrow spread detection.
Thresholds for close positions near high or low, and for identifying Buying Climax.
Opacity for VSA volume highlights.
The indicator is designed to help traders visually identify key volume patterns and analyze buying and selling pressure in the market.

Multi Channel GRID & DCA LTF [trade_lexx]Multi Channel GRID & DCA LTF
Usage Guide
Part 1: The concept and general possibilities of the "Multi Channel GRID & DCA LTF" strategy
Introduction
Welcome to the guide to "Multi Channel GRID & DCA LTF", a powerful and versatile automated trading strategy for the TradingView platform. This tool was developed for traders who are looking for flexibility, control and a high degree of adaptability to various market conditions.
The strategy is based on a hybrid approach that combines two popular and time-tested techniques.:
1. GRID (grid trading): The classic method of averaging a position is by placing a grid of limit orders.
2. DCA (Dollar Cost averaging): Smart position averaging based on signals from external indicators.
However, "Multi Channel GRID & DCA LTF" goes far beyond the simple combination of these two techniques. The strategy includes a number of unique and innovative features, such as cascading MultiGRID grids for dealing with extreme volatility, Channel Mode range trading mode for profiting from sideways movement, and Low Time Frame analysis (LTF) to achieve surgical accuracy in backtesting. Deep customization options for risk management, capital, take profits, and stop losses allow you to configure a strategy for almost any trading style, asset, and timeframe.
The basic idea: How does it work?
Let's take a detailed look at each of the key concepts embedded in the logic of the strategy.
1. GRID — Automatic placement of buy and sell orders at certain price intervals.
This is a fundamental mode of operation. Its main goal is to systematically improve the average entry price for a position if the market is going against you.
* The principle of operation: After opening the base (first) order (`BO`), the strategy automatically places a series of pending limit orders (here they are called "safety orders" or "SO") at certain price intervals. For a long position, orders are placed below the entry price, and for a short position, orders are placed higher.
* Target: When the price moves against an open position, it consistently hits and executes safety orders. Each such execution adds additional volume to the position at a more favorable price, thereby shifting the overall average entry price (`position_avg_price') closer to the current market price. This means that a much smaller corrective movement will be required to gain ground.
* Flexibility: You have full control over the geometry of the grid: the number of safety orders, the percentage distance between them (`SO Step`), and you can even set a coefficient that will increase this step for each subsequent order (`SO Multiplier`), creating an expanding grid.
2. DCA (Signal Averaging) — Smart Averaging
This mode adds an additional layer of analysis to the averaging process. Instead of just buying/selling at the set price levels, the strategy waits for a confirmation signal.
* Working principle: You can connect any external indicator (for example, RSI, CCI, or even your own complex signal system) to the strategy, which outputs numerical values. As standard, 1 is used for a long signal, and -1 is used for a short signal. The strategy will place the next averaging order only at the moment when it receives the appropriate signal.
* Goal: To average a position not just during a fall (or a rise for a short), but at the moments that your main trading system considers the most favorable for this. This allows you to avoid "catching falling knives" and enter only if there are good reasons.
3. Hybrid Mode (GRID+DCA) is the best of the previous two modes
This mode is designed for maximum filtering and control. It requires two conditions to be fulfilled simultaneously.
* Working principle: The safety order will be executed only if the price has reached the calculated grid level and a confirmation signal has been received from your external indicator. If a confirmation signal is received from an external indicator, the next calculated grid level activates the limit order.
* Goal: To create the most reliable averaging system that protects against premature entries and requires double confirmation (both by price and indicator) before increasing the position size.
4. MultiGRID — Adaptation to extreme volatility
This is one of the most powerful and unique features of a strategy designed to survive and make a profit in the face of strong, protracted trends or "black swans".
* The problem it solves: The usual grid of orders has a limited depth. If the price goes beyond the last safety order, the strategy loses the opportunity to average and becomes vulnerable.
* The principle of operation: The MultiGRID function allows you to create "cascades" — several grids following one another. When all the orders of the first grid are executed, the strategy does not stop. Instead, she can activate the second, third (and so on) a grid of orders. The new grid can be activated by one of two triggers:
1. Offset: The new grid is activated when the price passes another set percentage deviation from the last executed order.
2. Signal: The new grid is activated when a signal is received from an external indicator.
* Goal: To significantly expand the working range of the strategy. This allows it to adapt to strong market movements that would "break" the usual grid, and continue to effectively average a position at a much greater depth of decline or growth.
5. Channel Mode — Trading in the range
This feature turns a standard averaging strategy into a machine for "farming" profits within a price channel that is formed during a sideways market movement.
* The problem it solves: In the standard grid strategy, after partially closing a take profit position, the volume of this part "leaves" the trade until the deal is fully closed. You are missing the opportunity to reuse this capital.
* Operating principle: When Channel Mode is enabled, the following happens. Suppose the price went against you, executed several safety orders, and then turned around and reached one of the partial take profits. At this point, the strategy is:
1. Fixes the profit, as it should be.
2. Instantly places a new limit order to buy (or sell for a short) at exactly the same price level where the last triggered safety order was executed. The volume of this order is equal to the volume of the part that was just closed for take profit.
3. If the price goes down again and executes this "repeat" order, the strategy immediately sets a corresponding take profit for it at the level where the previous profit was taken.
* Goal: To create a continuous buy-sell cycle within the local range (channel). The lower limit of the channel is the price of the last averaging, and the upper limit is the price of a partial take profit. This allows you to repeatedly profit from sideways price fluctuations, without waiting for the full closure of the main, large transaction.
6. LTF (Lower Timeframe Analysis) — Surgical precision of backtesting
This feature is critically important for obtaining reliable results during historical testing (backtesting) of grid strategies.
* The problem it solves: The standard testing mechanism in TradingView has a serious limitation. Working, for example, on a 4-hour chart, he sees only 4 candle points: Open, High, Low and Close. He does not know in what order the price moved within these 4 hours. He could have touched High first and then Low, or vice versa. For grid strategies, this is fatal — the engine can show that a take profit has been executed, although in reality the price first went down, collected the entire grid of orders and only then turned around.
* How it works: When you turn on the LTF mode, the strategy for each candle on your main chart (for example, 4H) requests and analyzes all candles from the lower timeframe you specified (for example, 1-minute). Then it virtually trades the entire price path for these minute candles, executing orders, take profits and stop losses in the sequence in which they would occur in reality. It works in the single take profit mode of the Grid strategy.
* Goal: To provide the most realistic and reliable backtest that reflects the real dynamics of the market. This allows you to avoid false expectations and accurately assess the potential performance of the strategy.
// ------------------------
Part 2: Detailed description of the strategy settings
This section is your main guide to all the switches and options available in the strategy. Understanding each setting is the key to unlocking the full potential of this powerful tool.
1. 🛡️ Risk Management 🛡️
This group contains fundamental parameters that determine the basic logic of risk management and the geometry of grid orders.
* Strategy type: Determines the direction of transactions.
* Long: The strategy will only open long positions (buy).
* Short: The strategy will only open short positions (sell).
* Both: The strategy will work both ways, opening long or short depending on the incoming signal.
* SO Count: Sets the maximum number of Safety (averaging) Orders (SO) that the strategy will place within the same grid. If you have MultiGRID enabled, this number applies to each individual grid.
* SO Step (%): This is the base percentage deviation from the entry price at which the first safety order will be placed. For example, at a value of 0.5, the first SO in a long trade will be placed 0.5% lower than the opening price of the base order.
* SO Multiplier: A coefficient that exponentially increases the step for each subsequent safety order. This allows you to create an expanding grid where averaging orders are placed further and further apart, which is effective with strong and accelerating price movements.
* *The step formula for the nth order*: Step(N) = (SO Step) * (SO Multiplier ^(N-1)).
* If the value is 1, all steps will be the same.
* With a value of 1.6, the step of the second SO will be 1.6 times larger than the first, the step of the third will be 1.6 times larger than the second, and so on.
* 1️⃣ TP/SL: These are simplified settings for quick configuration. They allow you to turn on/off the main take profit and stop loss and set basic percentage values for them. More detailed settings for these parameters can be found in the relevant sections below.
// ------------------------
2. 💰 Money Management 💰
Everything related to position size, leverage, and capital is configured here.
* Volume BO (Base Order): Determines the size of the trade's opening order.
* Volume BO: A fixed amount in the quote currency (for example, in USDT).
* USDT (check mark): Manages the information in the comments to the orders. If enabled, the volume of orders in USDT will be displayed in the comments. This is convenient for visual analysis and for sending the amount of USDT by the placeholder {{strategy.order.comment}} via webhooks when connecting the strategy to the exchange or trading terminals.
* or % of deposit: The amount calculated as a percentage of the available capital of the strategy. The check mark to the right of this field enables this mode. Important: using a percentage activates the effect of compounding (compound interest), as the amount of each new transaction will be automatically recalculated based on the current capital (initial capital + profit/loss). If enabled, the percentage of orders will be displayed in the comments. This is convenient for visual analysis and for sending percentages on the placeholder {{strategy.order.comment}} via webhooks when connecting the strategy to the stock exchange, trading terminals, or creating Copy trading.
* Martingale: The coefficient applied to the volume of orders. It increases the size of each subsequent insurance order compared to the base one.
* Volume formula for the nth SO: Volume SO (N) = (Volume BO) * (Martingale^N).
* With a value of 1.2, the volume of the first SO will be 1.2 times greater than the base, the second — 1.44 times (`1.2 * 1.2`) and so on.
* Leverage: Specify the size of your leverage. This parameter is used exclusively for calculating and displaying the approximate liquidation price. It does not affect the size of positions, but it helps to visually assess the risks.
* Liquidation: Enables or disables the calculation and display of the liquidation line on the chart.
* Margin type: Allows you to select a method for calculating the liquidation price, simulating the logic of exchanges:
* Isolated: The liquidation price is calculated based on the size and leverage of the current open position only.
* Cross: The calculation simulates using the entire available balance to maintain a position. In the strategy, the liquidation price is calculated as the level at which the loss on the current transaction is equal to the current capital.
* Commission (%): Specify the percentage of your exchange's commission per transaction. The correct value of this parameter is crucial for obtaining realistic backtest results.
// ------------------------
3. 🕸️ Grid Management 🕸️
This group is responsible for the logic of safety orders and advanced mechanics such as Channel Mode and MultiGRID.
* SO Type: Defines the logic of placing averaging orders.
* GRID: Classic grid. All safety orders are placed in advance as limit orders.
* DCA: Signal averaging. The strategy is waiting for a signal from an external indicator to place a market averaging order.
* GRID+DCA: Hybrid. The strategy waits for a signal, and if it arrives, places a limit order at the appropriate price level of the grid or executes a market order if the signal has arrived below the limit order level.
* Signal for SO: A data source (indicator) that will be used for signals in DCA and GRID+DCA modes.
* ↔️ Channel Mode: When this option is enabled, the strategy tries to trade in a sideways range. After partially closing a take profit position, it immediately places a limit order for re-entry at the price of the last triggered safety order. This creates a buy-sell cycle within the local channel.
* Best Price Only: This filter adds an additional condition for averaging in DCA and MultiGRID modes (when it operates on a signal). The next averaging order or a new grid will be activated only if the current price is more favorable (lower for long, higher for short) than the price of the previous entry.
* 🧩 MultiGRID ⮕ Enables cascading grid mode.
* Grid Count: The total number of grids that can be activated sequentially.
* Offset: Percentage deviation from the price of the last order of the previous grid. When this margin is reached, the following grid of orders is activated (this mode does not require a signal).
* Or signal: Allows you to use the signal from an external indicator as a trigger to activate the next grid. The checkmark on the right turns on this mode.
// ------------------------
4. 🎯 Entry and Stop 🎯
This group of settings allows you to fine-tune the conditions for starting a new trade and all aspects related to protective stop orders, including the complex mechanics of trailing and managing SL after partial take profits.
* 🎯 Signal: A data source (indicator) that will be used to determine when to enter a trade. The strategy expects a value of 1 for the start of a long trade and -1 for a short trade.
* Min Bars: Sets the minimum number of candles that must pass from the moment of opening the previous trade to the moment of opening the next one. A value of 0 disables this filter. This is a useful tool to prevent overly frequent entries in a "noisy" market.
* Non-stop: If this option is enabled, the strategy ignores the Entry Signal and opens a new trade immediately after closing the previous one (taking into account the Min Bars filter, if it is set). This turns the strategy into a constantly working mechanism that is always on the market.
* 🛑 SL Type: Defines the base price from which the stop loss percentage will be calculated. The stop loss in the first section must be enabled for this block of settings to work.
* From the entry point: SL is always calculated from the opening price of the very first base order. It remains static throughout the entire transaction unless it is moved by other functions.
* From breakeven line: SL is dynamically recalculated and shifted each time a safety order is executed. It always follows the average price of the position, being at a given percentage distance from it.
* From last executed SO: SL is recalculated from the price of the last executed order, whether it is a base or a safety order.
* From last SO: SL is calculated from the price of the most recent possible safety order in the grid. This is usually the most remote and conservative type of SL.
* Trailing SL Type: Defines the algorithm by which the stop loss will move after its activation.
* Standard: Classic trailing. After activation, SL will follow the price at a fixed distance.
* ATR: SL will follow the price at a distance equal to the value of the ATR indicator multiplied by the specified multiplier.
* External Source: SL will follow any selected line of the third-party indicator.
* Period and Multiplier: Common parameters for all types of trailing.
* Source: The source of the line for the trailing SL of the third-party indicator.
* Trailing SL after entry: The mode of activation of the trailing SL after entering the transaction
* SL management after TP (sections 1️⃣, 2️⃣, 3️⃣): These three blocks allow you to create a complex stop loss management logic as profits are recorded.
For each take profit level (TP1, TP2, TP3), you can configure:
* SL BE / SL TP1 / SL TP2: When the corresponding TP is reached, the stop loss will be moved to the breakeven point (for TP1), to the TP1 price level (for TP2) or to the TP2 price level (for TP3).
* Trailing SL: When the corresponding TP is reached, the trailing stop loss is activated according to the settings above.
* By ↔️ Signal: A very powerful option. If it is enabled, the above action (SL transfer or trailing activation) will occur when the opposite trading signal is received from an external indicator. This allows you to protect profits or reduce losses if the market turns sharply, even before reaching the target.
* SL Delay ⮕ Allows you to delay the activation of the stop loss.
* Number of Bars: The Stop loss will be physically placed on the market only after the specified number of candles has passed since entering the trade. This can help to avoid "taking out" the stop with a random short movement (squiz) immediately after opening a position.
* SL Block: Unique defensive mechanics for trading both ways (`Strategy Type: Both`).
* Number of SL: If the strategy receives the specified number of stop losses in a row in one direction (for example, 2 stops long), it temporarily blocks the opportunity to open new trades in that direction.
* Lock Reset mode:
* By direction: The lock is lifted if a profitable trade is closed in the allowed direction or if a stop loss is triggered in the opposite direction.
* First profit: The lock is lifted after closing any profitable transaction, regardless of its direction.
// ------------------------
5. ✅ Take Profit ✅
This group of settings provides comprehensive control over profit taking, from a simple take profit to a complex system of partial closures and trailing.
* ✅ TP Type: Defines the base price for calculating the percentage deviation of the take profit.
* From entry point: TP is calculated from the base order price.
* From breakeven line: TP dynamically follows the average position price.
* From last executed SO: TP is calculated from the price of the last executed order.
* Filters for closing on signal
* Only ➕: If TP is triggered by a signal, the deal will be closed only if it is in the black relative to the average price.
* Or >TP: If TP is triggered by a signal, the trade will be closed only if the closing price is better than (or equal to) the estimated price of this TP.
* TP type of trailing: Yes, take profit has a trailing too! It works differently than the SL trailing.
* Standard / ATR: After the price touches the "virtual" TP level, the trailing is activated. He does not place a stop order, but begins to move away from the price, dynamically moving the limit order to close further and further in the profitable direction, allowing him to collect the maximum from the impulse movement.
* External Source: TP will follow any selected line of the third-party indicator.
* Period and Multiplier: Parameters for calculating the trailing margin TP.
* Source: The source of the line for the trailing TP of the third-party indicator.
* TP level settings (sections 1️⃣, 2️⃣, 3️⃣, 4️⃣): The strategy supports up to four independent take profit levels, which allows for a flexible system of partial commits.
For each level, you can set:
* TP: Enable the level and set its percentage deviation from the base price.
* Size: What percentage of the current position will be closed when this level is reached. For the last active TP, this parameter is ignored, and 100% of the remaining position is closed.
* Trailing TP: Enable the above-described trailing mechanism for this particular level.
* Signal: Enable closing based on the signal from the external indicator for this level.
* Or take: If both the closing on the signal and the limit order are enabled, then whatever comes first will work.
* After SO: Activate this TP level only after the specified number of safety orders has been executed. This allows you to set closer targets for riskier (deeply averaged) positions.
// ------------------------
6. 🔬 GRID and MultiGrid Analysis on Lower TFs (LTF) 🔬
This group activates one of the most important functions for accurate testing of grid strategies.
* Enable LTF Calculation ⮕ The main switch of the analysis mode on the lower timeframes.
* Timeframe selection: A drop-down list where you can select a timeframe for detailed analysis. For example, if your main schedule is 1 hour, you can select 1 minute here. The strategy will emulate the trading of minute candles within each hour candle.
❗️Important: As mentioned in the first part, the use of this mode is critically necessary to obtain realistic backtest results, especially for strategies with a dense grid of orders. Without it, the results may be overly optimistic and not reflect the real dynamics of the market. It should be remembered that TradingView imposes a limit on the number of intra-bars (minor TF bars) that can be requested. This is usually about 100,000 bars.
// ------------------------
7. 🕘 Backtest Date Range 🕘
This group allows you to focus testing on a specific historical period.
* Limit Date Range: Enables date filtering.
* Start time: The date and time when the strategy will start analyzing and opening deals.
* End time: The date and time after which the strategy will stop opening new deals and complete testing.
// ------------------------
8. 🎨 Visualization 🎨
All the options responsible for the appearance and information content of the chart are collected here.
* Show PnL labels: Enables/disables the display of text labels with the result (profit/loss) after closing each trade.
* Statistics Table: Enables/disables the main dashboard with detailed statistics on the results of the backtest.
* Strategy Settings Table: Enables/disables an additional panel that summarizes all the key parameters of the current configuration.
* Monthly Profit Table: Enables/disables a table with a breakdown of percentage returns by month and year.
* Table settings: For each of the three tables, you can individually adjust the Text size and Table Position on the screen to position them as conveniently as possible.
* Decimal places: Defines how many decimal places will be displayed in numeric values in tables and on labels.
// ------------------------
9. ✉️ Webhook Settings ✉️
This group is intended for traders who want to automate trading on strategy signals using third-party services and exchanges (for example, 3Commas, WunderTrading, Cryptorobotics, Cryptohopper, Bitsgap, Binance, ByBit, OKX, Pionex, Bitget or proprietary solutions).
For each key event in the strategy, there is a separate switch and a text field:
* Webhook for Open: Enable and set a message for the webhook that will be sent when the base order is opened.
* Webhook for Averaging: A message sent when executing any insurance order.
* Webhook for Take Profit: A message sent when closing on take profit (including partial ones).
* Webhook for Stop-Loss: A message sent when a stop loss is closed.
You can insert a JSON code or any other message format that your service requires for automation into the text fields. The strategy supports special placeholders (for example, `{{strategy.order.alert_message}}`), which allow you to dynamically insert the necessary data into the message, such as the amount of USDT or the percentage of the deposit for entry, averaging and take profit orders.


Valid H/L Strategy Tester with MFE/MAE Analytics
## Overview
A data-driven trading indicator that identifies valid high/low price levels and provides statistical insights through Maximum Favorable Excursion (MFE) and Maximum Adverse Excursion (MAE) analytics. Make informed trading decisions based on historical price behavior rather than guesswork.
## Key Features
### 🎯 Smart Pattern Recognition
- Automatically detects valid highs and lows with confirmation system
- Color-coded candles and lines for clear visual identification
- Inside/Outside print filtering for higher probability setups
### 📊 Statistical Analytics
- Analyzes up to 500 historical setups for MFE/MAE calculations
- 1-hour and 3-hour timeframe data with percentile-based targets (20th, 50th, 80th)
- Real-time performance tracking with comprehensive statistics table
### ⚙️ Flexible Strategy Options
**Entry Methods:** Confirmation-based or MAE percentile entries
**Take Profit:** MFE-based, fixed points, percentage, or R:R ratio targets
**Risk Management:** Multiple stop loss types with position sizing controls
### 🕐 Advanced Time Filtering
- Session filters (Asia, London, New York)
- Individual hourly controls (24-hour precision in ET)
- Pre-configured for optimal NY trading hours (9 AM - 2 PM)
### 📈 Visual Dashboard
- MFE target lines (blue) and MAE risk lines (orange)
- Customizable colors, styles, and line weights
- Statistics table showing daily/hourly/weekly performance breakdowns
## How It Works
1. **Pattern Detection** - Scans for valid high/low formations using price structure and gap behavior
2. **Statistical Analysis** - Calculates historical MFE/MAE percentiles from past setups
3. **Trade Framework** - Executes entries/exits based on your configuration with real-time performance tracking
## Ideal For
- **Day/Swing Traders** seeking data-driven entry/exit levels
- **Risk Managers** wanting historical drawdown data for stop placement
- **Performance Trackers** needing detailed analytics across timeframes and sessions
- **Flexible Strategies** - adapts to scalping, day trading, or swing trading styles
## Quick Setup
1. Select analysis timeframe (default: 5-minute)
2. Choose entry method and exit strategy
3. Enable MFE/MAE analytics display
4. Apply session/hourly filters
5. Customize visual elements and table settings
Transform your trading from guesswork to statistical precision with historical price behavior insights.
