Fibonacci Projection with Volume & Delta Profile (Zeiierman)█ Overview
Fibonacci Projection with Volume & Delta Profile (Zeiierman) blends classic Fibonacci swing analysis with modern volume-flow reading to create a unified, projection-based market framework. The indicator automatically detects the latest swing high and swing low, builds a complete Fibonacci structure, and then projects future extension targets with clear visual pathways.
What makes this tool unique is the integration of two volume-based systems directly into the Fibonacci structure. A Fib-aligned Volume Profile shows how bullish and bearish volume accumulated inside the swing range, while a separate Delta Profile reveals the imbalance of buy–sell pressure inside each Fibonacci interval. Together, these elements transform the standard Fibonacci tool into a multi-dimensional structural and volume-flow map.
█ How It Works
The indicator first detects the most recent swing high and swing low using the Period setting. That swing defines the Fibonacci range, from which the script draws retracement levels (0.236–0.786) and builds a forward projection path using the chosen Projection Level and a 1.272 extension.
Along this path, it draws projection lines, target boxes, and percentage labels that show how far each projected leg extends relative to the previous one.
Inside the same swing range, the script builds a Fib-based Volume Profile by splitting price into rows and assigning each bar’s volume as bullish (close > open) or bearish (close ≤ open). On top of that, it calculates a Volume Delta Profile between each pair of fib levels, showing whether buyers or sellers dominated that band and how strong that imbalance was.
█ How to Use
This tool helps traders quickly understand market structure and where the price may be heading next. The projection engine shows the most likely future targets, highlights strong or weak legs in the move, and updates automatically whenever a new swing forms. This ensures you always see the most relevant and up-to-date projection path.
The Fib Volume Profile shows where volume supported the move and where it did not. Thick bullish buckets reveal zones where buyers stepped in aggressively, often becoming retestable support. Thick bearish buckets highlight zones of resistance or rejection, particularly useful if projected levels align with prior liquidity.
The Delta Profile adds a second dimension to volume reading by showing where buy–sell pressure was truly imbalanced. A projected Fibonacci target that aligns with a strong bullish delta, for example, may suggest continuation. A projection into a band dominated by bearish delta may warn of reversal or hesitation.
█ Settings
Period – bars used to determine swing high/low
Projection Level – chosen Fib ratio for projection path
-----------------
Disclaimer
The content provided in my scripts, indicators, ideas, algorithms, and systems is for educational and informational purposes only. It does not constitute financial advice, investment recommendations, or a solicitation to buy or sell any financial instruments. I will not accept liability for any loss or damage, including without limitation any loss of profit, which may arise directly or indirectly from the use of or reliance on such information.
All investments involve risk, and the past performance of a security, industry, sector, market, financial product, trading strategy, backtest, or individual's trading does not guarantee future results or returns. Investors are fully responsible for any investment decisions they make. Such decisions should be based solely on an evaluation of their financial circumstances, investment objectives, risk tolerance, and liquidity needs.
Statistics

JINN: A Multi-Paradigm Quantitative Trading and Execution EngineI. Core Philosophy: A Substitute for Static Analysis
JINN (Joint Investment Neural and Network) represents a paradigm shift from static indicators to a living, adaptive analytical ecosystem. Traditional tools provide a fixed snapshot of the market. JINN operates on a fundamentally different premise: it treats the market as a dynamic, regime-driven system. It processes market data through a hierarchical suite of advanced, interacting models, arbitrates their outputs through a rules-based engine, and adapts its own logic in real-time.
It is designed as a complete framework for traders who think in terms of statistical edge, market regimes, probabilistic outcomes, and adaptive risk management.
II. The JINN Branded Architecture: Your Command and Control Centre
JINN’s power emerges from the synergy of its proprietary, branded architectural components. You do not simply "use" JINN; you command its engines.
1. JINN Signal Arbitration (JSA) Engine
The heart of JINN. The JSA is your configurable arbitration desk for weighing evidence from all internal models. As the Head Strategist, you define the entire arbitration philosophy:
• Priority and Weighting : Define a "chain of command". Specify which model's opinion must be considered first and assign custom weights to their outputs, directly controlling the hierarchy of your analytical flow.
• Arbitration Modes :
First Wins: For high-conviction, rapid signal deployment based on your most trusted leading model.
Highest Score: A "best evidence" approach that runs a full analysis and selects the signal with the highest weighted probabilistic backing.
Consensus: An ultra-conservative, "all-clear" mode that requires a unanimous pass from all active models, ensuring maximum confluence.
2. JINN Threshold Fusion (JTF) Engine
Static entry thresholds can be limiting in a dynamic market. The JTF engine replaces them with a robust, adaptive "breathing" channel.
• Kalman Filter Core : A noise-reducing, parametric filter that provides a smooth, responsive centre for the entry bands.
• Exponentially Weighted Quantile (EWQ) : A non-parametric, robust measure of the signal's recent distribution, resistant to outliers.
• Dynamic Fusion : The JTF engine intelligently fuses these two methodologies. In stable conditions, it can blend them; in volatile conditions, it can be configured to use the "Minimum Width" of the two, ensuring your entry criteria are always the most statistically relevant.
3. JINN Pattern Veto (JPV) with Dynamic Time Warping
The definitive filter for behavioural edge and pattern recognition. The JPV moves beyond value-based analysis to analyse the shape of market dynamics.
• Dynamic Time Warping (DTW) : A powerful algorithm from computer science that compares the similarity of time series.
• Pattern Veto : Define a "toxic" price action template—a pattern that has historically preceded failed signals. If the JPV detects this pattern, it will veto an otherwise valid trade, providing a sophisticated layer of qualitative, shape-based filtering.
4. JINN Flow VWAP
This is not a standard VWAP. The JINN Flow VWAP is an institutionally-aware variant that analyses volume dynamics to create a "liquidity pressure" band. It helps visualise and gate trades based on the probable activity of larger market participants, offering a nuanced view of where significant flow is occurring.
III. The Advanced Model Suite: Your Pre-Built Quantitative Toolkit
JINN provides you with a turnkey suite of institutional-grade models, saving you thousands of hours of research and development.
1. Auto-Tuning Hyperparameters Engine (Online Meta-Learning)
Markets evolve. A static strategy is an incomplete strategy. JINN’s Auto-Tuning engine is a meta-learning layer inspired by the Hedge (EWA) algorithm, designed to combat alpha decay.
• Portfolio of Experts : It treats a curated set of internal strategic presets as a portfolio of "experts".
• Adaptive Weighting : It runs an online learning algorithm that continuously measures the risk-adjusted performance of each expert (using a sophisticated reward function blending Expected Value and Brier Score).
• Dynamic Adaptation : The engine dynamically allocates more influence to the expert strategy that is performing best in the current market regime, allowing JINN’s core logic to adapt without manual intervention.
2. Lorentzian Classification and PCA-Lite EigenTrend
• Lorentzian Engine : A powerful probabilistic classifier that generates a continuous probability (0-1) of market state. Its adaptive, volatility-scaled distribution is specifically designed to handle the "fat tails" and non-Gaussian nature of financial returns.
• PCA-Lite EigenTrend : A Principal Component Analysis engine. It reduces the complex, multi-dimensional data from the Technical and Order-Flow ensembles into a single, maximally descriptive "EigenTrend". This factor represents the dominant, underlying character of the market, providing a pure, decorrelated input for the Lorentzian engine and other modules.
3. Adaptive Markov Chain Model
A forward-looking, state-based model that calculates the probability of the market transitioning between Uptrend, Downtrend, and Sideways states. Our implementation is academically robust, using an EMA-based adaptive transition matrix and Laplace Smoothing to ensure stability and prevent model failure in sparse data environments.
IV. The Execution Layer: JINN Execution Latch Options
A good signal is worthless without intelligent execution. The JINN Execution Latch is a suite of micro-rules and safety mechanisms that govern the "last mile" of a trade, ensuring signals are executed only under optimal, low-risk conditions. This is your final pre-flight check.
• Execution Latch and Dynamic Cool-Down : A core safety feature that enforces a dynamic cool-down period after each trade to prevent over-trading in choppy, whipsaw markets. The latch duration intelligently adapts, using shorter periods in low-volatility and longer periods in high-volatility environments.
• Volatility-Scaled Real-Time Threshold : A sophisticated gate for real-time entries. It dynamically raises the entry threshold during sudden spikes in volatility, effectively filtering out noise and preventing entries based on erratic, unsustainable price jerks.
• Noise Debounce : In market conditions identified as "noisy" by the Shannon Entropy module, this feature requires a real-time signal to persist for an extra tick before it is considered valid. This is a simple but powerful heuristic to filter out fleeting, insignificant price flickers.
• Liquidity Pressure Confirmation : An institutional-grade check. This gate requires a minimum threshold of "Liquidity Pressure" (a measure of volume-driven momentum) to be present before validating a real-time signal, ensuring you are entering with market participation on your side.
• Time-of-Day (ToD) Weighting : A practical filter that recognises not all hours of the trading day are equal. It can be configured to automatically raise entry thresholds during historically low-volume, low-liquidity sessions (e.g., lunch hours), reducing the risk of entering trades on "fake" moves.
• Adaptive Expectancy Gate : A self-regulating feedback mechanism. This gate monitors the strategy's recent, realised performance (its Expected Value). If the rolling expectancy drops below a user-defined threshold, the system automatically tightens its entry criteria, becoming more selective until performance recovers.
• Bar-Close Quantile Confirmation : A final layer of confirmation for bar-close signals. It requires the signal's final score to be in the top percentile (e.g., 85th percentile) of all signal scores over a lookback period, ensuring only the highest conviction signals are taken.
V. The Contextual and Ensemble Frameworks
1. Multi-Factor Ensembles and Bayesian Fusion
JINN is built on the principle of diversification. Its signals are derived from two comprehensive, fully customizable ensembles:
• Technical Ensemble : A weighted combination of over a dozen technical features, from cyclical analysis (MAMA, Hilbert Transforms) and momentum (Fisher Transform) to trend efficiency (KAMA, Fractal Efficiency Ratio).
• Order-Flow Ensemble : A deep dive into market microstructure, incorporating Volume Delta, Absorption, Imbalance, and Delta Divergence to decode institutional footprints.
• Bayesian Fusion : Move beyond simple AND/OR logic. JINN’s Bayesian engine allows you to probabilistically combine evidence from trend and order-flow filters, weighing each according to its perceived reliability to derive a final posterior probability.
2. Context-Aware Framework and Entropy Engine
JINN understands that a successful strategy requires not just a good entry, but an intelligent exit and a dynamic approach to risk.
• Shannon Entropy Filter : A direct application of information theory. JINN quantifies market randomness and allows you to set a precise entropy ceiling to automatically halt trading in unpredictable, high-entropy conditions.
• Adaptive Exits and Regime Awareness : The script uses its entropy-derived regime awareness to dynamically scale your Take Profit and Trailing Stop parameters . It can be configured to automatically take smaller profits in choppy markets and let winners run in strong trends, hard-coding adaptive risk management into your system.
VI. The Dashboard: Your Mission Control
JINN features a dynamic, dual-mode dashboard that provides a comprehensive, real-time overview of the entire system's state.
Mode 1: Signal Gate Metrics Dashboard
This dashboard is your pre-flight checklist. It displays the real-time Pass/Fail/Off status of every single gating and filtering component within JINN, including:
• Core Ensembles : Technical and Order-Flow Ensemble status.
• Trend Filters : VWAP, VWMA, ADX, ATR Slope, and Linear Regression Angle gates.
• Advanced Models : Dual-Lorentzian Consensus, Markov Probability, and JPV Veto status.
• Regime and Safety : Shannon Entropy, Execution Latch, and Expectancy Gate status.
• Final Confirmation : A master "All Hard Filters" status, giving you an at-a-glance confirmation of system readiness.
Mode 2: Quantitative Metrics Dashboard
This dashboard provides a high-level, institutional-style data readout of the current market state, as seen through JINN's analytical lens. It includes over 60 key metrics for both Signal Gate and Quantitative Metrics, such as:
• Ensemble and Confidence Scores : The raw numerical output of the Technical, Order-Flow, and Lorentzian models.
• Volatility and Volume Analysis : Realised Volatility (%), Relative Volume, Volume Sigma Score, and ATR Z-Score.
• Momentum and Market Position : ADX, RSI Z-Score, VWAP Distance (%), and Distance from 252-Bar High/Low.
• Regime Metrics : The numerical value of the Shannon Entropy score and the Model Confidence score.
VII. The User as the Head Strategist
With over 178 meticulously designed user inputs, JINN is the ultimate "glass box" engine. The internal code is proprietary, but the control surface is transparent and grants you architectural-level command.
• Prototype Sophisticated Strategies : Test complex, multi-model theses at your own pace that would otherwise take weeks of coding. Want to test a strategy that uses a Lorentzian classifier driven by the EigenTrend, arbitrated by JSA in "highest score" mode, and filtered by a strict Markov trend gate? These can be configured and unified.
• Tune the Engine to Any Market : The inputs provide the control surface to optimise JINN's behaviour for specific assets and timeframes, from crypto scalping to swing trading indices.
• Build Trust Through Configuration : The granular controls allow you to align the script's behaviour precisely with your own market view, building trust in your own deployment of the tool.
JINN is a commitment. It is a tool for the serious analyst who seeks to move from discretionary trading to a systematic, quantitative, and adaptive approach. If this aligns with your philosophy, we invite you to apply for access.
Disclaimer
This script is for informational and educational purposes only. It does not constitute financial, investment, or trading advice, nor is it a recommendation to buy or sell any asset.
All trading and investment decisions are the sole responsibility of the user. It is strongly recommended to thoroughly test any strategy on a paper trading account for at least one week before risking real capital.
Trading financial markets involves a high risk of loss, and you may lose more than your initial investment. Past performance is not indicative of future results. The developer is not responsible for any losses incurred from the use of this script.

SCOTTGO - Day Trade Stock Quote V4This Pine Script indicator, titled "SCOTTGO - Day Trade Stock Quote V4," is a comprehensive, customizable dashboard designed for active traders. It acts as a single, centralized reference point, displaying essential financial and technical data directly on your chart in a compact table overlay.
📊 Key Information Provided
The indicator is split into sections, aggregating various critical data points to provide a holistic picture of the stock's current state and momentum:
1. Ownership & Short Flow
This section provides fundamental context and short-interest data:
Market Cap, Shares Float, and Shares Outstanding: Key figures on the company's size and publicly tradable shares.
Short Volume %: Indicates the percentage of trading activity driven by short sellers.
Daily Change %: Shows the day's price movement relative to the previous close.
2. Price & Volatility
This tracks historical and immediate price levels:
Previous Close, Day High/Low: Key daily reference prices.
52-Week High/Low: Important long-term boundaries.
Earnings Date: A crucial fundamental date (currently displayed as a placeholder).
3. Momentum & Volume
These metrics are essential for understanding intraday buying and selling pressure:
Volume & Average Volume: The current trade volume compared to its historical average.
Relative Volume (RVOL): Measures how much volume is currently trading compared to the average rate for that time period (shown for both Daily and 5-Minute rates).
Volume Buzz (%): A percentage representation of how much current volume exceeds or falls below the average.
ADR % & ATR %: Measures of volatility.
RSI, U/D Ratio, and P/E Ratio: Momentum and valuation indicators.
4. Context
This provides background information on the security:
Includes the Symbol, Exchange, Industry, and Sector (note: some fields use placeholder data as this information is not always available via Pine Script).
⚙️ Customization
The dashboard is highly customizable via the indicator settings:
You can control the visibility of every single metric using the Section toggles.
You can change the position (Top Left, Top Right, etc.), size, and colors of the entire table.
In summary, this script is a powerful tool for day traders who need to monitor a large number of fundamental, technical, and volatility metrics simultaneously without cluttering the main chart area.

NYSE CME Market Session Clock This indicator can only work on short-term timeframes, since the time before the opening and before the closing of the session is updated only with the appearance of a new candle.

FRAN CRASH PLAY RULESPurpose
It creates a fixed information panel in the top right corner of your chart that shows the "FRAN CRASH PLAY RULES" - a checklist of criteria for identifying potential crash play setups.
Key Features
Display Panel:
Shows 5 trading rules as bullet points
Permanently visible in the top right corner
Stays fixed while you scroll or zoom the chart
Current Rules Displayed:
DYNAMIC 3 TO 5 LEG RUN
NEAR VERTICAL ACCELERATION
FINAL BAR OF THE RUN UP MUST BE THE BIGGEST
3 FINGER SPREAD / DUAL SPACE
ATLEAST 2 OF 5 CRITERIA NEEDS TO HIT
Customization Options:
Editable Text - Change any of the 5 rules through the settings
Text Color - Adjust the color of the text
Text Size - Choose from tiny, small, normal, large, or huge
Background Color - Customize the panel background and transparency
Frame Color - Change the border color
Show/Hide Frame - Toggle the border on or off
Use Case
This indicator serves as a constant visual reminder of your trading strategy criteria, helping you stay disciplined and only take trades that meet your specific crash play requirements. It's essentially a "cheat sheet" that lives on your chart so you don't have to memorize or look elsewhere for your trading rules.

VB Finviz-style MTF Screener📊 VB Multi-Timeframe Stock Screener (Daily + 4H + 1H)
A structured, high-signal stock screener that blends Daily fundamentals, 4H trend confirmation, and 1H entry timing to surface strong trading opportunities with institutional discipline.
🟦 1. Daily Screener — Core Stock Selection
All fundamental and structural filters run strictly on Daily data for maximum stability and signal quality.
Daily filters include:
📈 Average Volume & Relative Volume
💲 Minimum Price Threshold
📊 Beta vs SPY
🏢 Market Cap (Billions)
🔥 ATR Liquidity Filter
🧱 Float Requirements
📘 Price Above Daily SMA50
🚀 Minimum Gap-Up Condition
This layer acts like a Finviz-style engine, identifying stocks worth trading before momentum or timing is considered.
🟩 2. 4H Trend Confirmation — Momentum Check
Once a stock passes the Daily screen, the 4-hour timeframe validates trend strength:
🔼 Price above 4H MA
📈 MA pointing upward
This removes structurally good stocks that are not in a healthy trend.
🟧 3. 1H Entry Alignment — Timing Layer
The Hourly timeframe refines near-term timing:
🔼 Price above 1H MA
📉 Short-term upward movement detected
This step ensures the stock isn’t just good on paper—it’s moving now.
🧪 MTF Debug Table (Your Transparency Engine)
A live diagnostic table shows:
All Daily values
All 4H checks
All 1H checks
Exact PASS/FAIL per condition
Perfect for tuning thresholds or understanding why a ticker qualifies or fails.
🎯 Who This Screener Is For
Swing traders
Momentum/trend traders
Systematic and rules-based traders
Traders who want clean, multi-timeframe alignment
By combining Daily fundamentals, 4H trend structure, and 1H momentum, this screener filters the market down to the stocks that are strong, aligned, and ready.

ZynIQ Volatility Master Pro v2 - (Pro Plus Pack)Overview
ZynIQ Volatility Master Pro v2 analyses expansion and contraction in price behaviour using adaptive volatility logic. It highlights periods of compression, breakout potential and increased directional movement, helping traders understand when the market is shifting between quiet and active phases.
Key Features
• Multi-layer volatility modelling
• Adaptive compression and expansion detection
• Optional trend-aware volatility colouring
• Configurable sensitivity for different assets and timeframes
• Clean visual presentation designed for intraday and swing analysis
• Complements breakout, trend, structure and volume indicators
Use Cases
• Identifying contraction phases before expansion
• Filtering trades during low-volatility conditions
• Spotting volatility increases that accompany breakouts
• Combining volatility context with your other tools for confluence
Notes
This tool provides volatility context and regime awareness. It is not a trading system on its own. Use it with your preferred confirmation and risk management.

ZynIQ Order Block Master Pro v2 - (Pro Plus Pack)Overview
ZynIQ Order Block Master Pro v2 identifies areas where price showed strong displacement and left behind significant zones of interest. It highlights potential reaction areas, continuation blocks and mitigation zones based on structural behaviour and directional flow.
Key Features
• Automatic detection of bullish and bearish order block zones
• Optional refinement filters for higher-quality zones
• Displacement-aware logic to reduce weak signals
• Optional mitigation markers when price revisits a zone
• Configurable sensitivity for different markets and timeframes
• Clean labels and minimal chart clutter
• Complements structure, liquidity and FVG tools
Use Cases
• Highlighting key reaction areas based on previous strong moves
• Tracking potential continuation or reversal zones
• Combining order blocks with BOS/CHOCH and liquidity mapping
• Building confluence with breakout or volume tools
Notes
This tool provides contextual price zones based on displacement and structural movement. It is not a standalone trading system. Use with your own confirmation and risk management.

ZynIQ Market Regime Master Pro v2 - (Pro Plus Pack)Overview
ZynIQ Market Regime Master Pro v2 identifies shifts in market conditions by analysing volatility, directional flow and structural behaviour. It highlights when the market transitions between trending, ranging, expansion and contraction phases, giving traders clearer context for decision making.
Key Features
• Multi-factor regime detection (trend, range, expansion, contraction)
• Adaptive volatility and momentum analysis
• Direction-aware colour transitions
• Optional HTF regime overlay
• Configurable sensitivity to match different markets
• Clean visuals suitable for intraday or swing trading
• Complements trend, breakout, liquidity and volume tools
Use Cases
• Determining whether the market is trending or ranging
• Identifying expansion phases vs contraction phases
• Filtering signals during unfavourable regimes
• Combining regime context with structure or breakout tools
Notes
This tool provides regime classification and contextual analysis. It is not a trading system by itself. Use with your own confirmation and risk management.

ZynIQ Core Pro Suite v2 - (Pro Plus Pack)Overview
ZynIQ Breakout Core Pro Suite v2 is an advanced breakout engine designed to analyse compression, expansion and directional bias with high precision. It incorporates multi-factor filtering, adaptive volatility logic and refined breakout mapping to highlight moments where the market transitions from contraction to expansion.
Key Features
• Adaptive breakout zones with refined volatility filters
• Direction-aware breakout confirmation
• Optional multi-stage filtering for higher-quality expansions
• Pullback and continuation gating to reduce noise
• Integrated structure awareness for more reliable triggers
• Clean labels and minimal chart clutter
• Optimised for intraday, swing and high-volatility markets
Use Cases
• Identifying structurally significant breakout points
• Avoiding false expansions during low-volatility phases
• Combining breakout logic with trend, structure or volume tools
• Mapping expansion phases after compression builds
Notes
This tool provides structural and volatility-aware breakout context. It is not a complete trading system. Use with your own confirmation tools and risk management.

ZynIQ FVG Master Pro v2 - (Pro Pack)Overview
ZynIQ FVG Master v2 (Pro) identifies fair value gaps and highlights key imbalance zones within price action. It includes detection for standard and extended FVGs, optional mitigation logic and context filters to help traders understand where inefficiencies may be filled.
Key Features
• Detection of regular and extended FVGs
• Optional mitigation and fill markers
• Configurable minimum gap size and sensitivity
• Direction-aware colour coding
• Optional smart filtering to reduce low-quality gaps
• Clean visuals designed for intraday and swing analysis
• Can be used alongside structure and liquidity tools for confluence
Use Cases
• Identifying imbalance zones likely to be revisited
• Spotting high-probability mitigation areas
• Combining FVGs with BOS/CHOCH or liquidity sweeps
• Mapping context for continuation and reversal setups
Notes
This tool provides FVG and imbalance context. It is not a standalone trading system. Use with your preferred confirmation and risk management.

ZynIQ Liquidity Master Pro v2 - (Pro Pack)Overview
ZynIQ Liquidity Master v2 (Pro) identifies key liquidity pools and sweep zones using automated swing logic, equal-high/low detection and multi-level liquidity mapping. It provides a clear view of where liquidity may be resting above or below price, helping traders understand potential sweep or mitigation behaviour.
Key Features
• Automatic detection of EQH/EQL (equal highs/lows)
• Mapping of major swing liquidity zones
• Optional PDH/PDL (previous day high/low) and weekly levels
• Detection of potential liquidity sweep areas
• Clean labels for swing points and liquidity clusters
• Configurable sensitivity for different markets or timeframes
• Lightweight visuals with minimal clutter
Use Cases
• Identifying major liquidity pools above or below price
• Spotting potential sweep conditions before reversals
• Anchoring market structure or FVG tools with liquidity context
• Understanding where price may target during expansion moves
Notes
This tool identifies areas of resting liquidity based on swing and equal-high/low logic. It is not a standalone trading system. Use with your preferred confirmation and risk management.

ZynIQ Market Structure Master v2 - (Pro Pack)Overview
ZynIQ Market Structure Master v2 (Pro) maps structural shifts in price action using automated BOS/CHOCH detection, swing analysis and directional flow. It provides a clear view of when the market transitions between expansion, pullback and reversal phases.
Key Features
• Automated BOS (Break of Structure) and CHOCH detection
• Swing high/low mapping with optional filtering
• Directional flow logic for identifying trend vs reversal phases
• Optional EQ levels and mitigation markers
• Configurable structure sensitivity for different timeframes
• Clean labels and minimal clutter for fast interpretation
• Suitable for intraday and swing structure analysis
Use Cases
• Identifying key structural shifts in trend
• Spotting early reversal signals via CHOCH
• Assessing trend continuation vs distribution/accumulation
• Combining structure with liquidity, FVG or breakout tools
Notes
This tool provides structural context using break-of-structure and swing logic. It is not a trading system by itself. Use alongside your own confirmation and risk management.

ZynIQ Breakout Pro v2 - (Pro Pack)Overview
ZynIQ Breakout Pro v2 is an advanced breakout framework designed to identify high-quality expansion points from compression zones. It includes adaptive volatility filters, directional detection, optional confirmation logic and an integrated risk-mapping system for structured trade planning.
Key Features
• Adaptive breakout range detection with smart volatility filters
• Direction-aware breakout triggers
• Optional ADX or volatility conditions for confirmation
• Pullback gating to reduce low-quality continuation attempts
• Integrated Risk Helper for SL/TP structure
• Clean labels and minimal chart clutter
• Suitable for intraday and swing trading
Use Cases
• Identifying breakout moments with stronger confirmation
• Avoiding noise and clustering during choppy phases
• Structuring entries around expansion from compression
• Combining breakout signals with trend, momentum or volume tools
Notes
Breakout Pro v2 provides structural and volatility-aware breakout context. It is not a standalone trading system. Use with your own confirmation tools and risk management.

ZynIQ Trend Master V2 - (Pro Pack)Overview
ZynIQ Trend Master v2 (Pro) provides a structured, multi-layered approach to trend analysis. It combines volatility-aware trend detection, adaptive cloud colouring, and pullback signalling to help traders see trend strength, continuation phases and potential shift points with clarity.
Key Features
• Multi-profile trend modes (Scalping / Intraday / Swing)
• Adaptive trend cloud with colour transitions based on strength
• Volatility-aware pullback detection
• Optional HTF trend alignment
• Clean labels marking key transitions
• Configurable filters for smoothing and responsiveness
• Lightweight visuals for fast intraday charting
Use Cases
• Identifying conditions where trend strength is increasing or weakening
• Timing entries during pullbacks within a trend
• Aligning intraday and HTF directional bias
• Combining with breakout, volume or market structure tools for confirmation
Notes
This tool provides structured trend context and momentum flow. It is not a trading system on its own. Use with your preferred confirmation and risk management.

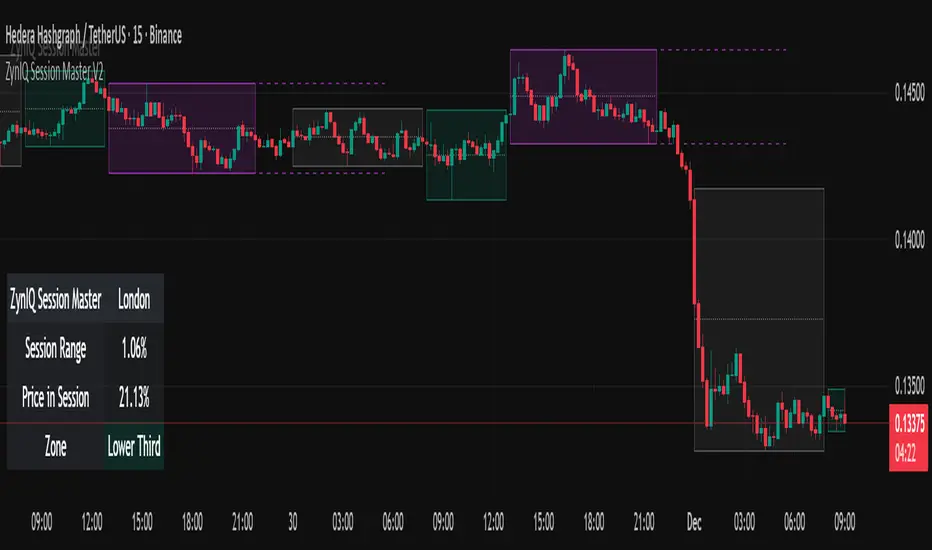
ZynIQ Session Master v2 - (Lite Pack)Overview
ZynIQ Session Master v2 (Lite) highlights key market sessions and their associated ranges, helping traders understand when volatility tends to shift between Asian, London and New York sessions. It provides clean visual context for intraday trading without overwhelming the chart.
Key Features
• Automatic detection and shading of major trading sessions
• Configurable session highlighting
• Optional range markers for Asia, London and New York
• Lightweight visuals suitable for fast intraday charting
• Simple session-based structure for context around volatility shifts
• Optional labels marking session transitions
Use Cases
• Seeing where session volatility typically increases
• Identifying when price is leaving a session range
• Timing trades around session opens
• Combining session structure with breakout, trend or momentum tools
Notes
This script provides session structure and volatility context. It is not a standalone trading system. Use alongside your preferred confirmation and risk management.
Weighted KDE Mode🙏🏻 The ‘ultimate’ typical value estimator, for the highest computational cost @ time complexity O(n^2). I am not afraid to say: this is the last resort BFG9000 you can ‘ever’ get to make dem market demons kneel before y’all
Quickguide
pls read it, you won’t find it anywhere else in open access
When to use:
If current market activity is so crazy || things on your charts are really so bad (contaminated data && (data has very heavy tails || very pronounced peak)), the only option left is to use the peak (mode) of Kernel Density Estimate , instead of median not even mentioning mean. So when WMA won’t help, when WPNR won’t help, you need this thing.
Setting it up:
Interval: choose what u need, you can use usual moving windows, but I also added yearly and session anchors alike in old VWAP (always prefer 24h instead of Session if your plan allows). Other options like cumulative window are also there.
Parameters: this script ain't no joke, it needs time to make calculations, so I added a setting to calculate only for the last N bars (when “starting at bar N” is put on 0). If it’s not zero it acts as a starting point after which the calculations happen (useful for backtesting). Other parameters keep em as they are, keep student5 kernel , turn off appropriate weights if u apply it to other than chart data, on other studies etc.
But instead of listening to me just experiment with parameters and see what they change, would take 5 mins max
Been always saying that VWAP is ish, not time-aware etc, volume info is incorporated in a lil bit wrong way… So I decided not just to fix VWAP (you can do it yourself in 5 mins), but instead to drop there the Ultimate xD typical value estimator that is ever possible to do. Time aware, volume / inferred volume aware, resistant to all kinds of BS. This is your shieldwall.
How it works:
You can easily do a weighted kernel density estimation, in our case including temporal and intensity information while accumulating densities. Here are some details worth mentioning about the thing:
Kernels are raw (not unit variance), that’s easier to work with later.
h_constants for each kernel were calculated ^^ given that ^^ with python mpmath module with high decimal precision.
In bandwidth calculation instead of using empirical standard deviation as a scaler, I use... ta.range(src, len) / math.sqrt(12)
...that takes data range and converts it to standard deviation, assuming data is uniformly distributed. That’s exactly what we need: a scaler that is coherent with the KDE, that has nothing to do with stdevs, as the kernels except for gaussian ones (that we don’t even need to use). More importantly, if u take multiple windows and see over time which distro they approach on the long term, that would be the uniform one (not the normal one as many think). Sometimes windows are multimodal, sometimes Laplace like etc, so in general all together they are uniform ish.
The one and only kernel you really need is Student t with v = 5 , for the use case I highlighted in the first part of the post for TV users. It’s as far as u can get until ish becomes crazy like undefined variance etc. It has the highest kurtosis = 9 of all distros, perfect for the real use case I mentioned. Otherwise, you don’t even need KDE 4 real, but still I included other senseful kernels for comparison or in case I am trippin there.
Btw, don’t believe in all that hype about Epanechnikov kernel which in essence is made from beta distribution with alpha = beta = 2, idk why folk call it with that weird name, it’s beta2 kernel. Yes on papers it really minimises AMISE (that’s how I calculated h constants for all dem kernels in the script), but for really crazy data (proper use case for us), it ain't provides even ‘closely’ compared with student5 kernel. Not much else to add.
Shout out to @RicardoSantos for inspiration, I saw your KDE script a long time ago brotha, finna got my hands on it.
∞

Normal Dist Deviation LevelsThis indicator shows where the current price sits within a normal-distribution “sigma” framework and projects those levels as short, local reference lines rather than full trailing bands.
It first calculates a moving average (SMA or EMA, user-selectable) over a chosen lookback length and the corresponding standard deviation of price around that mean. The mean is treated as the 0σ level, and fixed price levels are computed at ±1σ, ±2σ, and ±3σ from that mean for the most recent bar.
For each of these sigma prices, the script draws a short horizontal segment that spans only a limited number of candles into the past and into the future, giving clean local “price bars” instead of bands across the entire chart. The colors and line styles differentiate 0σ (blue), ±1σ (solid), ±2σ (dashed), and ±3σ (dotted), visually marking moderate to extreme deviations from the mean.
To make interpretation easier, the indicator also places text labels to the right of the price bars, a couple of candles ahead of the line ends. Each label shows both the statistical region and its approximate normal-distribution probability, such as “50% (0σ)”, “15.87% (+1σ / -1σ)”, “2.27% (+2σ / -2σ)”, and “0.14% (+3σ / -3σ)”, so you can quickly see how unusual the current deviation is in probabilistic terms.

CS Institutional X-Ray (Perfect Sync)Title: CS Institutional X-Ray
Description:
CS Institutional X-Ray is an advanced Order Flow and Market Structure suite designed to reveal what happens inside Japanese candles.
Most traders only see open and close prices. This indicator utilizes VSA (Volume Spread Analysis) algorithms and Synthetic Footprint Logic to detect institutional intervention, liquidity manipulation, and market exhaustion.
🧠 1. The Mathematical Engine: Synthetic Footprint
The core of this indicator is not based on moving average crossovers, but on market physics: Effort vs. Result.
The script scans every candle and calculates:
Buy/Sell Pressure: Analyzes the close position relative to the total candle range and weights it by volume.
Synthetic Delta: Calculates the net difference between buyer and seller aggression.
Volume Anomalies: Detects when volume is abnormally high (Institutional) or low (Retail).
The Absorption Logic: The indicator hunts for divergences between candle color and internal flow.
Example: If price drops hard (Red Candle) with massive volume, but the close moves away from the low, the algorithm detects that massive LIMIT orders absorbed the selling pressure. Result: Institutional Buy Signal.
📊 2. The Institutional Semaphore (Visual Guide)
The indicator automatically recolors candles to show the real state of the auction:
🔵 CYAN (Whale Buy): Bullish Absorption. Institutions buying aggressively or absorbing selling pressure at support.
🟣 MAGENTA (Whale Sell): Bearish Absorption. Institutions selling into strength or stopping a rally with sell walls.
⚪ GREY (Exhaustion/Zombie): "No-Trade" Zone. Volume is extremely low. The movement lacks institutional backing and is prone to failure.
🟢/🔴 Normal: Market in equilibrium.
🛡️ 3. Smart Zone System (Market Memory)
The indicator draws and manages Support and Resistance levels based on volume events, not just pivots.
Virgin Zones (Bright): When a "Whale" appears, a solid line is projected. If price has not touched it again, it is a high-probability bounce zone.
Automatic Mitigation: The exact moment price touches a line, the indicator detects the mitigation. The line turns Grey and Dotted, and the label dims. This keeps the chart clean, showing only what is relevant now.
☠️ 4. Manipulation Detector (Liquidity Grabs)
The system distinguishes between a normal reversal and a "Stop Hunt".
Signal: ☠️ GRAB
Logic: If price breaks a previous Low/High to sweep liquidity and closes with an absorption candle (Whale), it is marked as a "Grab." This is the system's most powerful reversal signal.
🧱 5. FVG with Liquidity Score
The indicator draws Fair Value Gaps (Imbalances) and assigns them a volume score.
"Vol: 3.0x": Indicates that the gap was created with 3 times the average volume, making it a much stronger price magnet than a standard FVG.
🚀 How to Trade with CS Institutional X-Ray
Identify the Footprint: Wait for a Cyan or Magenta candle to appear.
Validate the Trap: If the signal comes with a "☠️ GRAB" label, the probability of success increases drastically.
The Retest (Entry): Do not chase price. Place a Limit order on the generated Zone Line or at the edge of the FVG.
Management: Use opposite zones or mitigated zones (grey) as Take Profit targets.
Included Settings:
Fully configurable Alerts for Whales, Grabs, and Retests.
Total customization of colors and styles.

Bottom Up - Reverso ProReverso Pro by Bottom Up - Excess is the signal. Reversion is the edge.
Reverso is a mean reverting indicator that identifies market excesses and signals reversals for highly probable retracements to an average value.
Reverso's algorithm is extremely precise because it also takes into account the historical volatility of the instrument and constantly recalibrates itself dynamically without repainting.
This tool is suitable for mean-reversion traders who want to study EMA reactions, understand market trends, and refine entry/exit strategies based on price-memory dynamics.
Why Reverso Pro is different (This isn’t just another indicator)
Zero repainting – What you see is what you get. No tricks, no redraws, ever.
Dynamically adapts to the historical volatility of the instrument — works the same on Forex, stocks, indices, or some random crypto.
Constant real-time recalibration — adjusts instantly to volatility regime changes.
Fully adjustable sensitivity — From machine-gun signals for brutal scalping to only the most extreme deviations for monster-probability swing trades.
Native multi-timeframe control — Choose the timeframe used for signal calculation (5 min, 1H, daily, or custom). Reverso bends to your style.
When a Reverso signal fires:
Price has reached a statistically extreme deviation from its historical memory.
The probability of a snapback to the mean is at its peak.
It’s time to go counter-trend with the lowest risk and the highest reward possible.
Customization Options
You can use it on any timeframe and instrument.
You can customize also the timeframe over which the signals are processed to suit very fast scalping trading or to intercept slower and longer movements for swing trading.
The sensitivity of the indicator can also be customized to emit multiple signals or identify only the most extreme levels of deviation from the mean.
Add to chart. Turn on alerts. Happy trading!
Bottom Up - The Ecosystem Designed for Traders
bottomup.finance

Gaussian Hidden Markov ModelA Hidden Markov Model (HMM) is a statistical model that assumes an underlying process is a Markov process with unobservable (hidden) states. In the context of financial data analysis, a HMM can be particularly useful because it allows for the modeling of time series data where the state of the market at a given time depends on its state in the previous time period, but these states are not directly observable from the market data. When we say that a state is "unobservable" or "hidden," we mean that the true state of the process generating the observations at any time is not directly visible or measurable. Instead, what is observed is a set of data points that are influenced by these hidden states.
The HMM uses a set of observed data to infer the sequence of hidden states of the model (in our case a model with 3 states and Gaussian emissions). It comprises three main components: the initial probabilities, the state transition probabilities, and the emission probabilities. The initial probabilities describe the likelihood of starting in a particular state. The state transition probabilities describe the likelihood of moving from one state to another, while the emission probabilities (in our case emitted from Gaussian probability density functions, in the image red yellow and green Laplace probability densitty functions) describe the likelihood of the observed data given a particular state.
MODEL FIT
Posterior
By default, the indicator displays the posterior distribution as fitted by training a 3-state Gaussian HMM. The posterior refers to the probability distribution of the hidden states given the observed data. In the case of your Gaussian HMM with three states, the posterior represents the probabilities that the model assigns to each of these three states at each time point, after observing the data. The term "posterior" comes from Bayes' theorem, where it represents the updated belief about the model's states after considering the evidence (the observed data).
In the indicator, the posterior is visualized as the probability of the stock market being in a particular volatility state (high vol, medium vol, low vol) at any given time in the time series. Each day, the probabilities of the three states sum to 1, with the plot showing color-coded bands to reflect these state probabilities over time. It is important to note that the posterior distribution of the model fit tells you about the performance of the model on past data. The model calculates the probabilities of observations for all states by taking into account the relationship between observations and their past and future counterparts in the dataset. This is achieved using the forward-backward algorithm, which enables us to train the HMM.
Conditional Mean
The conditional mean is the expected value of the observed data given the current state of the model. For a Gaussian HMM, this would be the mean of the Gaussian distribution associated with the current state. It’s "conditional" because it depends on the probabilities of the different states the model is in at a given time. This connects back to the posterior probability, which assigns a probability to the model being in a particular state at a given time.
Conditional Standard Deviation Bands
The conditional standard deviation is a measure of the variability of the observed data given the current state of the model. In a Gaussian HMM, each state has its own emission probability, defined by a Gaussian distribution with a specific mean and standard deviation. The standard deviation represents how spread out the data is around the mean for each state. These bands directly relate to the emission probabilities of the HMM, as they describe the likelihood of the observed values given the current state. Narrow bands suggest a lower standard deviation, indicating the model is more confident about the data's expected range when in that state, while wider bands indicate higher uncertainty and variability.
Transition Matrix
The transition matrix in a HMM is a key component that characterizes the model. It's a square matrix representing the probabilities of transitioning from one hidden state to another. Each row of the transition matrix must sum up to 1 since the probabilities of moving from a given state to all possible subsequent states (including staying in the same state) must encompass all possible outcomes.
For example, we can see the following transition probabilities in our model:
Going from state X: to X (0.98), to Y (0.02), to Z (0)
Going from state Y: to X (0.03), to Y (0.96), to Z (0.01)
Going from state Z: to X (0), to Y (0.11), to Z (0.89)
MODEL TEST
When the "Test Out of Sample” option is enabled, the indicator plots models out-of-sample predictions. This is particularly useful for real-time identification of market regimes, ensuring that the model's predictive capability is rigorously tested on unseen data. The indicator displays the out of sample posterior probabilities which are calculated using the forward algorithm. Higher probability for a particular state indicate that the model is predicted a higher likelihood that the market is currently in that state. Evaluating the models performance on unseen data is crucial in understanding how well the model explains data that are not included in its training process.

Hurst Exponent - Detrended Fluctuation AnalysisIn stochastic processes, chaos theory and time series analysis, detrended fluctuation analysis (DFA) is a method for determining the statistical self-affinity of a signal. It is useful for analyzing time series that appear to be long-memory processes and noise.
█ OVERVIEW
We have introduced the concept of Hurst Exponent in our previous open indicator Hurst Exponent (Simple). It is an indicator that measures market state from autocorrelation. However, we apply a more advanced and accurate way to calculate Hurst Exponent rather than simple approximation. Therefore, we recommend using this version of Hurst Exponent over our previous publication going forward. The method we used here is called detrended fluctuation analysis. (For folks that are not interested in the math behind the calculation, feel free to skip to "features" and "how to use" section. However, it is recommended that you read it all to gain a better understanding of the mathematical reasoning).
█ Detrend Fluctuation Analysis
Detrended Fluctuation Analysis was first introduced by by Peng, C.K. (Original Paper) in order to measure the long-range power-law correlations in DNA sequences . DFA measures the scaling-behavior of the second moment-fluctuations, the scaling exponent is a generalization of Hurst exponent.
The traditional way of measuring Hurst exponent is the rescaled range method. However DFA provides the following benefits over the traditional rescaled range method (RS) method:
• Can be applied to non-stationary time series. While asset returns are generally stationary, DFA can measure Hurst more accurately in the instances where they are non-stationary.
• According the the asymptotic distribution value of DFA and RS, the latter usually overestimates Hurst exponent (even after Anis- Llyod correction) resulting in the expected value of RS Hurst being close to 0.54, instead of the 0.5 that it should be. Therefore it's harder to determine the autocorrelation based on the expected value. The expected value is significantly closer to 0.5 making that threshold much more useful, using the DFA method on the Hurst Exponent (HE).
• Lastly, DFA requires lower sample size relative to the RS method. While the RS method generally requires thousands of observations to reduce the variance of HE, DFA only needs a sample size greater than a hundred to accomplish the above mentioned.
█ Calculation
DFA is a modified root-mean-squares (RMS) analysis of a random walk. In short, DFA computes the RMS error of linear fits over progressively larger bins (non-overlapped “boxes” of similar size) of an integrated time series.
Our signal time series is the log returns. First we subtract the mean from the log return to calculate the demeaned returns. Then, we calculate the cumulative sum of demeaned returns resulting in the cumulative sum being mean centered and we can use the DFA method on this. The subtraction of the mean eliminates the “global trend” of the signal. The advantage of applying scaling analysis to the signal profile instead of the signal, allows the original signal to be non-stationary when needed. (For example, this process converts an i.i.d. white noise process into a random walk.)
We slice the cumulative sum into windows of equal space and run linear regression on each window to measure the linear trend. After we conduct each linear regression. We detrend the series by deducting the linear regression line from the cumulative sum in each windows. The fluctuation is the difference between cumulative sum and regression.
We use different windows sizes on the same cumulative sum series. The window sizes scales are log spaced. Eg: powers of 2, 2,4,8,16... This is where the scale free measurements come in, how we measure the fractal nature and self similarity of the time series, as well as how the well smaller scale represent the larger scale.
As the window size decreases, we uses more regression lines to measure the trend. Therefore, the fitness of regression should be better with smaller fluctuation. It allows one to zoom into the “picture” to see the details. The linear regression is like rulers. If you use more rulers to measure the smaller scale details you will get a more precise measurement.
The exponent we are measuring here is to determine the relationship between the window size and fitness of regression (the rate of change). The more complex the time series are the more it will depend on decreasing window sizes (using more linear regression lines to measure). The less complex or the more trend in the time series, it will depend less. The fitness is calculated by the average of root mean square errors (RMS) of regression from each window.
Root mean Square error is calculated by square root of the sum of the difference between cumulative sum and regression. The following chart displays average RMS of different window sizes. As the chart shows, values for smaller window sizes shows more details due to higher complexity of measurements.
The last step is to measure the exponent. In order to measure the power law exponent. We measure the slope on the log-log plot chart. The x axis is the log of the size of windows, the y axis is the log of the average RMS. We run a linear regression through the plotted points. The slope of regression is the exponent. It's easy to see the relationship between RMS and window size on the chart. Larger RMS equals less fitness of the regression. We know the RMS will increase (fitness will decrease) as we increases window size (use less regressions to measure), we focus on the rate of RMS increasing (how fast) as window size increases.
If the slope is < 0.5, It means the rate of of increase in RMS is small when window size increases. Therefore the fit is much better when it's measured by a large number of linear regression lines. So the series is more complex. (Mean reversion, negative autocorrelation).
If the slope is > 0.5, It means the rate of increase in RMS is larger when window sizes increases. Therefore even when window size is large, the larger trend can be measured well by a small number of regression lines. Therefore the series has a trend with positive autocorrelation.
If the slope = 0.5, It means the series follows a random walk.
█ FEATURES
• Sample Size is the lookback period for calculation. Even though DFA requires a lower sample size than RS, a sample size larger > 50 is recommended for accurate measurement.
• When a larger sample size is used (for example = 1000 lookback length), the loading speed may be slower due to a longer calculation. Date Range is used to limit numbers of historical calculation bars. When loading speed is too slow, change the data range "all" into numbers of weeks/days/hours to reduce loading time. (Credit to allanster)
• “show filter” option applies a smoothing moving average to smooth the exponent.
• Log scale is my work around for dynamic log space scaling. Traditionally the smallest log space for bars is power of 2. It requires at least 10 points for an accurate regression, resulting in the minimum lookback to be 1024. I made some changes to round the fractional log space into integer bars requiring the said log space to be less than 2.
• For a more accurate calculation a larger "Base Scale" and "Max Scale" should be selected. However, when the sample size is small, a larger value would cause issues. Therefore, a general rule to be followed is: A larger "Base Scale" and "Max Scale" should be selected for a larger the sample size. It is recommended for the user to try and choose a larger scale if increasing the value doesn't cause issues.
The following chart shows the change in value using various scales. As shown, sometimes increasing the value makes the value itself messy and overshoot.
When using the lowest scale (4,2), the value seems stable. When we increase the scale to (8,2), the value is still alright. However, when we increase it to (8,4), it begins to look messy. And when we increase it to (16,4), it starts overshooting. Therefore, (8,2) seems to be optimal for our use.
█ How to Use
Similar to Hurst Exponent (Simple). 0.5 is a level for determine long term memory.
• In the efficient market hypothesis, market follows a random walk and Hurst exponent should be 0.5. When Hurst Exponent is significantly different from 0.5, the market is inefficient.
• When Hurst Exponent is > 0.5. Positive Autocorrelation. Market is Trending. Positive returns tend to be followed by positive returns and vice versa.
• Hurst Exponent is < 0.5. Negative Autocorrelation. Market is Mean reverting. Positive returns trends to follow by negative return and vice versa.
However, we can't really tell if the Hurst exponent value is generated by random chance by only looking at the 0.5 level. Even if we measure a pure random walk, the Hurst Exponent will never be exactly 0.5, it will be close like 0.506 but not equal to 0.5. That's why we need a level to tell us if Hurst Exponent is significant.
So we also computed the 95% confidence interval according to Monte Carlo simulation. The confidence level adjusts itself by sample size. When Hurst Exponent is above the top or below the bottom confidence level, the value of Hurst exponent has statistical significance. The efficient market hypothesis is rejected and market has significant inefficiency.
The state of market is painted in different color as the following chart shows. The users can also tell the state from the table displayed on the right.
An important point is that Hurst Value only represents the market state according to the past value measurement. Which means it only tells you the market state now and in the past. If Hurst Exponent on sample size 100 shows significant trend, it means according to the past 100 bars, the market is trending significantly. It doesn't mean the market will continue to trend. It's not forecasting market state in the future.
However, this is also another way to use it. The market is not always random and it is not always inefficient, the state switches around from time to time. But there's one pattern, when the market stays inefficient for too long, the market participants see this and will try to take advantage of it. Therefore, the inefficiency will be traded away. That's why Hurst exponent won't stay in significant trend or mean reversion too long. When it's significant the market participants see that as well and the market adjusts itself back to normal.
The Hurst Exponent can be used as a mean reverting oscillator itself. In a liquid market, the value tends to return back inside the confidence interval after significant moves(In smaller markets, it could stay inefficient for a long time). So when Hurst Exponent shows significant values, the market has just entered significant trend or mean reversion state. However, when it stays outside of confidence interval for too long, it would suggest the market might be closer to the end of trend or mean reversion instead.
Larger sample size makes the Hurst Exponent Statistics more reliable. Therefore, if the user want to know if long term memory exist in general on the selected ticker, they can use a large sample size and maximize the log scale. Eg: 1024 sample size, scale (16,4).
Following Chart is Bitcoin on Daily timeframe with 1024 lookback. It suggests the market for bitcoin tends to have long term memory in general. It generally has significant trend and is more inefficient at it's early stage.

Fast Autocorrelation Estimator█ Overview:
The Fast ACF and PACF Estimation indicator efficiently calculates the autocorrelation function (ACF) and partial autocorrelation function (PACF) using an online implementation. It helps traders identify patterns and relationships in financial time series data, enabling them to optimize their trading strategies and make better-informed decisions in the markets.
█ Concepts:
Autocorrelation, also known as serial correlation, is the correlation of a signal with a delayed copy of itself as a function of delay.
This indicator displays autocorrelation based on lag number. The autocorrelation is not displayed based over time on the x-axis. It's based on the lag number which ranges from 1 to 30. The calculations can be done with "Log Returns", "Absolute Log Returns" or "Original Source" (the price of the asset displayed on the chart).
When calculating autocorrelation, the resulting value will range from +1 to -1, in line with the traditional correlation statistic. An autocorrelation of +1 represents a perfect correlation (an increase seen in one time series leads to a proportionate increase in the other time series). An autocorrelation of -1, on the other hand, represents a perfect inverse correlation (an increase seen in one time series results in a proportionate decrease in the other time series). Lag number indicates which historical data point is autocorrelated. For example, if lag 3 shows significant autocorrelation, it means current data is influenced by the data three bars ago.
The Fast Online Estimation of ACF and PACF Indicator is a powerful tool for analyzing the linear relationship between a time series and its lagged values in TradingView. The indicator implements an online estimation of the Autocorrelation Function (ACF) and the Partial Autocorrelation Function (PACF) up to 30 lags, providing a real-time assessment of the underlying dependencies in your time series data. The Autocorrelation Function (ACF) measures the linear relationship between a time series and its lagged values, capturing both direct and indirect dependencies. The Partial Autocorrelation Function (PACF) isolates the direct dependency between the time series and a specific lag while removing the effect of any indirect dependencies.
This distinction is crucial in understanding the underlying relationships in time series data and making more informed decisions based on those relationships. For example, let's consider a time series with three variables: A, B, and C. Suppose that A has a direct relationship with B, B has a direct relationship with C, but A and C do not have a direct relationship. The ACF between A and C will capture the indirect relationship between them through B, while the PACF will show no significant relationship between A and C, as it accounts for the indirect dependency through B. Meaning that when ACF is significant at for lag 5, the dependency detected could be caused by an observation that came in between, and PACF accounts for that. This indicator leverages the Fast Moments algorithm to efficiently calculate autocorrelations, making it ideal for analyzing large datasets or real-time data streams. By using the Fast Moments algorithm, the indicator can quickly update ACF and PACF values as new data points arrive, reducing the computational load and ensuring timely analysis. The PACF is derived from the ACF using the Durbin-Levinson algorithm, which helps in isolating the direct dependency between a time series and its lagged values, excluding the influence of other intermediate lags.
█ How to Use the Indicator:
Interpreting autocorrelation values can provide valuable insights into the market behavior and potential trading strategies.
When applying autocorrelation to log returns, and a specific lag shows a high positive autocorrelation, it suggests that the time series tends to move in the same direction over that lag period. In this case, a trader might consider using a momentum-based strategy to capitalize on the continuation of the current trend. On the other hand, if a specific lag shows a high negative autocorrelation, it indicates that the time series tends to reverse its direction over that lag period. In this situation, a trader might consider using a mean-reversion strategy to take advantage of the expected reversal in the market.
ACF of log returns:
Absolute returns are often used to as a measure of volatility. There is usually significant positive autocorrelation in absolute returns. We will often see an exponential decay of autocorrelation in volatility. This means that current volatility is dependent on historical volatility and the effect slowly dies off as the lag increases. This effect shows the property of "volatility clustering". Which means large changes tend to be followed by large changes, of either sign, and small changes tend to be followed by small changes.
ACF of absolute log returns:
Autocorrelation in price is always significantly positive and has an exponential decay. This predictably positive and relatively large value makes the autocorrelation of price (not returns) generally less useful.
ACF of price:
█ Significance:
The significance of a correlation metric tells us whether we should pay attention to it. In this script, we use 95% confidence interval bands that adjust to the size of the sample. If the observed correlation at a specific lag falls within the confidence interval, we consider it not significant and the data to be random or IID (identically and independently distributed). This means that we can't confidently say that the correlation reflects a real relationship, rather than just random chance. However, if the correlation is outside of the confidence interval, we can state with 95% confidence that there is an association between the lagged values. In other words, the correlation is likely to reflect a meaningful relationship between the variables, rather than a coincidence. A significant difference in either ACF or PACF can provide insights into the underlying structure of the time series data and suggest potential strategies for traders. By understanding these complex patterns, traders can better tailor their strategies to capitalize on the observed dependencies in the data, which can lead to improved decision-making in the financial markets.
Significant ACF but not significant PACF: This might indicate the presence of a moving average (MA) component in the time series. A moving average component is a pattern where the current value of the time series is influenced by a weighted average of past values. In this case, the ACF would show significant correlations over several lags, while the PACF would show significance only at the first few lags and then quickly decay.
Significant PACF but not significant ACF: This might indicate the presence of an autoregressive (AR) component in the time series. An autoregressive component is a pattern where the current value of the time series is influenced by a linear combination of past values at specific lags.
Often we find both significant ACF and PACF, in that scenario simply and AR or MA model might not be sufficient and a more complex model such as ARMA or ARIMA can be used.
█ Features:
Source selection: User can choose either 'Log Returns' , 'Absolute Returns' or 'Original Source' for the input data.
Autocorrelation Selection: User can choose either 'ACF' or 'PACF' for the plot selection.
Plot Selection: User can choose either 'Autocorrelarrogram' or 'Historical Autocorrelation' for plotting the historical autocorrelation at a specified lag.
Max Lag: User can select the maximum number of lags to plot.
Precision: User can set the number of decimal points to display in the plot.
