MACD+EMA crossovers Strategy customIt is a Strategy to use EMA crossover and MACD to decide when "buy" and when "sell", the key is spend some time "tuning" the parameters and using the simulation tool to find the best parameters for EMA and MACD there are 6 parameters, but with Excel and patience you could find the best configuration for the past and apply it to the future and see.
Strategy


Simple profitable trading strategyThis strategy has three components.
Philakones EMAs are a sequence of five fibonacci EMAs. They range from 55 candles (green) to 8 candles (red) in length. A strong trend or breakout is marked by the emas appearing in sequence of their length from 8 to 55 or vice versa. These EMAs are also used to signal an exit. Only two EMAs are used for exit signals - when the 13 EMA crosses over/under the 55 EMA.
RSI gives a bullish signal when 40 > rsi > 70. Exit signals are oversold (30) or overbought (70)
Stochastics give a bullish signal when stoch < 80 and an exit signal when > 95.
Results include 3 ticks of slippage and taker fees of .002. Provides a pretty smooth equity curve with a 73% win rate and beats buy and hold by than 10x (returns about 60x overall) since start of 2017.

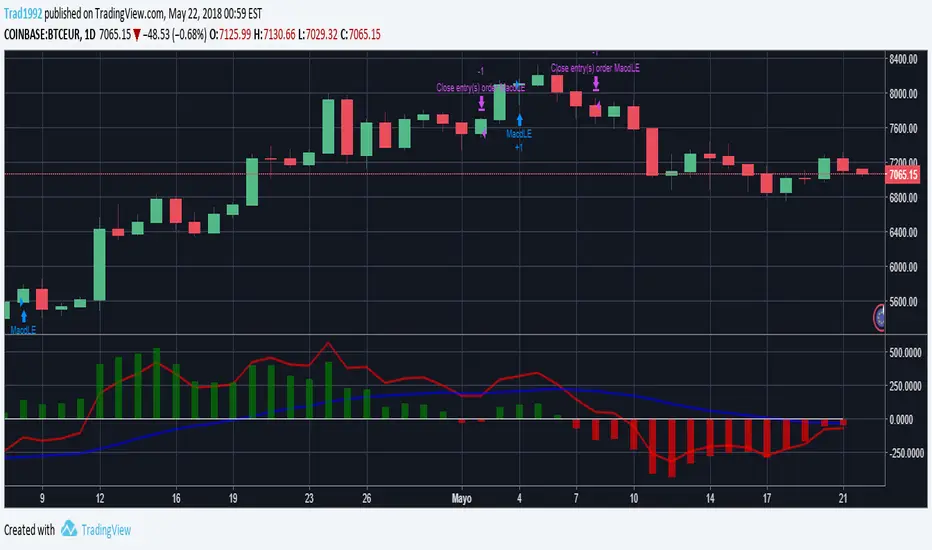
MACD Strategy custom for cryptosIt is a MACD with strategy simulation implemented to "tune" the MACD parameters for cryptos, it only use long and close strategy, not short
Try to go long at a moving averageA simple experimental strategy that tries to go long at a moving average bounce / support level, and looks for upside.

Average Directional Movement Index Rating Backtest The Average Directional Movement Index Rating (ADXR) measures the strength
of the Average Directional Movement Index (ADX). It's calculated by taking
the average of the current ADX and the ADX from one time period before
(time periods can vary, but the most typical period used is 14 days).
Like the ADX, the ADXR ranges from values of 0 to 100 and reflects strengthening
and weakening trends. However, because it represents an average of ADX, values
don't fluctuate as dramatically and some analysts believe the indicator helps
better display trends in volatile markets.
You can change long to short in the Input Settings
WARNING:
- For purpose educate only
- This script to change bars colors.

Vertical Horizontal Filter BacktestVertical Horizontal Filter was initiated by Adam White. It was first published
in a magazine called “Issues of Futures” in August, 1991. The Vertical Horizontal
Filter (VHF) is a very common Indicator used by traders to find out the Phase of
a Price Trend. Normally, a price trend can be in a Trending Phase or a Congestion
Phase/Choppy Movement Phase. Adam White created this particular Technical Indicator
to determine whether prices are trending in a particular direction or are they going
through a transitional period. He used it to measure the range of Futures available
in the market.
You can change long to short in the Input Settings
WARNING:
- For purpose educate only
- This script to change bars colors.

STARC Bands Backtest A type of technical indicator that is created by plotting two bands around
a short-term simple moving average (SMA) of an underlying asset's price.
The upper band is created by adding a value of the average true range
(ATR) - a popular indicator used by technical traders - to the moving average.
The lower band is created by subtracting a value of the ATR from the SMA.
STARC is an acronym for Stoller Average Range Channels. The indicator is
named after its creator, Manning Stoller.
You can change long to short in the Input Settings
WARNING:
- For purpose educate only
- This script to change bars colors.

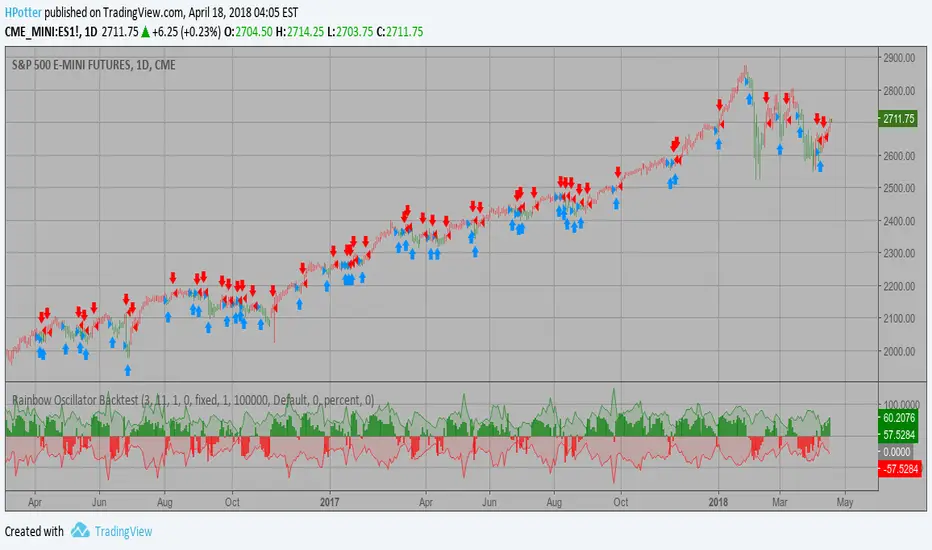
Rainbow Oscillator Backtest Ever since the people concluded that stock market price movements are not
random or chaotic, but follow specific trends that can be forecasted, they
tried to develop different tools or procedures that could help them identify
those trends. And one of those financial indicators is the Rainbow Oscillator
Indicator. The Rainbow Oscillator Indicator is relatively new, originally
introduced in 1997, and it is used to forecast the changes of trend direction.
As market prices go up and down, the oscillator appears as a direction of the
trend, but also as the safety of the market and the depth of that trend. As
the rainbow grows in width, the current trend gives signs of continuity, and
if the value of the oscillator goes beyond 80, the market becomes more and more
unstable, being prone to a sudden reversal. When prices move towards the rainbow
and the oscillator becomes more and more flat, the market tends to remain more
stable and the bandwidth decreases. Still, if the oscillator value goes below 20,
the market is again, prone to sudden reversals. The safest bandwidth value where
the market is stable is between 20 and 80, in the Rainbow Oscillator indicator value.
The depth a certain price has on a chart and into the rainbow can be used to judge
the strength of the move.
You can change long to short in the Input Settings
WARNING:
- For purpose educate only
- This script to change bars colors.
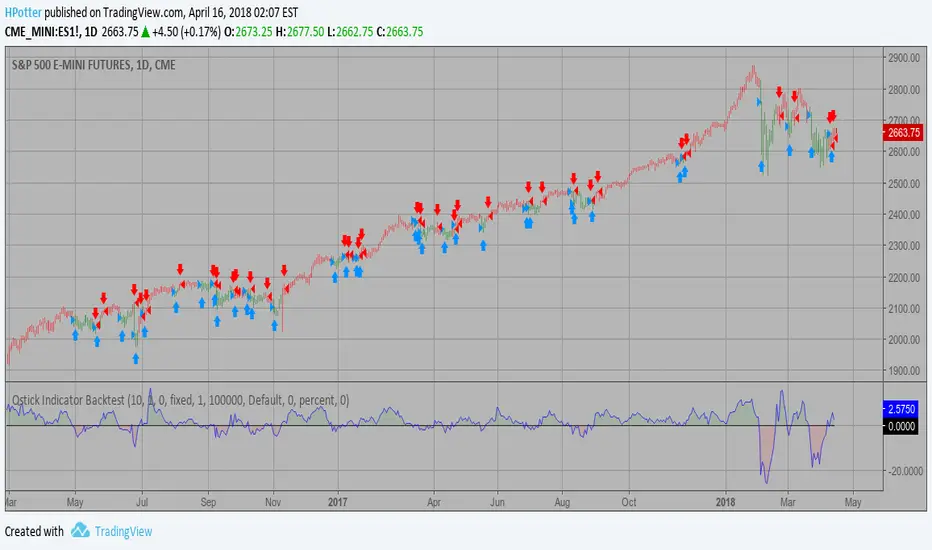
Qstick Indicator Backtest A technical indicator developed by Tushar Chande to numerically identify
trends in candlestick charting. It is calculated by taking an 'n' period
moving average of the difference between the open and closing prices. A
Qstick value greater than zero means that the majority of the last 'n' days
have been up, indicating that buying pressure has been increasing.
Transaction signals come from when the Qstick indicator crosses through the
zero line. Crossing above zero is used as the entry signal because it is indicating
that buying pressure is increasing, while sell signals come from the indicator
crossing down through zero. In addition, an 'n' period moving average of the Qstick
values can be drawn to act as a signal line. Transaction signals are then generated
when the Qstick value crosses through the trigger line.
You can change long to short in the Input Settings
WARNING:
- For purpose educate only
- This script to change bars colors.
LSX: Mystery BTC strategy with 100% hit rateI said in the main crypto chat, that it was easy to create a BS strategy with a 100% profit rate, so here's the proof.
Looks awesome right? I can promise you, if you trade with this, it will sooner or later blow your account.
Keeping the inner workings of it a secret, just like the scammers do.
Why am I publishing this? To show why investing in these 'mystery strategies' is a terrible idea. That's also why I've hidden the code, so it looks more attractive than it really is.
Say safe, don't get scammed. Don't get rekt.

Psychological line Backtest Psychological line (PSY), as an indicator, is the ratio of the number of
rising periods over the total number of periods. It reflects the buying
power in relation to the selling power.
If PSY is above 50%, it indicates that buyers are in control. Likewise,
if it is below 50%, it indicates the sellers are in control. If the PSY
moves along the 50% area, it indicates balance between the buyers and
sellers and therefore there is no direction movement for the market.
You can change long to short in the Input Settings
WARNING:
- For purpose educate only
- This script to change bars colors.

C320up Strategy Tester Start TimeC320up Strategy Tester Start Time
This is a little snippet you can paste into your Strategy to set the testing start date and time.
It is not a Strategy per se, though is an example with the timestamp script included.
Instructions are fairly straight forward, and are listed in the script.
If for some reason you also wanted an end date, that too is possible. Just leave a note in the comments.
Disclaimer: We searched for a similar script on TV, and could not find anything at this point in time.
You can set your preferred date and time in the input section of the settings.
Enjoy!

Ichimoku Cloud strategy for gold marketThis strategy is based on main ichimoku features (Leading span , conversion line and base line) compared to cloud conditions.
I indicated all possibilities in this indicator and strategy decision is based on crossing factors of each main line through two other line confirmations.

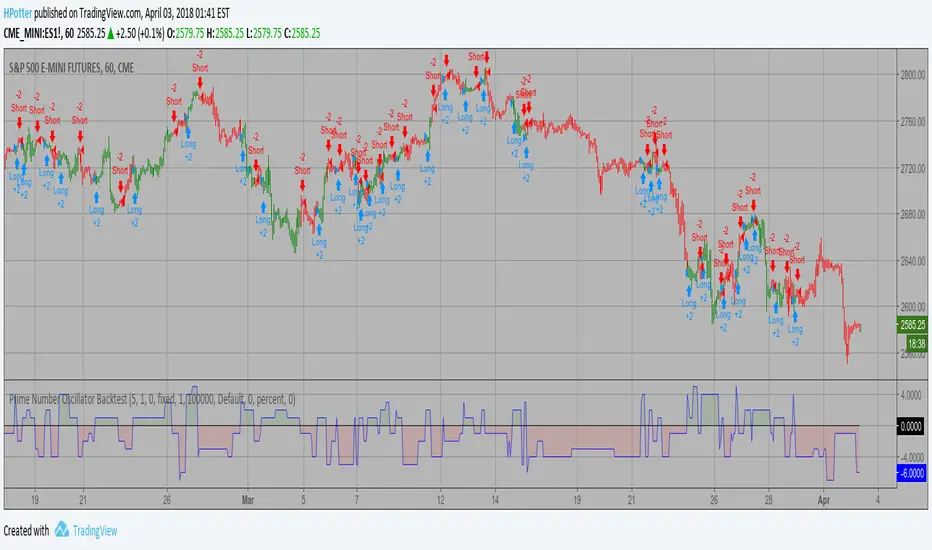
Prime Number Oscillator Backtest Determining market trends has become a science even though a high number or people
still believe it’s a gambling game. Mathematicians, technicians, brokers and investors
have worked together in developing quite several indicators to help them better understand
and forecast market movements.
Developed by Modulus Financial Engineering Inc., the prime number oscillator indicates the
nearest prime number, be it at the top or the bottom of the series, and outlines the
difference between that prime number and the respective series.
You can change long to short in the Input Settings
WARNING:
- For purpose educate only
- This script to change bars colors.
Prime Number Bands Backtest Determining market trends has become a science even though a high number
or people still believe it’s a gambling game. Mathematicians, technicians,
brokers and investors have worked together in developing quite several
indicators to help them better understand and forecast market movements.
The Prime Number Bands indicator was developed by Modulus Financial Engineering
Inc. This indicator is charted by indentifying the highest and lowest prime number
in the neighborhood and plotting the two series as a band.
You can change long to short in the Input Settings
WARNING:
- For purpose educate only
- This script to change bars colors.

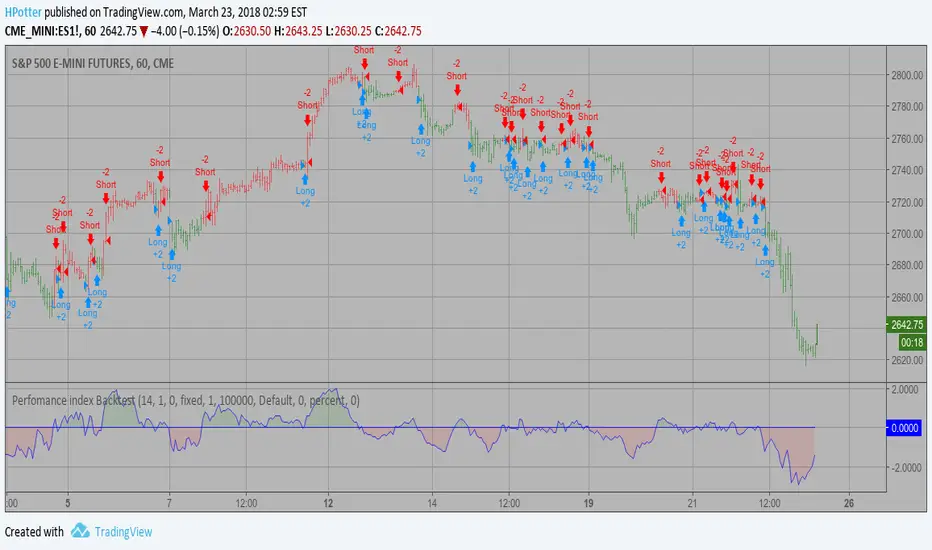
Perfomance index Backtest The Performance indicator or a more familiar term, KPI (key performance indicator),
is an industry term that measures the performance. Generally used by organizations,
they determine whether the company is successful or not, and the degree of success.
It is used on a business’ different levels, to quantify the progress or regress of a
department, of an employee or even of a certain program or activity. For a manager
it’s extremely important to determine which KPIs are relevant for his activity, and
what is important almost always depends on which department he wants to measure the
performance for. So the indicators set for the financial team will be different than
the ones for the marketing department and so on.
Similar to the KPIs companies use to measure their performance on a monthly, quarterly
and yearly basis, the stock market makes use of a performance indicator as well, although
on the market, the performance index is calculated on a daily basis. The stock market
performance indicates the direction of the stock market as a whole, or of a specific stock
and gives traders an overall impression over the future security prices, helping them decide
the best move. A change in the indicator gives information about future trends a stock could
adopt, information about a sector or even on the whole economy. The financial sector is the
most relevant department of the economy and the indicators provide information on its overall
health, so when a stock price moves upwards, the indicators are a signal of good news. On the
other hand, if the price of a particular stock decreases, that is because bad news about its
performance are out and they generate negative signals to the market, causing the price to go
downwards. One could state that the movement of the security prices and consequently, the movement
of the indicators are an overall evaluation of a country’s economic trend.
You can change long to short in the Input Settings
WARNING:
- For purpose educate only
- This script to change bars colors.
Line Regression Intercept Backtest Linear Regression Intercept is one of the indicators calculated by using the
Linear Regression technique. Linear regression indicates the value of the Y
(generally the price) when the value of X (the time series) is 0. Linear
Regression Intercept is used along with the Linear Regression Slope to create
the Linear Regression Line. The Linear Regression Intercept along with the Slope
creates the Regression line.
You can change long to short in the Input Settings
WARNING:
- For purpose educate only
- This script to change bars colors.

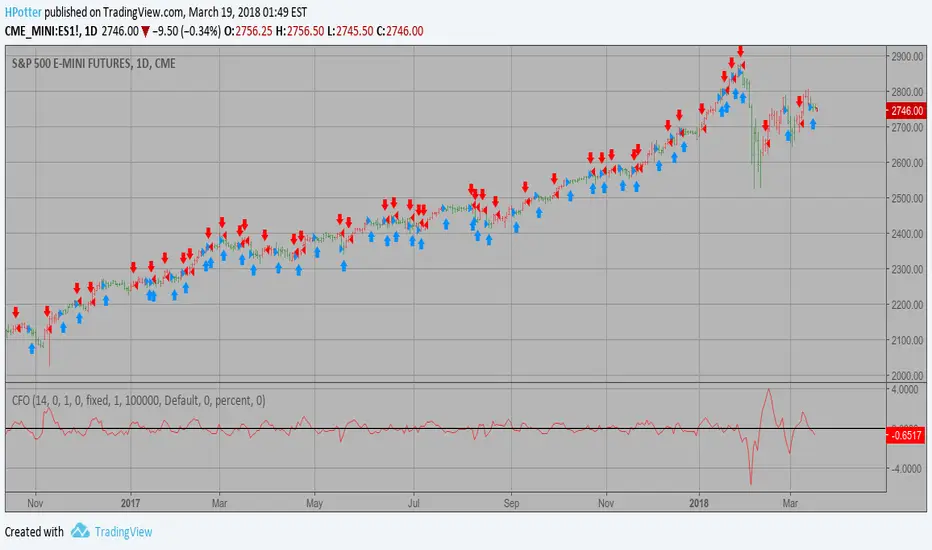
Chande Forecast Oscillator Backtest The Chande Forecast Oscillator developed by Tushar Chande The Forecast
Oscillator plots the percentage difference between the closing price and
the n-period linear regression forecasted price. The oscillator is above
zero when the forecast price is greater than the closing price and less
than zero if it is below.
You can change long to short in the Input Settings
WARNING:
- For purpose educate only
- This script to change bars colors.
Center Of Gravity Backtest The indicator is based on moving averages. On the basis of these, the
"center" of the price is calculated, and price channels are also constructed,
which act as corridors for the asset quotations.
You can change long to short in the Input Settings
WARNING:
- For purpose educate only
- This script to change bars colors.

ETH/BTC MMAs Daytrade strategy 15min UT 0.05% feesPlayed around with Moving Averages, with the goal to bounce on trendlines and trend reversals.
Time Unit : 15 min
Candle Type : Heikin Ashi
Commission : 0.05% on trades (Binance fees)
Initial capital : 1k €
Do you think this could work?

My Ichimoku indicator & Strategyhello I'm a beginner in trading, but I try to learn how to code strategies.
I recoded the Ichimoku indicator, and created my personnal strategy based on it.
The backtesting is done from 1/1/2017 to today in 45 min Time Unit for candles, with a 1 000 € equity.
The trades are all Long Entries and Exits with no pyramiding, no short trades at all.
/!\ Exchanges commission fees are not calculated and can in reality easily divide by 2 the total profit (am I right guys?) /!\
A buy signal is triggered upon these conditions:
- close is above the Kuma (cloud)
AND
- close crosses over Kijunsen AND Kijunsen is not flat (calculated with rising and falling with input "Kijunsen Lag")
OR
- Close crosses over ChikouSpan AND there was a sell signal in the last 8 candles
Sell signal is the same but reversed.
I appreciate your feedback ! Maybe I will update this later if I get better results.

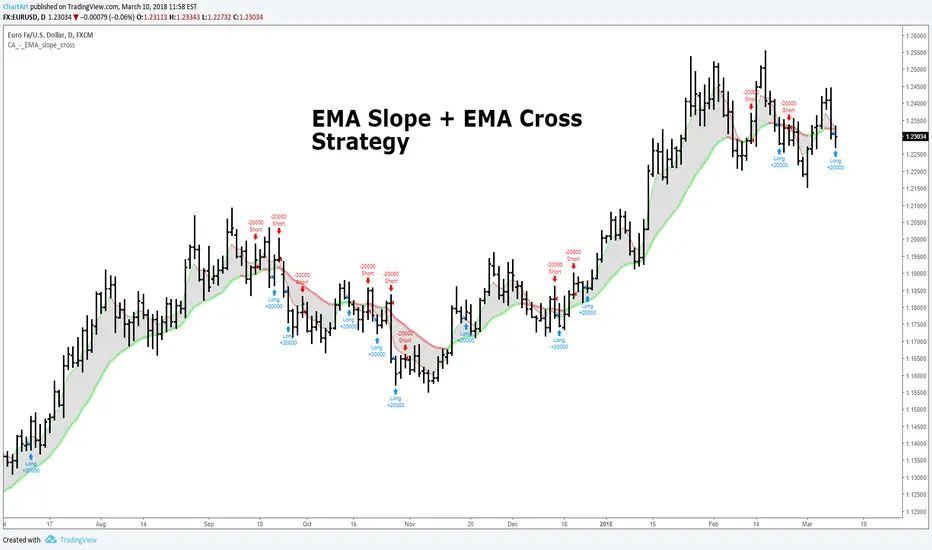
EMA Slope + EMA Cross Strategy (by ChartArt)This strategy uses divergences between three exponential moving averages and their slope directions as well as crosses between the price and these moving averages to switch between a long or short position. The strategy is non-stop in the market and always either long or short.
In addition the moving averages and price bars are colored depending if they are trending up or down.
The strategy was created for the "EURUSD" daily timeframe.
All trading involves high risk; past performance is not necessarily indicative of future results. Hypothetical or simulated performance results have certain inherent limitations. Unlike an actual performance record, simulated results do not represent actual trading. Also, since the trades have not actually been executed, the results may have under- or over-compensated for the impact, if any, of certain market factors, such as lack of liquidity. Simulated trading programs in general are also subject to the fact that they are designed with the benefit of hindsight. No representation is being made that any account will or is likely to achieve profits or losses similar to those shown.