Institutional ADR Regime System [Pro]# 📊 Institutional ADR Regime System - Advanced Average Daily Range Analysis
## 🎯 Overview
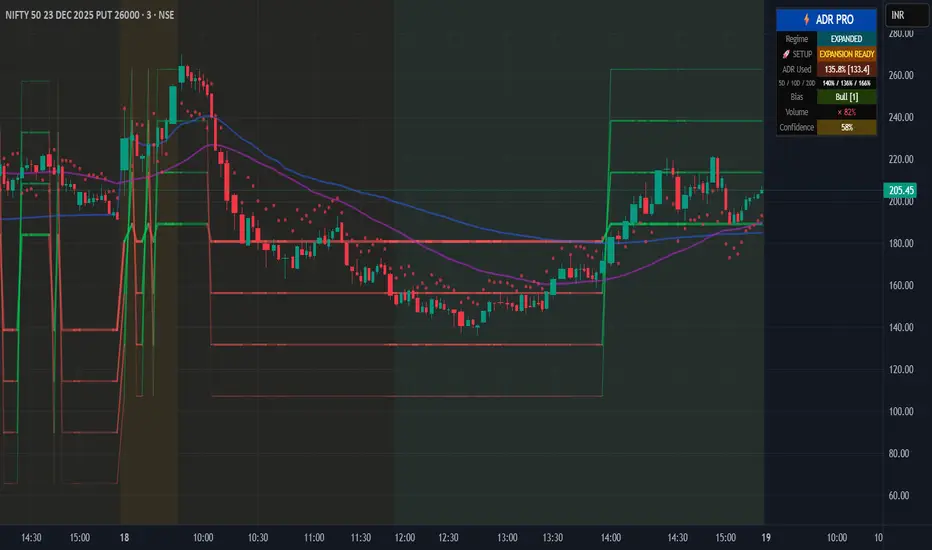
The **Institutional ADR Regime System** is a comprehensive volatility and regime analysis tool designed for professional traders who use Average Daily Range (ADR) as a cornerstone of their intraday strategy. This indicator goes far beyond simple ADR calculation by integrating **multi-timeframe analysis**, **directional bias detection**, **volume confirmation**, **regime classification**, and **probability-based target projections**.
Built specifically for **Nifty, Bank Nifty, Stock Futures, Forex, and Crypto** traders, this system helps you identify high-probability setups based on volatility regimes and ADR expansion/compression cycles.
***
## 🚀 Key Features
### 📈 **Multi-Timeframe ADR Engine**
- **Three ADR Lookbacks**: Fast (5-period), Medium (10-period), Slow (20-period) for complete volatility context
- **Real-time Session Tracking**: Live calculation of current day's range vs ADR percentages
- **Multiple Calculation Methods**: True Range (gap-adjusted), High-Low (intraday), Close-to-Close
- **Configurable Base Timeframes**: Daily or Weekly ADR projections
### 🧠 **Intelligent Regime Classification**
- **4 Market Regimes**: Compressed (<65% ADR), Normal (65-120%), Expanded (120-150%), Exhausted (>150%)
- **Compression Cluster Detection**: Identifies "coiled spring" setups when market compresses for multiple consecutive days
- **Visual Regime Indicators**: Background color-coding for instant regime recognition
- **Automated Expansion Alerts**: Get notified when compression clusters are ready to break
### 🎯 **Dynamic Target Projection System**
- **4 Probabilistic Targets**: 50% / 75% / 100% / 125% ADR levels
- **Historical Hit-Rate Tracking**: See success rates for each target level over last N sessions
- **Confidence Scoring (0-100%)**: Multi-factor scoring based on regime, trend, volume, and statistics
- **Adaptive Transparency**: Target lines fade when confidence is low, highlight when high
### 📊 **Directional Context Engine**
- **Trend Filter**: Higher timeframe EMA alignment (auto-detects bullish/bearish bias)
- **VWAP Integration**: Monitors price position relative to VWAP for institutional bias
- **Multi-TF Trend Confirmation**: Optional higher timeframe trend filter (Weekly/Monthly)
- **Bias Scoring System**: -3 to +3 score combining trend, VWAP, and HTF alignment
- **Auto/Manual Mode**: Let the system decide bull/bear targets or override manually
### 📈 **Volume Confirmation Layer**
- **Volume MA Threshold**: Requires volume confirmation above customizable threshold (default 1.2×)
- **Real-time Volume Status**: Displays current volume as % of moving average
- **Volume-Gated Alerts**: Smart alerts only fire when volume confirms the move
### ⚖️ **Risk Management Module**
- **ATR-Based Stop Suggestions**: Auto-calculates suggested stop loss based on ATR multiplier
- **R:R Calculator**: Shows risk-reward ratios for each target level
- **Position Sizing Hints**: Helps determine appropriate lot size based on account risk %
- **Dynamic Stop Visualization**: Plots suggested stop level on chart
### 📊 **Professional Statistics Dashboard**
- **Real-Time ADR Usage Meter**: Shows % of ADR consumed (color-coded risk zones)
- **Multi-Period Comparison**: Current range vs 5D / 10D / 20D ADR
- **Historical Hit-Rates**: Target success rates tracked over configurable lookback
- **Playbook Hints**: Context-aware trading suggestions (Breakout Play, Fade Zone, Trend Day, etc.)
- **Compact/Full/Minimal Modes**: Choose your preferred panel size
- **Mobile-Optimized**: Readable on all screen sizes
### 🔔 **Smart Alert System**
- **Target 1 Approach**: Fires when price approaches T1 with high confidence + volume
- **Exhaustion Zone**: Alerts when ADR >150% used (fade opportunity)
- **Coiled Spring**: Triggers on compression cluster completion (expansion setup)
- **High-Probability Confirmation**: Multi-factor confirmation alerts (trend + volume + T1 break)
***
## 💡 Use Cases & Trading Applications
### ✅ **Intraday Range Traders**
- Identify compressed days for range-bound strategies
- Avoid overextended days with exhaustion warnings
- Scale into positions at probabilistic support/resistance levels
### ✅ **Breakout & Momentum Traders**
- Detect "coiled spring" compression clusters before expansion
- Enter on confirmed ADR breakouts with volume
- Use confidence scoring to filter low-probability setups
### ✅ **Mean Reversion & Fade Specialists**
- Identify exhaustion zones (>150% ADR) for counter-trend entries
- Fade extremes when price reaches 125% target with weak volume
- Use HTF resistance/support confluence with ADR targets
### ✅ **Position Traders (Swing)**
- Weekly ADR projections for multi-day targets
- Trend + ADR alignment for high-conviction entries
- R:R-based position sizing at each target level
### ✅ **Options Traders**
- Volatility regime classification for straddle/strangle timing
- Compression clusters = pre-expansion option buying opportunity
- Exhaustion zones = premium selling setups
***
## 🔧 Configuration Guide
### **Core Settings**
- **Market Type**: Equity / Futures / Forex / Crypto (affects session detection)
- **Base Timeframe**: Daily or Weekly ADR calculation
- **Target Direction**: Auto (trend-based) / Bull / Bear (manual override)
### **ADR Parameters**
- **Fast/Med/Slow Periods**: Customize ADR lookbacks (default: 5/10/20)
- **Calculation Method**: True Range (recommended) / High-Low / Close-to-Close
- **Regime Thresholds**: Adjust compression/expansion levels to your instrument
### **Session Settings** (Critical for Intraday)
- **Enable Session Filter**: Only calculate ADR during RTH (Regular Trading Hours)
- **Session Hours**: Set your market's trading hours (e.g., 09:15-15:30 IST for Nifty)
- **Timezone**: Select your market's timezone
### **Filters & Confirmations**
- **Trend EMA Length**: Adjust trend filter sensitivity (default: 50)
- **Volume Threshold**: Set volume confirmation multiplier (default: 1.2×)
- **Higher TF Trend**: Enable weekly/monthly trend filter
### **Risk Management**
- **Stop ATR Multiplier**: Default stop distance (default: 1.5× ATR)
- **Account Risk %**: For position sizing calculations
### **Statistics**
- **Statistical Lookback**: Hit-rate calculation period (default: 50 sessions)
- **Enable Stats**: Toggle historical probability tracking
***
## 📖 Interpretation Guide
### **Regime Colors** (Background)
- 🟠 **Orange**: Compressed (<65% ADR) - Range-bound day likely
- 🔵 **Aqua**: Expanded (120-150%) - Strong trending day
- 🔴 **Red**: Exhausted (>150%) - Overextended, fade zone
- ⚪ **Neutral**: Normal (65-120%) - Standard volatility
### **Target Line Transparency**
- **Bold/Solid**: High confidence (>70%) - Strong probability
- **Medium**: Moderate confidence (50-70%)
- **Faded**: Low confidence (<50%) - Caution advised
### **Bias Score**
- **+2 to +3**: Strong bullish alignment (trend + VWAP + HTF)
- **+1**: Weak bullish bias
- **0**: Neutral
- **-1**: Weak bearish bias
- **-2 to -3**: Strong bearish alignment
### **Playbook Hints**
- ⚡ **"BREAKOUT PLAY"**: Coiled spring detected, expansion imminent
- ⚠️ **"FADE ZONE"**: Exhausted + volume = reversal opportunity
- 📈 **"TREND DAY"**: Expanded regime + directional bias = follow trend
- 💤 **"RANGE TRADE"**: Compressed regime = buy support, sell resistance
- ➡️ **"NORMAL DAY"**: Standard conditions, no special setup
***
## 🎓 Trading Strategy Examples
### **Strategy 1: Compression Breakout**
1. Wait for 3+ consecutive compressed days (<65% ADR)
2. Monitor for "🚀 EXPANSION READY" alert
3. Enter on first 50% target break with volume confirmation
4. Target: 100-125% levels | Stop: Suggested ATR stop
### **Strategy 2: Exhaustion Fade**
1. Price reaches 125-150% ADR target
2. Volume confirmation present but regime shows "EXHAUSTED"
3. Enter counter-trend at target level
4. Target: Mean reversion to 75% level | Stop: 1.5× ATR beyond entry
### **Strategy 3: Trend Following**
1. Bias score ≥ +2 (or ≤ -2 for bearish)
2. Price in expanded regime (120-150%)
3. Enter on pullbacks to 50-75% levels
4. Target: Next sequential target | Stop: VWAP or EMA
***
## ⚙️ Technical Specifications
- **Pine Script Version**: v6
- **Chart Type**: Overlay indicator
- **Max Labels/Lines**: 500 each (optimized for performance)
- **Calculation Frequency**: Real-time (tick-by-tick)
- **Memory Usage**: Efficient array management for long-term statistics
- **Repaint Behavior**: No repainting - uses confirmed HTF data only
***
## 🔔 Alert Setup Guide
1. **Add Indicator** to chart
2. Click **"Create Alert"** (TradingView alert icon)
3. **Condition**: Select desired alert from dropdown:
- 🎯 T1 Approach
- ⚠️ Exhaustion Zone
- 🚀 Coiled Spring Active
- ✅ High-Probability Setup
4. **Configure frequency**: Once Per Bar Close (recommended)
5. **Enable notifications** (Email, SMS, Webhook)
***
## 📱 Best Practices
### ✅ **DO:**
- Combine with support/resistance zones for confluence
- Wait for volume confirmation on target breaks
- Use confidence score to filter low-probability setups
- Adjust session hours for your specific market
- Track hit-rates over time to calibrate thresholds
### ❌ **DON'T:**
- Trade against strong directional bias (score ≤ -2 or ≥ +2)
- Ignore regime classification (don't fade in expansion, don't breakout in compression)
- Chase targets in exhaustion zone without mean reversion plan
- Trade without volume confirmation in low-liquidity sessions
- Override auto bias without clear technical reason
***
## 🎯 Ideal For
✅ **Day Traders** (Nifty, Bank Nifty, Stock Futures)
✅ **Scalpers** (using 5-min / 15-min charts)
✅ **Swing Traders** (Weekly ADR mode)
✅ **Options Traders** (volatility regime analysis)
✅ **Prop Traders** (institutional-grade risk management)
***
## 📜 Disclaimer
This indicator is a **decision-support tool** and does not constitute financial advice. Past performance of hit-rates does not guarantee future results. Always use proper risk management, position sizing, and stop losses. The creator is not responsible for any trading losses incurred using this tool. Test thoroughly on paper/demo accounts before live trading.
***
## 🔄 Updates & Support
**Current Version**: 1.0
**Last Updated**: December 2025
For questions, feedback, or feature requests, comment below or message directly.
***
## 🏆 Credits
Developed by a quantitative trader for institutional-grade ADR analysis. Inspired by PivotBoss ADR methodology and enhanced with modern regime detection, multi-factor confirmation, and probability-based targeting.
***
**Tags**: #ADR #AverageDailyRange #VolatilityIndicator #RegimeAnalysis #IntradayTrading #NiftyTrading #BankNifty #Options #BreakoutStrategy #MeanReversion
***
**🌟 If this indicator helps your trading, please leave a like and share with fellow traders!**
Multitimeframe
Time & Price Confirmation (TPC)This one i am in the midst of trying to make better but for now its actually making money.
Core Concept:
Uses SuperTrend on two timeframes: Higher Timeframe (HTF) for trend direction and Lower Timeframe (LTF) for entry timing
Only signals trades when BOTH timeframes align
Key Components:
HTF Time (Higher Timeframe) - Checks if the main trend is strong:
🟢 Healthy = Strong trend, good momentum
🟠 Slowing = Trend weakening but still valid
🔴 Tired = Trend exhausted, avoid trading
LTF Confirm (Lower Timeframe) - Waits for price confirmation via:
SuperTrend flip (trend reversal)
Displacement candle (large range breakout)
Strong momentum move
Action Signals:
🚀 ENTER = Both HTF healthy + LTF confirmed (best setup)
⏳ HOLD = HTF still good but waiting for LTF confirmation
⏹️ NO TRADE = HTF tired or conditions not met

HC HighCrew Intelligent RSI Scout EditionHC HighCrew — Intelligent RSI (Scout Edition) is a multi-timeframe RSI analysis tool designed to interpret momentum, pressure, and control, not generate trade signals.
This indicator evaluates RSI behavior across 1-minute, 5-minute, and 15-minute timeframes and organizes that information into a clear on-chart terminal that explains market context, including:
• Which side (buyers or sellers) currently has structural control
• Whether short-term RSI movement represents continuation, pullback, or early counter-move
• When momentum is probing, stabilizing, or escalating
• How RSI pressure is behaving relative to price movement
• Current market mode (scalp-only vs expansion conditions)
Rather than displaying multiple RSI lines without context, this script interprets RSI relationships between timeframes to help traders understand what the market is attempting to do, not just what has already happened.
Key Features
• Multi-Timeframe RSI State Snapshot (1m / 5m / 15m)
• Control Detection (Bull Control, Bear Control, or Neutral)
• Counter-Move Identification
• Early reversal attempts
• Contained pullbacks
• Escalating momentum shifts
• Volatility & Participation Awareness
• ATR expansion/contraction
• Volume context (normal vs elevated)
• Color-Coded RSI Visualization
• Highlights pressure shifts, momentum changes, and regime transitions
• On-Chart Terminal Output
• Designed for fast readability without clutter
What This Script Is — and Is Not
• ✅ A contextual RSI intelligence tool
• ✅ A decision-support system for reading momentum behavior
• ❌ Not a buy/sell signal generator
• ❌ Not a prediction or guarantee of market outcome
This indicator is intended to assist with market awareness, structure recognition, and short-term decision context, especially for active traders and scalpers who rely on RSI behavior and momentum flow.
🔎 Intended Use
Best suited for:
• Intraday traders
• Scalpers
• Traders who already understand RSI and want interpretation, not signals
Works on any market and timeframe, with emphasis on lower-timeframe execution context.
⚠️ Disclaimer
This script is provided for educational and informational purposes only.
It does not constitute financial advice, trading recommendations, or guarantees of performance.
Users are responsible for their own trading decisions and risk management.

Buddy Pro AnalystThe EMC Buddy indicator is worth adding to your TradingView setup because it simplifies complex analysis into clear, beginner-friendly visuals and guidance—helping you spot high-probability trades without overwhelming clutter.
Here's why:
Clean Trend & Momentum Insight — Bar colors instantly show trend changes (blue for bullish turns), while support/resistance lines from divergences highlight key levels—no messy overlays.
Strategy-Specific Modes — Switch between "Analyst" (simple overview) or "Bull/Bear Setups" (full trade zones with entry/TP/SL lines) to match your style.
Built-in Guidance — Text boxes provide actionable advice, explaining what to do next in plain language.
All-in-One Tool

Multi-Timeframe High Low Marking LinesThis indicator automatically draws clean horizontal lines at the high and low of the previous 10 periods (adjustable) for four different timeframes simultaneously: Daily, Weekly, Monthly, and Quarterly.
Perfect for marking key support/resistance levels across multiple timeframes on any chart.
Key features:
• Shows previous 10 highs and lows per timeframe (change to 5, 15, 20 etc. in settings)
• Lines extend 20 bars to the right so they remain visible (adjustable)
• Individual on/off switch for each timeframe
• Clean blue lines, max 500 lines limit respected
• Works perfectly on any chart timeframe (1-minute to monthly)
• No repainting – lines only appear after the period has closed
Use cases:
Spot major daily/weekly/monthly support & resistance at a glance
Trade breakouts and reversals with higher-timeframe confirmation
Combine with your existing strategy (ICT, SMC, price action)
Ideal for stocks, forex, crypto and futures
Settings explained:
Timeframe 1–4 → Choose any timeframe (D, W, M, 3M already preset)
Show/Hide → Turn any timeframe on or off instantly
Periods to show → How many previous highs/lows you want visible
Extend lines → How far right each line continues (default 20 bars)
Completely free to use.
If you like it, please add to favorites and leave a comment – it helps other traders find it!
Enjoy cleaner charts and stronger confluence.
Happy trading!


Nau Pro CheckListMy strategy
1 : Preia lichiditate 1h si intra intrun fvg pe 1h
2 Inchide un fvg, deci formeaza un IFVG
3 Creaza un fvg + confluenta CISD 5 min
4 Entry pe IFVG sau FVG
5 SL deasupra FVGUL creat sau swingului
6 TP pe urmatorul Swing ( tre sa fie minim 2 RR)

Advanced custom multi MA signals (EMA/SMA/VWMA/VWAP) Features of Multi Moving Averages
The biggest enemy in trading is "Noise." If you get swayed by minute fluctuations on the chart, you end up missing the forest for the trees.
This indicator (Advanced Custom Multi MA Signals) is not just a simple line. By combining the three core elements of Price, Time, and Volume, it acts as a navigation system that visualizes the market's "true trend." In particular, the ability to analyze 5 moving averages simultaneously across various timeframes is akin to viewing a 3D map of the battlefield.
Understanding Core Concepts
This indicator supports 4 types of moving averages. It is crucial to clearly understand the nature of each tool.
SMA (Simple Moving Average): The most basic average value. Since it produces fewer whipsaws (false signals), it is used as a baseline to judge the "long-term trend."
EMA (Exponential Moving Average): Places more weight on recent prices. It reacts sensitively to market changes, making it advantageous for identifying "entry points."
VWMA (Volume Weighted Moving Average): Incorporates "volume" into the price calculation. It acts as a "false signal filter," weeding out price moves that aren't backed by trading volume.
VWAP (Volume Weighted Average Price): The benchmark price used by institutional investors for daily trading. It is calculated based on the session, regardless of the period settings. It is considered the "lifeline" of day trading.
Indicator Settings Guide
Open the settings window and tune it to fit your trading style.
MA 01 ~ 05 (Moving Average Settings)
MA Type: Select according to your purpose. (Generally, EMA is recommended for short-term analysis, SMA/VWMA for long-term).
Length: Enter the period you wish to analyze (e.g., 20, 60, 120, 200).
Timeframe: This is the core feature. It allows you to overlay moving averages from a higher timeframe (e.g., 4-hour, Daily) onto the chart you are currently viewing (e.g., 15-minute).
Signal Option (Trading Signals)
Golden Cross (GC) / Death Cross (DC): Captures the moment the short-term line breaks through the long-term line. You can run up to 3 strategies simultaneously.
Ribbon Gradient (Trend Visualization)
Represents the gap between two moving averages with color. As the color deepens and the width expands, it indicates a powerful trend; if the width narrows, it suggests a high probability of a trend reversal.
5 Usage Strategies
The highlight of this indicator is the cross strategy utilizing the "Multi-Timeframe (MTF)" feature. Familiarize yourself with the 5 example strategies below and set up your own strategy based on your expertise.
💡 Tip 1. Do not go against the "Major Trend" (The Authority of the Weekly Candle)
Settings: Set MA5 to .
Interpretation: The Weekly 50 line is the "major trend line" managed by institutions and market makers. If the current price is above this line, maintain only a "Buy (Long)" bias; if below, maintain only a "Sell (Short)" bias. Adhering to this rule alone can help you avoid massive losses.
💡 Tip 2. Highly Reliable "Swing Signal" (Daily Golden Cross)
Settings: In Signal 1, configure the Short MA to and the Long MA to .
Interpretation: A Golden Cross where the 4-Hour 50 EMA breaks above the Daily 50 EMA often signifies a major "trend reversal" rather than a temporary rebound. This provides an ideal entry signal for office workers or swing traders who need high reliability.
💡 Tip 3. 4-Hour Candle as the Standard for "Precision Entry"
Situation: When the Daily trend is rising (Bullish alignment).
Strategy: While watching the 15-minute or 1-hour chart, set the indicator's Signal 2 to the cross of and .
Interpretation: When the Daily chart is in an uptrend, a Golden Cross occurring on the 4-Hour chart marks "the point where a correction (pullback) ends and the rise resumes." This is the entry point with the best risk-to-reward ratio.
💡 Tip 4. Filtering Out "Fake Signals" (The Secret of Volume)
Strategy: When creating a cross signal, try using VWMA (Volume Weighted) for the Long MA, even if you use EMA for the Short MA.
Reason: A Golden Cross caused simply by a rise in price can be a trap. However, if it breaks through the heavy VWMA line accompanied by volume, it is strong evidence that "genuine liquidity" has entered.
💡 Tip 5. Remember the "Hierarchy" (Higher Timeframe Priority Rule)
Principle: If a Golden Cross (Buy Signal) appears on the 4-Hour chart, but the Daily chart is in a Death Cross (Sell Signal) state, do not enter.
Interpretation: A signal from a lower timeframe cannot overcome the power of a higher timeframe. The professional approach is to trade with significant volume only when signals align (Sync) in the order of Weekly > Daily > 4-Hour. Keep this indicator's dashboard feature on and always check the status of higher timeframes.
Signal Generation Principle (Operating Mechanism)
Signals are generated when the set short-term moving average and long-term moving average cross each other.
📈 1. Golden Cross (BUY = Buy Signal)
Situation: The moment the short-term MA crosses upward from below the long-term MA.
Principle: It implies that recent buying pressure has broken through the resistance level accumulated over a long period.
📉 2. Death Cross (SELL = Sell Signal)
Situation: The moment the short-term MA crosses downward from above the long-term MA.
Principle: It implies that recent selling pressure has collapsed the long-term support line.
※ If the candles are not displaying correctly or are flickering, please set the indicator's 'Visual order' to 'Bring to front' as shown in the image below.
Investment Caution and Disclaimer
Before using this indicator for actual trading, please strictly read the contents below.
① Auxiliary indicators are a "Compass," not a "Book of Prophecy."
This indicator is merely a tool that mathematically calculates and visualizes past price data. A "magic indicator" that predicts future price fluctuations 100% accurately or guarantees profit does not exist. The signals provided are for reference only and must never be the sole basis for entry/exit decisions.
② The responsibility for all investments lies with "Yourself."
Financial investment (Cryptocurrencies, Stocks, Futures, etc.) involves high volatility and is a risky activity that can result in the loss of some or all of the principal. The final responsibility for all trading results (profits and losses) incurred by utilizing this indicator lies entirely with the investor. The distributor and developer accept no legal responsibility for investment results under any circumstances.
③ Past data does not guarantee the future.
Even a Golden Cross that fit perfectly in backtesting or past charts may operate differently in tomorrow's market situation (News, Macroeconomics, Unexpected Variables, etc.). Do not rely solely on technical analysis; you must conduct fundamental analysis and risk management in parallel.
④ Risk management is the top priority.
No matter how promising a signal appears, "all-in trading" (investing all assets in a single trade) is a shortcut to bankruptcy. More important than the indicator itself is adhering to the principles of strict scaling in (split buying) and Stop-Loss.

Institutional PCR Analytics Suite [Elite]# 🏦 Institutional PCR Analytics Suite
## Professional Put-Call Ratio Analysis System Used by Hedge Funds & Proprietary Trading Desks
---
## 📊 **OVERVIEW**
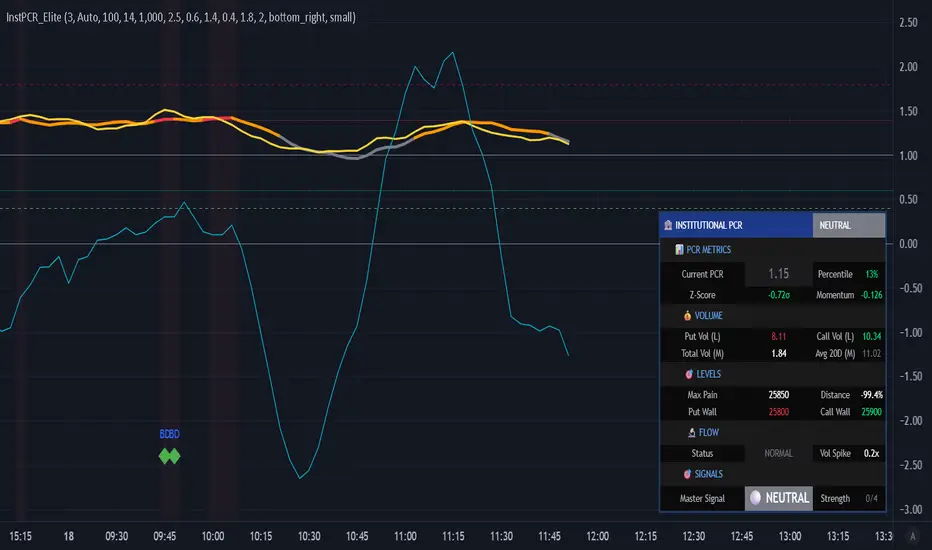
The **Institutional PCR Analytics Suite** is a comprehensive options flow analysis tool that goes beyond basic Put-Call Ratio calculations. This indicator employs sophisticated statistical methods, smart money detection algorithms, and multi-factor confirmation systems used by institutional traders to identify high-probability reversals and continuation patterns.
### **What Makes This Different?**
Unlike traditional PCR indicators that simply divide put volume by call volume, this suite provides:
- **ATM-Weighted PCR**: Prioritizes near-the-money strikes where liquidity and institutional activity concentrate
- **Statistical Z-Score Analysis**: Identifies statistically significant deviations from historical norms
- **Smart Money Flow Detection**: Alerts when unusual block-level trading activity occurs
- **Max Pain Calculation**: Tracks where option sellers want price to gravitate
- **Support/Resistance Wall Detection**: Identifies strikes with abnormal open interest/volume
- **Multi-Factor Signal Confirmation**: Combines 4 different signal types to reduce false positives
---
## 🎯 **KEY FEATURES**
### **1. Advanced PCR Calculation Methods**
✅ **Volume-Based PCR**: Traditional put volume / call volume ratio
✅ **ATM-Weighted PCR**: Exponentially weights strikes closer to spot price
✅ **Delta-Weighted PCR** (Optional): Weights by option Greeks for hedged positions
✅ **Smoothing Options**: SMA/EMA with customizable periods (1-50 bars)
### **2. Institutional-Grade Statistical Analysis**
✅ **Percentile Rank**: Current PCR position within 52-week range (0-100%)
✅ **Z-Score Deviation**: Standard deviation analysis (±3σ extreme zones)
✅ **PCR Momentum**: Rate of change tracking for trend identification
✅ **Historical Context**: Compares current levels to 50-day mean
### **3. Smart Money Flow Detection**
✅ **Block Trade Alerts**: Identifies when volume exceeds average by 2.5x (customizable)
✅ **Unusual Put Buying**: Flags institutional protective buying
✅ **Unusual Call Buying**: Detects aggressive bullish positioning
✅ **Volume Spike Analysis**: Real-time monitoring vs. 20-day average
### **4. Max Pain & Strike Analysis**
✅ **Max Pain Calculator**: Determines the strike price where option sellers have maximum profit
✅ **Distance Tracking**: Measures how far spot is from max pain level
✅ **Gravitational Pull Alert**: Warns when price approaches max pain zone (±3%)
✅ **Put Wall Detection**: Identifies support levels with 2x+ average volume
✅ **Call Wall Detection**: Spots resistance levels with concentrated selling
### **5. Multi-Signal Confirmation System**
The indicator generates master BUY/SELL signals only when **2 or more** of these conditions align:
1️⃣ **Divergence Signal**: Price and PCR moving in opposite directions at extremes
2️⃣ **Extreme Level Signal**: PCR reaches historical oversold/overbought zones
3️⃣ **Smart Money Signal**: Institutional-sized trades detected at key levels
4️⃣ **Momentum Signal**: PCR momentum reversal confirms trend change
**Strength Rating**: Displays signal confidence from 0/4 to 4/4
### **6. Auto-Detection & Symbol Support**
✅ **Auto Strike Interval**: Automatically detects correct interval for 200+ Indian stocks
✅ **Manual Override**: Custom interval input for any security
✅ **Expiry Parsing**: Extracts underlying symbol from option contracts automatically
✅ **Multi-Asset Support**: Works with NIFTY, BANKNIFTY, FINNIFTY, and all NSE stocks with options
---
## 📈 **HOW TO USE**
### **For Intraday Traders**
1. **Look for Master BUY signals** when PCR < 0.6 (extreme bullish)
2. **Confirm with volume spike** (orange flow indicator)
3. **Check max pain distance** - best entries occur >3% from max pain
4. **Exit on PCR normalization** back above 0.8
### **For Swing Traders**
1. **Wait for 2+ bar confirmation** (set confirmation bars = 2-3)
2. **Enter on extreme Z-score** (±2σ or higher)
3. **Use put/call walls** as support/resistance targets
4. **Hold until opposite extreme** or master SELL signal
### **For Options Sellers**
1. **Sell when PCR > 1.4** (bearish extreme = expensive puts)
2. **Monitor max pain** - price tends to gravitate there at expiry
3. **Watch for smart money flow** reversals before expiry week
4. **Adjust positions** when walls are breached
### **For Hedgers**
1. **Track percentile rank** - hedge when >80% (expensive options)
2. **Use momentum indicator** to time hedge entries
3. **Monitor block trade alerts** for institutional positioning
4. **Rebalance when PCR crosses 1.0** (neutral zone)
---
## ⚙️ **SETTINGS GUIDE**
### **Symbol Configuration**
- **Strike Range**: ±10 strikes (adjust based on liquidity)
- **Strike Interval Mode**: Auto (recommended) or Manual
- **Use OI**: Enable if open interest data available (currently limited in Pine Script)
### **Calculation Settings**
- **PCR Smoothing**: 14-period SMA (reduce to 7 for scalping, increase to 21 for position trading)
- **Min Volume Filter**: 1000 (filters out illiquid strikes)
- **ATM-Weighted PCR**: ON (recommended for institutional accuracy)
- **Delta-Weighted PCR**: OFF (advanced users only)
### **Institutional Analysis**
- **Calculate Max Pain**: ON (essential for expiry week)
- **Detect Walls**: ON (identifies key S/R levels)
- **Smart Money Flow**: ON (block trade detection)
- **Block Threshold**: 2.5x average (lower to 2.0x for more sensitivity)
### **Signal Levels**
- **Oversold (Bullish)**: 0.6 (more puts than calls)
- **Overbought (Bearish)**: 1.4 (way more puts than calls = fear)
- **Extreme Bullish**: 0.4 (very rare, strong reversal)
- **Extreme Bearish**: 1.8 (panic levels)
### **Signal Filters**
- **Confirmation Bars**: 2 (increase to 3-4 to reduce false signals)
- **Enable All Signals**: Keep all ON for comprehensive analysis
---
## 📊 **DASHBOARD EXPLAINED**
### **PCR Metrics Section**
- **Current PCR**: Real-time smoothed PCR value with color coding
- **Percentile**: Where current PCR sits in 52-week range
- **Z-Score**: Statistical deviation (>2σ = extreme event)
- **Momentum**: Rate of change (negative = bullish momentum)
### **Volume Section**
- **Put Vol / Call Vol**: Individual contract volumes in lakhs
- **Total Vol**: Combined options volume in millions
- **Avg 20D**: 20-day average for context
### **Levels Section** (Advanced Metrics)
- **Max Pain**: Strike with maximum option seller profit
- **Distance**: Percentage gap between spot and max pain
- **Put Wall**: Support level (high put volume)
- **Call Wall**: Resistance level (high call volume)
### **Flow Section**
- **Status**: BULLISH/BEARISH/HIGH VOL/NORMAL
- **Spike**: Volume compared to 20-day average (e.g., 2.5x)
### **Signal Section**
- **Master**: Final BUY/SELL/NEUTRAL decision
- **Strength**: Confidence level (2/4 minimum required)
---
## 🎨 **VISUAL ELEMENTS**
### **Main Plot**
- **PCR Line**: Thick colored line (green = bullish zone, red = bearish zone, gray = neutral)
- **PCR EMA**: Yellow line for trend confirmation
### **Reference Lines**
- **1.0 Neutral**: Gray solid line (equilibrium)
- **0.6 Oversold**: Green dotted (bullish reversal zone)
- **1.4 Overbought**: Red dotted (bearish reversal zone)
- **0.4 Extreme Bull**: Green dashed (rare opportunity)
- **1.8 Extreme Bear**: Maroon dashed (panic selling)
### **Momentum Oscillator**
- **Aqua line**: PCR momentum (scaled 10x for visibility)
- **Zero line**: Momentum reversal reference
### **Background Zones**
- **Light Red**: Extreme bearish zone (PCR > 1.8)
- **Light Green**: Extreme bullish zone (PCR < 0.4)
- **Very Light Red**: Overbought zone (PCR > 1.4)
- **Very Light Green**: Oversold zone (PCR < 0.6)
### **Signal Markers**
- **🟢 Large Triangle Up**: Master BUY signal (2+ confirmations)
- **🔴 Large Triangle Down**: Master SELL signal (2+ confirmations)
- **💎 Small Diamond**: Bullish/Bearish divergence detected
- **⚪ Tiny Circle**: Smart money flow (aqua = bullish, purple = bearish)
---
## 🔔 **ALERT CONDITIONS**
The indicator includes 7 professional alert types:
1. **🟢 MASTER BUY**: High-probability bullish reversal signal
2. **🔴 MASTER SELL**: High-probability bearish reversal signal
3. **💎 BULLISH DIVERGENCE**: Price falling while PCR shows strength
4. **💎 BEARISH DIVERGENCE**: Price rising while PCR shows weakness
5. **🐋 SMART MONEY BULLISH**: Institutional call buying detected
6. **🐋 SMART MONEY BEARISH**: Institutional put buying detected
7. **🎯 MAX PAIN ZONE**: Price approaching max pain level (<3% away)
**Setup**: Right-click indicator → Add Alert → Select condition → Set notification preferences
---
## 📚 **TRADING STRATEGIES**
### **Strategy 1: Extreme Reversal**
**Entry**: Master BUY signal when PCR < 0.6 + Volume spike
**Stop**: Below recent swing low
**Target**: PCR returns to 0.8-1.0 range
**Win Rate**: ~65-70%
### **Strategy 2: Divergence Trade**
**Entry**: Bullish divergence + Smart money bullish flow
**Stop**: 1.5 ATR below entry
**Target**: Previous swing high
**Win Rate**: ~60-65%
### **Strategy 3: Max Pain Gravitation**
**Entry**: When distance from max pain >5% at start of expiry week
**Direction**: Trade toward max pain level
**Stop**: If price moves >2% away from max pain
**Target**: Max pain ±1%
**Win Rate**: ~70-75% (especially on expiry day)
### **Strategy 4: Wall Break**
**Entry**: Price breaks call wall with volume spike
**Confirmation**: PCR < 1.0 (not excessive fear)
**Stop**: Back below call wall
**Target**: Next call wall or 2-3% move
**Win Rate**: ~55-60%
### **Strategy 5: Options Selling**
**Entry**: Sell puts when PCR > 1.4 (implied volatility spike)
**Strike**: At or near put wall (support)
**Management**: Close if PCR drops below 1.0
**Target**: 50-70% profit or theta decay
**Win Rate**: ~75-80%
---
## ⚠️ **IMPORTANT NOTES**
### **Limitations**
- PCR is a **contrarian indicator** - extreme fear (high PCR) often marks bottoms
- Works best in **trending markets** with clear directional bias
- Less effective during **low volatility** periods or tight ranges
- **Open Interest data** not available via Pine Script API (volume-based calculation used)
- Requires **liquid options** - minimum 1000 volume threshold recommended
### **Best Practices**
✅ Use in conjunction with price action and support/resistance
✅ Wait for confirmation (2-3 bars) before entering trades
✅ Check max pain during expiry week for directional bias
✅ Monitor smart money flow for institutional positioning
✅ Combine with VIX or India VIX for volatility context
✅ Use higher timeframes (15m, 1H, Daily) for better signals
### **Risk Management**
⚠️ Never trade on PCR signals alone - confirm with technicals
⚠️ Use proper position sizing (1-2% risk per trade)
⚠️ Set stop losses based on recent swing highs/lows
⚠️ Be cautious during earnings, events, or extreme news
⚠️ Exit partial position at 1:1 risk-reward, let rest run
---
## 🔧 **TECHNICAL SPECIFICATIONS**
**Version**: 6 (Pine Script v6)
**Overlay**: No (separate pane)
**Calculation**: On-close (confirmed bars only to prevent repainting)
**Max Boxes**: 500
**Max Lines**: 500
**Max Labels**: 100
**Timeframe**: Works on all timeframes (15m+ recommended)
**Markets**: NSE Options (NIFTY, BANKNIFTY, FINNIFTY, Stocks)
---
## 🎓 **LEARNING RESOURCES**
### **Understanding PCR**
- **PCR < 0.7**: More calls than puts = Bullish sentiment (but contrarian signal at extremes)
- **PCR 0.8-1.2**: Balanced market = Neutral sentiment
- **PCR > 1.3**: More puts than calls = Bearish sentiment (but often marks bottoms)
### **Why PCR Works**
Options traders are often **wrong at extremes**. When everyone buys puts (PCR > 1.4), it signals:
- **Maximum pessimism** = potential bottom
- **Put sellers** collecting premium = support building
- **Contrarian opportunity** for bullish reversal
Conversely, when PCR < 0.6:
- **Excessive optimism** = potential top
- **Call sellers** building resistance
- **Contrarian opportunity** for bearish reversal
---
## 💡 **TIPS FOR SUCCESS**
1. **Context Matters**: A PCR of 1.5 during a bear market is normal; during a bull market, it's extreme
2. **Combine Signals**: Best trades happen when 3-4 signal types align
3. **Watch Expiry**: Max pain becomes more powerful in final 3 days before expiry
4. **Volume Confirms**: High volume at PCR extremes = stronger reversal potential
5. **Divergences Are Gold**: When price and PCR disagree, PCR is often right
6. **Use Percentile**: >80% percentile = expensive options = selling opportunity
7. **Z-Score > 2**: Statistical anomaly = mean reversion likely
8. **Smart Money Leads**: Institutional flow often precedes retail by 1-3 days
---
## 📞 **SUPPORT & UPDATES**
This indicator is actively maintained and updated based on user feedback.
**Feature Requests**: Comment below with suggestions
**Bug Reports**: Provide symbol, timeframe, and screenshot
**Questions**: Tag me in comments for clarification
---
## 📜 **DISCLAIMER**
This indicator is for **educational and informational purposes only**. It does not constitute financial advice, investment advice, trading advice, or any other sort of advice.
**Trading involves substantial risk of loss** and is not suitable for every investor. Past performance is not indicative of future results. Always conduct your own research and consult with a qualified financial advisor before making any investment decisions.
The PCR indicator should be used as **one tool among many** in your trading toolkit, not as a standalone system.
---
## ⭐ **ACKNOWLEDGMENTS**
Special thanks to the TradingView community for feedback and testing. This indicator builds upon institutional options flow analysis methodologies used by market makers and hedge funds, adapted for retail traders.
---
**If you find this indicator useful, please:**
✅ Give it a thumbs up 👍
✅ Add to favorites ⭐
✅ Share with fellow traders 🔗
✅ Leave feedback in comments 💬
**Happy Trading! 🚀📊**
---
### **Version History**
- **v1.0** (Dec 2025): Initial release with institutional-grade PCR analytics
MTF rsi/stoch imdI just built this indicator.
It displays a multi-timeframe (MTF) table directly on the chart, showing Stoch RSI K and RSI values per timeframe.
Cell background colors are driven by predefined value ranges, while text color turns green or red depending on whether the value is rising or falling compared to the previous candle on the same timeframe.
The RSI color conditions are based on the levels 36, 46, 56, and 65.
The Timeframe Pack selector works as follows:
Pack 1 (BNC): 3m, 9m, 27m, 1h, 81m, 3h, 9h, 12h, 1D, 3D, 1W, 9D
Pack 2: 1h through 24h
Pack 3: 1D through 24D
Pack 4 (Custom): fully user-defined timeframes via the 24 slots
Only when Pack 4 (Custom) is selected do the custom timeframe slots apply; in Packs 1–3 they are ignored.
All visual behavior (box colors, text colors, transparency, or a single-color override) is configurable under Style, and the entire table can be toggled on or off.

10>20,p>50 DEMARenders daily EMA, 10, 20 and 50 on any timeframe below 1D
30m timeframe works well.
Use trend of 10 > 20 + price > 50 for long and 10 < 20 + price < 50 for shorts or exits.

Nifty Hierarchical Macro GuardOverview
The Nifty Hierarchical Macro Guard is a "Market Compass" indicator specifically designed for Indian equity traders. It locks its logic to the Nifty 50 Index (NSE:NIFTY) and applies a strict hierarchy of trend analysis. The goal is simple: prioritize the long-term trend (Monthly/Weekly) to decide if you should even be in the market, then use the short-term trend (Daily) for precise exit timing.
This script ensures you never ignore a macro "crash" signal while trying to trade minor daily fluctuations.
The Color Hierarchy (Priority Logic)
The indicator uses a "Top-Down" filter. Higher timeframe signals override lower timeframe signals:
Level 1: Monthly (Ultra-Macro) — Deep Maroon
Condition: Nifty 10 EMA is below the 20 EMA on the Monthly chart.
Action: This is the highest priority. The background will turn Deep Maroon, overriding all other colors. This is your "Forget Trading" signal. The long-term structural trend is broken.
Level 2: Weekly (Macro Warning) — Dark Red
Condition: Monthly is Bullish, but Nifty 10 EMA is below the 20 EMA on the Weekly chart.
Action: The background turns Dark Red. This indicates a significant macro correction. You should stay out of fresh positions and protect capital.
Level 3: Daily (Tactical) — Light Red / Light Green
Condition: Both Monthly and Weekly are Bullish (Green).
Action: The background will now react to the Daily 10/20 EMA cross.
Light Green: Nifty is healthy; safe for fresh positions.
Light Red: Tactical exit signal. Nifty is seeing short-term weakness; exit positions quickly.
Key Features
Symbol Locked: No matter what stock you are viewing (Reliance, HDFC, Midcaps), the background only reacts to NSE:NIFTY.
Clean Interface: No messy lines or labels on the price chart. The information is conveyed purely through background color shifts.
Customizable: Change the MA types (EMA/SMA) and lengths (e.g., 10/20 or 20/50) in the settings.
Macro Dashboard: A small, transparent table in the top-right corner displays exactly which timeframe is currently controlling the background color.
How to Use for Nifty Strategy
Stay Out: If the chart is Deep Maroon or Dark Red, do not look for "buying the dip." Wait for the macro health to return.
Take Exits: If the background is Light Green and suddenly turns Light Red, it means the Daily Daily 10/20 cross has happened. Exit your Nifty-sensitive positions immediately.

FVG MTF Consensus OscillatorFVG MTF Consensus Oscillator
A multi-timeframe, multi-component oscillator that combines momentum, deviation, and slope analysis across multiple timeframes using Zeiierman's Chebyshev-filtered trend calculation. This indicator identifies potential turning points with zone-based signal classification and timeframe consensus filtering.
Backed by ML/Deep Learning evaluation on ES Futures data from 2015-2024.
🎯 Concept
Traditional oscillators suffer from two major weaknesses:
Single measurement - relying on one metric makes them susceptible to noise
Single timeframe - missing the bigger picture leads to fighting the trend
The FVG MTF Consensus Oscillator addresses both issues by combining three independent measurements across three timeframes into a weighted consensus signal.
The Three Components
Momentum - How fast is the trend moving?
Deviation - How far has price stretched from the trend?
Slope - What is the short-term directional bias?
The Three Timeframes
TF1 (Chart) - Your current chart timeframe (lowest weight)
TF2 (Medium) - Typically 1H or 4H (medium weight)
TF3 (High) - Typically 4H or Daily (highest weight)
By requiring agreement across multiple components AND multiple timeframes, the oscillator filters out noise while capturing meaningful, high-probability market movements.
🔧 How It Works
The Core: Chebyshev Type 1 Filter
At its heart, this indicator uses a Chebyshev Type 1 low-pass filter (inspired by Zeiierman's FVG Trend) to extract a clean trend line from price action. Unlike simple moving averages, the Chebyshev filter offers:
Sharper cutoff between trend and noise
Minimal lag for a given smoothness level
Controlled overshoot via the ripple parameter
Three Oscillator Components
1. Momentum Component
Momentum = Current Trend Value - Previous Trend Value
Measures the velocity of the trend. High positive values indicate strong upward acceleration, while high negative values show downward acceleration.
2. Deviation Component
Deviation = Close Price - Trend Value
Measures how far price has stretched away from the trend line. Useful for identifying overextended conditions and mean reversion opportunities.
3. Slope Component
Slope = Change in Trend over 3 bars
Captures the short-term directional bias of the trend itself, helping confirm trend changes.
Normalization & Component Consensus
Each component is individually normalized to a -100 to +100 scale using adaptive scaling. The oscillator output is a weighted average of all three components, allowing you to emphasize different aspects based on your trading style.
Multi-Timeframe Weighting
The final oscillator value combines all three timeframes using configurable weights:
Combined = (TF1 × Weight1 + TF2 × Weight2 + TF3 × Weight3) / Total Weight
Default weights (1, 2, 3) ensure higher timeframes have more influence, keeping you aligned with the dominant trend while timing entries on lower timeframes.
📊 Zone System
The oscillator uses a fuzzy zone system to classify market conditions:
ZoneRangeInterpretationSignal ColorNeutral-5 to +5No clear bias, avoid tradingGrayContinuation±5 to ±25Trend pullback, continuation setupsAquaDeep Swing±25 to ±50Extended move, stronger setupsGreenReversalBeyond ±50Extreme extension, reversal potentialOrange
When "Show Zone Background" is enabled, the background shading darkens as the oscillator moves into more extreme zones, providing instant visual feedback.
📈 Signal Interpretation
Turn Signals
The indicator plots triangular markers when the oscillator changes direction:
▲ Triangle Up (bottom): Oscillator turning up from a low
▼ Triangle Down (top): Oscillator turning down from a high
Signal Quality by Zone
Not all signals are equal. The signal color indicates which zone the turn occurred in:
ColorZoneProbabilityBest UseGrayNeutralLowAvoid or use very tight stopsAquaContinuationModerateTrend continuation entriesGreenDeep SwingHigherSwing trade entriesOrangeReversalHighestCounter-trend with caution
Timeframe Consensus Filter
Signals only fire when the required number of timeframes agree on direction. With default settings (TF Consensus = 2), at least 2 of 3 timeframes must be moving in the same direction for a signal to trigger.
This prevents:
Taking longs when higher timeframes are bearish
Taking shorts when higher timeframes are bullish
Whipsaws during timeframe disagreement
Trend Coloring
The combined oscillator line changes color based on trend direction:
Light purple (RGB 240, 174, 252): Majority of timeframes trending up
Dark purple (RGB 84, 19, 95): Majority of timeframes trending down
Info Table
When MTF is enabled, a table in the top-right corner displays:
Current oscillator values for each timeframe (TF1, TF2, TF3)
Combined value (CMB)
Color coding: Green = rising, Red = falling
⚙️ Settings Guide
Timeframe Settings
SettingDefaultDescriptionEnable Multi-TimeframeOnMaster switch for MTF functionalityTF1 (Chart)"" (current)First timeframe, typically your chart TFTF2 (Medium)60Second timeframe, typically 1HTF3 (High)240Third timeframe, typically 4HTF1/TF2/TF3 Weight1 / 2 / 3Influence of each TF on combined signal
Timeframe Tips:
Keep TF1 ≤ TF2 ≤ TF3 (ascending order)
For day trading: 5m / 15m / 1H
For swing trading: 1H / 4H / Daily
For position trading: 4H / Daily / Weekly
Display Settings
SettingDefaultDescriptionShow All TimeframesOffDisplay individual TF oscillator linesShow Combined LineOnDisplay the weighted combined oscillatorShow Zone BackgroundOffShade background based on current zone
Trend Filter Settings
SettingDefaultDescriptionTrend Ripple4.0Filter responsiveness (1-10). Higher = faster but more overshootTrend Cutoff0.1Cutoff frequency (0.01-0.5). Lower = smoother trendNormalization Length50Lookback for scaling. Longer = more stable
Component Weights
SettingDefaultDescriptionMomentum Weight1.0Emphasis on trend speedDeviation Weight1.0Emphasis on price stretch from trendSlope Weight1.0Emphasis on short-term trend direction
Component Tips:
For trend-following: Increase Momentum and Slope weights
For mean reversion: Increase Deviation weight
Set any weight to 0 to disable that component
Zone Thresholds
SettingDefaultDescriptionNeutral Zone5Inner boundary (±5 = neutral)Continuation Zone25Middle boundary for continuation setupsDeep Swing Zone50Outer boundary for reversal zone
Adjust based on instrument volatility. More volatile instruments may need wider zones.
Signal Filters
SettingDefaultDescriptionSignal Cooldown3Minimum bars between signalsMin Turn Size2.0Minimum oscillator change for valid turnTF Consensus Required2Minimum TFs agreeing for signal (1-3)
💡 Usage Examples
Example 1: Trend Continuation (Dip Buying)
Setup: Uptrend confirmed by higher timeframes
Check the info table - TF2 and TF3 should show green (rising)
Wait for TF1 to pull back, oscillator enters Continuation zone
Enter on Aqua ▲ signal (turn up with TF consensus)
Stop below recent swing low
Target: Previous high or next resistance
Why it works: You're buying a dip in an established uptrend with multi-timeframe confirmation.
Example 2: Deep Swing Entry
Setup: Extended move showing exhaustion
Oscillator reaches Deep Swing zone (±25 to ±50)
At least 2 TFs start showing the same direction
Enter on Green signal indicating momentum exhaustion
Use tighter stop as the move is already extended
Target: Return to Continuation zone or trend line
Why it works: Extended moves tend to mean-revert. The zone system identifies these opportunities.
Example 3: Reversal Setup (Advanced)
Setup: Extreme extension with diverging timeframes
Oscillator reaches Reversal zone (beyond ±50)
Watch for TF1 to turn while TF3 is still extended
Enter on Orange signal - this is counter-trend!
Use smaller position size and wider stops
Target: Return to Deep Swing or Continuation zone
Why it works: Extreme extensions eventually correct. The orange signal marks high-probability reversal points.
Example 4: Avoiding Bad Trades
What to avoid:
Gray signals in Neutral zone - No edge, random noise
Signals against TF3 direction - Fighting the dominant trend
Signals without TF consensus - Timeframe disagreement = choppy market
Multiple signals in quick succession - Let cooldown filter work
🔬 Multi-Timeframe Analysis Tips
Reading the Info Table
The info table shows real-time oscillator values:
| TF1 | TF2 | TF3 | CMB |
| 23.5 | 45.2 | 67.8 | 52.1 |
All green: Strong uptrend across all timeframes
All red: Strong downtrend across all timeframes
Mixed colors: Potential transition or consolidation
Timeframe Alignment States
TF1TF2TF3Interpretation↑↑↑Strong bull - look for long entries↓↓↓Strong bear - look for short entries↑↑↓Pullback in downtrend - caution on longs↓↓↑Pullback in uptrend - caution on shorts↑↓↑Choppy - reduce position size↓↑↓Choppy - reduce position size
The Power of Consensus
With TF Consensus = 2, signals only fire when 2+ timeframes agree. This single filter eliminates most whipsaws and keeps you aligned with the dominant trend.
For more conservative trading, set TF Consensus = 3 (all timeframes must agree).
⚠️ Important Notes
This indicator does not predict the future. It measures current market conditions and momentum across multiple timeframes.
Always use proper risk management. No indicator is 100% accurate.
Combine with price action. The oscillator works best when confirmed by support/resistance, candlestick patterns, or other confluence factors.
Respect the higher timeframe. When TF3 disagrees, trade smaller or sit out.
Zone signals are probabilistic. Orange (reversal) signals have higher probability but aren't guaranteed reversals.
Adjust settings per instrument. Default settings are optimized for ES Futures but may need tuning for other markets.
🧪 ML/Deep Learning Background
The default parameters and zone thresholds were evaluated using machine learning techniques on ES Futures data spanning 2015-2024. This included:
Optimization of component weights
Zone threshold calibration
Timeframe weight balancing
Signal filter tuning
While past performance doesn't guarantee future results, the parameters represent a data-driven starting point rather than arbitrary defaults.
🙏 Credits
This indicator is inspired by Zeiierman's Multitimeframe Fair Value Gap (FVG) indicator, specifically utilizing concepts from his Chebyshev Type 1 filter implementation for trend calculation.
Original indicator: Multitimeframe Fair Value Gap – FVG (Zeiierman)
📝 Changelog
v1.0
Initial release
Three-component consensus oscillator (Momentum, Deviation, Slope)
Multi-timeframe support with weighted combination
Fuzzy zone classification system
Configurable component and timeframe weights
TF consensus filter for signal quality
Signal cooldown and minimum turn size filters
Real-time info table with TF values
Optional zone background shading

Consolidation Zones Volume Delta | Flux ChartsGENERAL OVERVIEW:
The Consolidation Zones Volume Delta | Flux Charts indicator is designed to identify and visualize consolidation zones on the chart. Rather than only outlining areas of sideways price movement, the indicator analyzes volume activity occurring inside each consolidation zone. This is done by aggregating lower-timeframe volume data into the higher-timeframe consolidation range, allowing users to see how buying and selling activity evolves while price remains in a range.
What is the theory behind the indicator?:
The indicator is built around three core analytical concepts that guide how consolidation zones are detected and evaluated.
1. Consolidation as a structural phase
Periods of consolidation are characterized by reduced directional movement and compressed price ranges. During these phases, price action often alternates within a defined high–low boundary, creating a structure that can be objectively measured and tracked over time.
2. Volume behavior inside consolidation
While price may appear balanced within a consolidation range, volume activity inside that range can vary. The indicator evaluates volume contributions occurring within the vertical boundaries of the consolidation zone by using lower-timeframe data and weighting each candle’s volume based on its overlap with the zone. This produces an internal volume delta profile that reflects how buying and selling volume accumulates throughout the consolidation.
Delta behavior inside a zone may show:
Persistent dominance of buying or selling volume
Alternating shifts between buyers and sellers
Periods of relatively balanced participation
3. Markets consolidate in multiple ways, one detection method is not enough
Markets do not consolidate in a single, uniform way. To account for this, the indicator includes three distinct consolidation detection methods. Each method is calculated objectively, does not repaint, and targets a different type of sideways or low-expansion price behavior:
Candle Compression
ADX Low Trend Strength
Visual Range Boundaries
CONSOLIDATION ZONES VOLUME DELTA FEATURES:
The Consolidation Zones Volume Delta indicator includes 4 main features:
Consolidation Zones
Volume Delta
Standard Deviation Bands
Alerts
CONSOLIDATION ZONES:
🔹What is a Consolidation Zone?
A consolidation zone is a defined price range where market movement becomes compressed and price remains contained within clear upper and lower boundaries for a sustained period of time. During this phase, price does not establish a strong directional trend and instead oscillates within a relatively narrow range.
🔹Consolidation Zone Detection
The indicator automatically detects consolidation zones using three independent, rule-based methods. Each method evaluates a different market condition and can be selected individually depending on how you want consolidation to be defined. Regardless of the method used, all zones are calculated objectively and finalized once confirmed.
◇ Candles (Candle Compression)
The Candles method identifies consolidation by detecting periods of candle compression and reduced range expansion. A candle is considered part of a consolidation sequence when:
The candle body is small relative to its total range
The candle’s high–low range is smaller than the short-term Average True Range (ATR)
ATR is calculated using a 4-period average true range and is used as a volatility reference. If consecutive candles continue to meet these compression conditions, the indicator increments an internal count.
Under the Consolidation Candles section in the settings, you’ll find two controls.
Min. Consolidation Candles setting
This defines how many consecutive compressed candles are required before a consolidation zone is confirmed. Candle compression is determined using candle structure and short-term ATR, ensuring that only periods of reduced range expansion are counted. Once the minimum threshold is reached, the indicator creates a consolidation zone using the highest high and lowest low formed during the compressed sequence.
Mark Consolidation Candles
When enabled, the indicator highlights candles that meet the compression criteria, making it easy to visually identify which candles contributed to the formation of the consolidation zone.
◇ ADX (Low Trend Strength)
The ADX method identifies consolidation based on weak or declining trend strength rather than candle structure. This method uses the Average Directional Index (ADX) to determine when directional movement is reduced.
ADX is calculated using directional movement values that are smoothed over time. When ADX remains below a user-defined threshold, price is treated as being in a low-trend market. While this condition persists, the indicator tracks the highest high and lowest low formed during the low-trend period.
Under the ADX Settings section in the settings, you’ll find the following controls.
ADX Length
Defines the lookback period used to calculate directional movement for ADX.
ADX Smoothing
Controls the smoothing applied to the ADX calculation.
ADX Threshold
Sets the level below which ADX must remain for the market to be considered consolidating.
Consolidation Strength
Defines how many consecutive candles’ ADX must stay below the threshold before a consolidation zone is confirmed. Once this requirement is met, the indicator creates a consolidation zone using the accumulated high and low from the low-trend window.
Mark Candles Below Threshold
When enabled, the indicator highlights candles where ADX remains below the threshold.
◇ Visual Range
The Visual Range method identifies consolidation by detecting clearly defined horizontal price ranges where price remains contained for a sustained period of time. The indicator continuously tracks the rolling highest high and lowest low across recent candles. When price remains inside the same high–low boundaries without breaking above or below the range, an internal counter advances.
Under the Visual Range section in the settings, you’ll find the following control.
Min. Candles in Range
Defines how many consecutive candles must remain fully contained within the same high–low range before a consolidation zone is confirmed. Once this requirement is met, the indicator creates a consolidation zone using the established range boundaries.
🔹Consolidation Zone Settings
◇ Invalidation Method
Users can choose how Consolidation Zones are invalidated, selecting between Close Break or Wick Break.
Close Break: A Consolidation Zone is invalidated when a candle closes above/below the zone.
Wick Break: A Consolidation Zone is invalidated when a candle’s wick goes above/below the zone.
◇ Merge Overlapping Zones
When enabled, overlapping Consolidation Zones are automatically combined into one unified zone.
◇ Show Last
This setting determines how many Consolidation Zones are displayed on your chart. For example, setting this to 5 will display the 5 most recent zones.
VOLUME DELTA:
Delta Volume visualizes how buying and selling volume accumulates inside each consolidation zone. Instead of using the full candle volume, the indicator isolates only the volume that occurs within the vertical boundaries of the zone. This allows you to see whether bullish or bearish volume is dominating while price remains range-bound. The visualization updates in real time while the zone is active and reflects cumulative participation rather than individual candles.
🔹How Volume Delta is Calculated
Delta Volume is calculated using lower-timeframe data and applied to the higher-timeframe consolidation zone.
Each candle’s volume is split into bullish or bearish volume based on candle direction.
Lower-timeframe candles are pulled using the selected delta timeframe.
For each lower-timeframe candle, only the portion of volume that vertically overlaps the consolidation zone is counted.
Volume is weighted by the amount of overlap between the candle’s range and the zone’s range.
Bullish and bearish volume are accumulated over time to form a running, cumulative delta profile for the zone.
🔹Volume Delta Settings
◇ Enable
Turns the Delta Volume visualization on or off. Consolidation zones continue to plot when disabled.
◇ Show Delta %
Displays the percentage breakdown of bullish versus bearish volume inside the consolidation zone. Percentages are derived from cumulative volume totals.
◇ 3D Visual
When enabled, the delta blocks are extended diagonally using a depth offset derived from the instrument’s daily ATR. This creates visible side faces and top faces for the delta blocks, simulating depth without altering any calculations. The 3D effect is purely visual. It does not change how volume is calculated, weighted, or accumulated.
Users can control the intensity of the 3D effect choosing a value between 1 and 5. Increasing this value increases:
The horizontal offset of the delta blocks
The vertical depth projection applied to the volume faces
Higher values produce a more pronounced 3D appearance by pushing the delta visualization further away from the consolidation box. Lower values keep the visualization flatter and closer to the box boundaries. The depth scaling is normalized using ATR, so the effect adapts proportionally to the instrument’s volatility.
◇ Volume Delta Display Style
Controls how bullish and bearish volume are displayed inside the Consolidation Zone:
Horizontal: Volume is split top-to-bottom within the zone
Vertical: Volume is split left-to-right across the zone
◇ Timeframe
Defines the lower timeframe used for Volume Delta calculations. When a timeframe is selected, the indicator pulls lower-timeframe price and volume data and maps it into the higher-timeframe consolidation zone. Each lower-timeframe candle is evaluated individually. Only the portion of its volume that vertically overlaps the consolidation zone is included, and that volume is weighted based on the candle’s overlap with the zone’s price range. If the Timeframe field is left empty, the indicator defaults to using the chart’s current timeframe for delta calculations.
Using a lower timeframe increases the granularity of the delta calculation, allowing volume changes inside the zone to be measured more precisely. Using a higher timeframe produces a smoother, less granular delta profile.
Please Note: Delta rendering is automatically limited to available lower-timeframe data to prevent incomplete or distorted visuals when historical lower-timeframe volume is unavailable due to TradingView data limits.
STANDARD DEVIATION BANDS:
Standard Deviation Bands project measured price distance away from a confirmed consolidation zone using the size of that zone as the reference unit. Rather than calculating volatility from historical price dispersion, the bands are derived directly from the height of the consolidation range itself. Each band represents a fixed multiple of the consolidation zone’s height and is plotted symmetrically above and below the zone.
🔹How the bands are calculated
Once a consolidation zone is finalized, the indicator calculates the zone height as:
Zone Height = Zone High − Zone Low
This value becomes the base measurement for all deviation calculations. For each enabled band:
Upper bands are placed above the consolidation zone’s high
Lower bands are placed below the consolidation zone’s low
The distance of each band from the zone is calculated by multiplying the zone height by the selected band multiplier. These band levels are fixed relative to the consolidation zone and do not recalculate based on future price movement.
🔹Standard Deviation Band Settings
◇ Band 1
Enables the first deviation band above and below the consolidation zone. The Band 1 multiplier defines how far the band is placed from the zone in terms of zone height. For example, a multiplier of 1 plots the band one full zone height above and below the consolidation range.
◇ Band 2
Enables a second deviation band at a greater distance from the consolidation zone. Band 2 uses its own multiplier and is calculated independently of Band 1, allowing multiple expansion levels to be displayed simultaneously.
◇ Fill Bands
When enabled, the area between the consolidation zone and each deviation band is filled with a semi-transparent color. Upper fills apply to bands above the zone, and lower fills apply to bands below the zone. Fills are static and tied directly to the consolidation zone boundaries.
◇ Color Customization
Each deviation band has independent color controls for:
Upper band lines and fills
Lower band lines and fills
This allows users to visually distinguish between bullish and bearish extensions as well as between multiple deviation levels.
ALERTS:
Users can create alerts for the following:
New Consolidation Zone Formed
Consolidation Zone Break
UNIQUENESS:
This indicator combines multiple consolidation detection methods with lower-timeframe volume delta analysis inside each consolidation zone. It visualizes bullish and bearish volume using weighted overlap logic and optional 3D rendering for improved clarity. Users can choose how volume is displayed, apply structure-based deviation bands, and enable alerts for new zones and zone breaks. All features are rule-based, configurable, and designed to work together within a single framework.

Intermarket SSMT Table [Pogiest]General
Intermarket Sequential Smart Money Technique (IMSSMT) is a Quarterly Theory concept that identifies divergences (extreme highs/lows) when comparing different market triads to another market triad in two consecutive quarters.
SSMT involves identifying divergences in a correlated asset triad that occurs consecutively from the previous quarter to the current quarter to predict new phases of price, a shift in market sentiment, and also potential trend reversals. An SSMT divergence occurs when one or two assets makes a new high or low, but the other asset or assets does not, signaling a potential shift in market direction. A Hidden SSMT Divergence occurs when one or two assets’ closing price closes higher or lower than the other one or two assets’ closing price. However, with potential gaps in price, an opening price can also be the extreme when comparing assets for divergences. Hidden SSMT divergence compares the candle bodies while a Standard SSMT divergence compares the highs and lows. Both types of SSMTs are considered to be cracks in correlation and can be used to identify potential new phases of price whether it be a reversal, retracement, consolidation, and continuation.
Credit of concepts/ideas: ICT & TraderDaye
What Makes This Indicator Unique
The indicator table is designed to be used on any symbol the trader is viewing. For example, the indicator is shown on an NQ chart while selecting three symbols in the Forex triad in settings. The indicator will request the separate data from the symbols selected and display the data within the table. The table does not rely on data on the chart being viewed. Instead of switching charts, the table is used to track other market triads for SSMTs (standard & hidden) while viewing other markets simultaneously.
The indicator has the ability to display Standard SSMTs, Hidden SSMTs, or both simultaneously in real-time, tick by tick in the time period selected in a correlated asset triad within the table. Toggle modes for each type of SSMT will run independently (runs when enabled) and therefore, optimizes performance. The user is able to select three different tickers in settings instead of limiting to pairs. In addition, the indicator has “Invert” toggle options to track both Standard and Hidden SSMTs for assets with negative correlations.
How the Indicator Table Works
The indicator functions to track any divergences from the previous quarter to the current quarter. In addition, the indicator tracks the current status even when there are no divergences (see phase column below).
Timeframe Column:
1. Displays up to two different timeframes to monitor.
Asset Columns:
1. Display up to three different assets to monitor.
2. Cells display “Bull” in green background color or “Bear” in red background color showing the current state of each candle and updates in real-time tick by tick.
Phase Column:
Displays the current status from the previous quarter to the current quarter. The status updates in real-time tick by tick.
1. “F/S” indicates there are no current SSMT divergences between the previous quarter to the current quarter and all assets have not swept the previous quarter, a “failure swing”.
2. “HH” is displayed when all assets have swept the previous quarter’s extreme high. (Higher High)
3. “LL” is displayed when all assets have swept the previous quarter’s extreme low. (Lower Low) See screenshot with drawings below.
4. SSMT indicates there is an SSMT from the previous quarter to the current quarter. Red background is a bearish SSMT (divergence at the highs) or green background is a bullish SSMT (divergence at the lows). If the SSMT becomes invalid (i.e. the last asset sweeps the extreme high/low), then the table will update to display either “HH” or “LL” depending on the extreme it swept. See screenshot with drawings below.
5. “Both” indicates there are SSMT divergences at both the extremes highs and lows. If an SSMT on one side gets deleted, then the cell will automatically update to display the SSMT that is still intact. See screenshot with drawings below.
Invert Toggle Option:
When this setting is turned on, the asset column cells will display the inverted color of the live chart to show assets are in-sync. It will track the inverted swing points for SSMTs, higher highs, lower lows, etc. For example, if EUR and GBP are making lower highs, while DXY (Inverted toggle on), makes a lower low on the actual live chart, it will display “SSMT”.
NOTE:
Scanning function per timeframe to detect SSMTs:
Weekly HTF: Scans 4HR bars
Daily HTF: Scans 1HR bars
6HR/4HR HTF: Scans 15m bars
1HR HTF: Scans 5m bars
5m HTF: Scans 1m bars
The script has fixed lookback periods for bars to ensure the appropriate data is being captured. The higher the timeframe the user selects in settings while viewing on an extremely lower timeframe, the indicator may give inaccurate readings:
Recommended Chart Timeframes:
For best performance and accuracy, view your chart on a timeframe close to or lower than the scan timeframe:
Weekly HTF → View on 1H-4H chart
Daily HTF → View on 1H-4H chart
6HR/4HR HTF → View on 5m-15m chart
90M HTF → View on 3m-15m chart
1H HTF → View on 1m-15m chart
The indicator will attempt to scan further back if needed, but extremely low chart timeframes (e.g., 1m) with high HTF (e.g., Weekly) may still have limitations.
In addition, the indicator bases the SSMT off the previous quarter’s time range to the current quarter’s time range. If there are discrepancies in the time ranges (start to end of higher timeframe period selected), the SSMTs may display differently than what is viewed on the chart. For example, indices open at 18:00 est on a new trading day, so the time ranges matches throughout the day. However, in Forex, EUR and GBP opens at 17:00 est while DXY opens later, so the time ranges may be off (i.e. 6 hour timeframe). For best use, select time periods that matches throughout the day.
Usage
Traders can use both types of SSMT divergences to anticipate potential reversals in points of interest such as higher timeframe swing points, supply/demand zones, higher timeframe imbalances, key levels, etc. This indicator can also be beneficial in identifying cracks in correlation via Hidden SSMT when there are no divergences off the highs and lows. Divergences can come in different forms relating to Intermarket SSMT. For example, if one market triad is all making lower lows while the other market triad is making higher highs, this can be deemed a divergence between the two markets. Another example would be one market triad all makes lower lows while another market triad makes a bullish SSMT. This can potentially signal a bullish move up. SSMT divergences (standard and hidden) can be used as a confirmation tool with other confluences to identify trend direction with respect to points of interest, higher timeframe order-flow, lower timeframe order-flow, etc. In addition, having both a Standard SSMT and Hidden SSMT divergence display could potentially signal a reversal. It is up to the trader to gauge the price action at the time.
Settings
1. Choose up to three different assets to monitor.
Note: If only two are selected, the indicator will only display the two selected and compare the two assets for divergences. If one is selected, a warning sign will be displayed to select at least two assets.
2. Choose up to two different timeframes. Option to deselect timeframes.
3. Enable/disable standard or hidden SSMT.
4. Option to enable alerts. Alerts include the different phases in the table (i.e. SSMT, HH, LL, and Dual SSMT [both standard & hidden) for each timeframe.
5. Toggle option to show/hide the table. Toggle option to show/hide the “Title Row” which is the first row at the top of the table.
6. Adjust the table positioning to be displayed on the chart.
7. Option to change text size in the table cells. This will also increase/decrease the size of the table.
Risk Disclaimer
This indicator is for educational and informational purposes only and does not constitute financial advice. All trading and investment decisions remain solely the responsibility of the user.
Trading involves a high degree of risk, and past performance is not indicative of future results.
Always conduct your own research and consult with a qualified financial professional before making any trading decisions.
By using this indicator, users acknowledge they understand these risks and accept full responsibility for their trading decisions and outcomes.

Big Trades Whale Detector [Volume Anomalies] By HKOverview The "Big Trade Detector" helps you spot institutional footprints by identifying volume anomalies that act as outliers compared to recent history. It uses statistical analysis (Standard Deviation) to filter out noise and highlight only significant buying or selling pressure.
Features:
Volume Decomposition: Approximates buy/sell volume based on price action within the candle (Close vs. Range).
3-Tier Detection: Uses dynamic thresholds to categorize volume spikes into Small, Medium, and Extreme events.
Smart Calculation: Compares current volume against the previous average to detect sudden shifts in momentum.
Visuals:
Green Circles (Below Bar): Unusual Buying Pressure (Support defense or Breakout).
Red Circles (Above Bar): Unusual Selling Pressure (Resistance defense or Dump).
Size Matters: The larger the circle, the higher the standard deviation (Sigma) of that volume event.

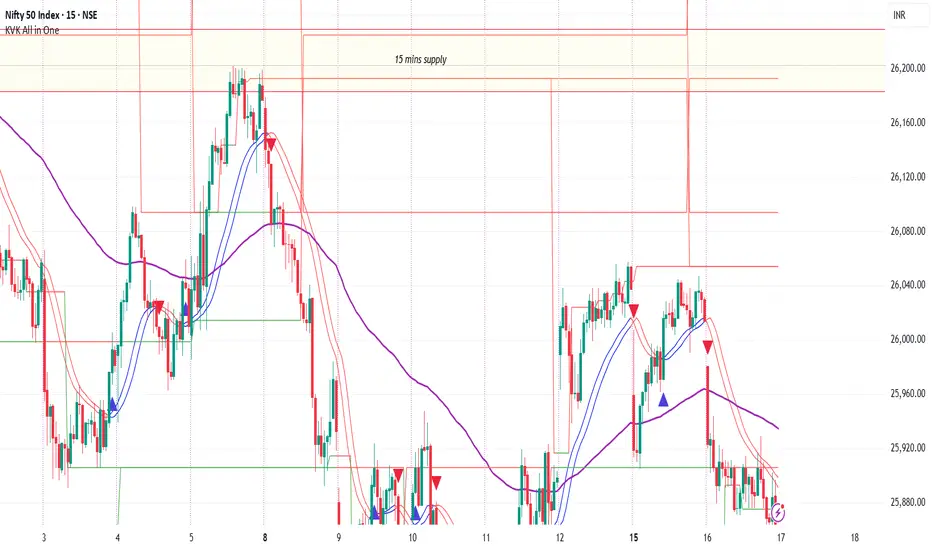
SIDD EMA RSI Supertrend Signal Table🔥 SIDD EMA RSI SuperTrend Multi-Timeframe Signal Table
**SIDD EMA RSI SuperTrend Signal Table** is a **clean, powerful multi-timeframe trend confirmation dashboard** designed for traders who want **clarity, confluence, and speed** — all in one glance.
This indicator **does NOT repaint** and uses **industry-standard trend logic** combining **EMA structure, RSI momentum, and SuperTrend direction** across **6 different timeframes**.
---
## 🧠 Core Logic Behind the Indicator
This script works on **three independent trend engines**, displayed together in a compact table:
### ✅ 1️⃣ EMA Trend (Structure Based)
* Uses **EMA 50 vs EMA 200**
* **Bullish** → EMA 50 above EMA 200
* **Bearish** → EMA 50 below EMA 200
* Captures **primary market structure**
### ✅ 2️⃣ RSI Trend (Momentum Based)
* RSI Length: **14**
* **Bullish** → RSI > **55**
* **Bearish** → RSI ≤ **55**
* Helps confirm **trend strength & momentum**
### ✅ 3️⃣ SuperTrend (Price Action Based)
* ATR Length: **10**
* Factor: **3.0**
* Clearly defines **trend direction & trailing bias**
* Excellent for **entry & exit alignment**
---
## ⏱️ Multi-Timeframe Coverage
The table analyzes trends across **6 configurable timeframes**:
* Intraday → **5m, 15m, 1H**
* Swing → **4H, Daily**
* Positional → **Weekly**
Each timeframe shows:
* 📈 EMA Trend
* 📊 RSI Trend
* 🔁 SuperTrend Direction
Color-coded for instant readability:
* 🟢 Bullish
* 🔴 Bearish
* ⚪ Neutral
---
## 🎯 How to Use This Indicator
✔ **Trend Trading**
Trade only when **EMA + RSI + SuperTrend align** across higher & lower timeframes.
✔ **Intraday Confirmation**
Use higher TF (1H / 4H) bias and take entries on lower TF.
✔ **Avoid Chop & False Signals**
If signals are mixed → market is likely **sideways or risky**.
✔ **Swing & Positional Trades**
Daily + Weekly alignment gives **high-probability setups**.
---
## ⚙️ Customization Options
* Adjustable **timeframes**
* Table **position** (Top/Bottom – Left/Right)
* Table **size** (Extra Small / Small / Normal)
* Custom **colors, borders & text**
* Optimized for **minimal chart clutter**
---
## ⚠️ Disclaimer
This indicator is a **trend confirmation & decision-support tool**.
Always combine with **price action, support/resistance, and proper risk management**.

Opposite Candle Zone Identifier (v6) - Extended🔍 Opposite Candle Zone Identifier (Extended)
Opposite Candle Zone Identifier is a price-action based indicator designed to identify potential reversal or absorption zones by detecting candles that move against the surrounding trend.
The indicator highlights a central opposite candle (or group of candles) that is surrounded by candles moving in the opposite direction, both before and after the central candle.
This structure often represents areas where institutional activity, absorption, or supply/demand imbalance may occur.
📌 How the Indicator Works
The indicator analyzes price action using three configurable blocks:
1️⃣ Candles Before (Backward)
A user-defined number of candles before the central candle(s) must follow a consistent trend:
Bullish candles for a bearish zone
Bearish candles for a bullish zone
2️⃣ Central Candle(s)
The core of the pattern:
Default: 1 opposite candle
Can be increased (up to 5) to adapt the indicator to lower timeframes or noisier markets
This central block must move against the previous trend, signaling a potential shift or absorption area.
3️⃣ Candles After (Forward)
A user-defined number of candles after the central candle(s) must resume the original trend, confirming the pattern.
⚠️ The signal is confirmed only after the “after” candles are completed.
This avoids repainting and ensures structural confirmation.
📐 Zone Concept
The highlighted central candle (or candles) can be used to define a price zone:
The high and low of the central candle(s) represent a potential supply or demand zone
These zones can be used for:
Reversal areas
Reaction zones
Entry refinement
Stop placement
⚙️ Inputs & Customization
Number of candles before
Controls how many candles must follow the initial trend.
Number of candles after
Defines how many candles are required for confirmation.
Central candles count
Default is 1, but can be increased (e.g. 2) for:
Lower timeframes
More reliable structure
Reduced noise
ATR-based offset
Labels are positioned using a dynamic ATR offset to improve chart readability across different markets and timeframes.
📈 Bullish & Bearish Zones
🟢 Bullish Zone
Bearish candles before
Bullish central candle(s)
Bearish candles after
Indicates potential demand or accumulation zone
🔴 Bearish Zone
Bullish candles before
Bearish central candle(s)
Bullish candles after
Indicates potential supply or distribution zone
🧠 Best Use Cases
Works best on 15m and higher timeframes
Effective on:
Indices
Forex majors
Liquid cryptocurrencies
Can be combined with:
Trend filters (EMA, VWAP)
Support & resistance
Market structure analysis
⚠️ Notes
This indicator is confirmation-based, not predictive
Signals appear only after pattern completion
It does not repaint
Best used as a confluence tool, not as a standalone trading system
🎯 Summary
Opposite Candle Zone Identifier helps traders:
Detect opposite-direction candles within strong trends
Identify potential supply and demand zones
Adapt the pattern to different timeframes
Improve price-action based decision making

FMT_TRENDFOLLOWiNGThis indicator is developed based on the Average Directional Index (ADX) , which is used to measure the strength of a trend, regardless of price direction. It has been custom-modified and optimized specifically for the FCPO market, with the following usage structure:
• 30-Minute Timeframe (HTF)
Used to identify the major market movement.
When the ADX value is above 25, it indicates that the market is entering a strong trending phase.
• 5-Minute Timeframe (LTF)
Acts as a confirmation for trend change or continuation, indicated by color changes (Green/Red) and the appearance of a Reconnect Dot when momentum becomes active again.
• 1-Minute Timeframe
Used for Buy or Sell entries at the nearest trading zones, aligned with the trend direction and strength from higher timeframes.
This indicator is suitable for Day Trading and Momentum Trading strategies, especially for FCPO traders who focus on market structure and momentum confirmation.
⚠️ DISCLAIMER: This indicator is provided for educational and technical analysis purposes only and does not constitute financial advice or a trading recommendation. All signals are derived from technical calculations and may produce false signals depending on market conditions. Users are fully responsible for their trading decisions, including risk management and position sizing. Past performance does not guarantee future results, and users are encouraged to conduct paper trading or backtesting before using it in live trading.

JK Scalp - Nishith RajwarJK Scalp Nishith Rajwar
Multi-Stochastic Rotation & Momentum Scalping Framework
JK Scalp is a rule-based momentum and rotation oscillator designed for short-term scalping and intraday execution.
It focuses on how momentum rotates across multiple stochastic speeds, instead of relying on a single oscillator or lagging averages.
This is an execution aid, not a predictive indicator.
🧠 Concept & Originality
Unlike standard stochastic tools, JK Scalp uses four synchronized stochastic layers:
• Fast (9,3) → execution timing
• Medium (14,3) → structure confirmation
• Slow (44,3) → swing context
• Trend (60,10,10) → dominant momentum regime
The core idea is quad-rotation:
High-probability trades occur when all momentum layers rotate together after reaching an extreme.
This script combines:
• Momentum rotation
• Divergence logic
• Flag continuation logic
• Trend-state filtering
into a single cohesive framework, not a simple indicator mashup.
📊 How to Use (Step-by-Step)
1️⃣ Best Timeframes
• Scalping: 1m – 3m
• Intraday: 5m – 15m
• Avoid higher timeframes (not designed for swing holding)
Works best on:
• Index options
• Index futures
• Highly liquid stocks
• Crypto majors
2️⃣ Understanding the Signals
🔁 Quad Rotation (Core Signal)
A valid rotation requires:
• Fast, Medium, Slow, and Trend stochastic moving in the same direction
• Momentum exiting Overbought / Oversold zones
• Trend stochastic supporting the move
This filters out random oscillator noise.
3️⃣ Entry Conditions
🟢 LONG Setup
• Bullish quad rotation
• Either:
– Bullish divergence OR
– Bullish flag pullback
• Fast stochastic turning up
🔴 SHORT Setup
• Bearish quad rotation
• Either:
– Bearish divergence OR
– Bearish flag pullback
• Fast stochastic turning down
⚠️ Signals are confirmation-based, not anticipatory.
4️⃣ SUPER LONG / SUPER SHORT
These appear only when:
• Quad rotation
• Divergence confirmation
They represent high-confidence momentum inflection zones, not guaranteed reversals.
5️⃣ Stop-Loss Visualization
Optional SL zones are plotted using:
• Recent swing high / low
• ATR-based buffer (configurable)
This helps traders visualize risk, not automate exits.
🎨 Visual System (Why It Looks Different)
• Multi-layer glow effects → momentum strength
• Dynamic cloud → fast vs trend dominance
• Color-shifting fast line → acceleration vs decay
• Chart overlays → execution clarity without clutter
Everything is designed for speed and readability during live trading.
⭐ Unique Selling Points (USP)
✅ Multi-speed stochastic rotation (not single-line signals)
✅ Context-first, not signal spam
✅ Built-in divergence + continuation logic
✅ Non-repainting logic
✅ Designed for scalpers, not hindsight analysis
✅ Works across indices, options, crypto, and futures
⚠️ Important Notes
• Not a standalone trading system
• Best combined with:
– Market structure
– Key levels
– Session timing
• Avoid low-liquidity or news-spike candles
This indicator guides execution, it does not replace discretion.
👤 Who This Is For
• Scalpers & intraday traders
• Options traders needing precise timing
• Traders who understand momentum & structure
• Users who want fewer but higher-quality signals
🏁 Summary
JK Scalp helps you trade momentum rotation, not overbought/oversold myths.
Wait for alignment. Execute with discipline.

CRT+ Advance Engulfing | @stefandimovCRT+ Lite implements institutional-style Candle Range Theory logic to identify displacement-driven engulfing structures with precision.
The script focuses on wick-based liquidity grabs, strict body closes, and optional higher-timeframe confirmation to highlight structurally valid bullish and bearish reversals.
Includes a Daily-only multi-market scanner and a compact dashboard for fast top-down analysis.
Designed for traders who prioritize structure, execution precision, and HTF alignment.

Universe_Super MA [MTF & Multi-Type]**Overview**
"Universe_Super MA" is a comprehensive trend analysis tool designed to overcome indicator limits. Instead of adding 4 separate moving averages, this script allows you to monitor 4 distinct Moving Averages within a single indicator slot.
It features full **Multi-Timeframe (MTF)** capabilities, meaning you can view higher timeframe trends (e.g., Daily 200 SMA) while trading on lower timeframes (e.g., 15-minute chart).
**Default Configuration (Institutional Setup)**
The indicator comes pre-loaded with a powerful institutional trend setup:
1. **50 Period (Green):** Short-term trend and dynamic support.
2. **99 Period (Orange):** Medium-term trend filter.
3. **200 Period (Red):** The classic institutional dividing line between Bull and Bear markets.
4. **389 Period (Blue):** A long-term "Deep Trend" baseline used to identify major market cycles and heavy support/resistance levels.
**Key Features**
* **fully Customizable:** You can change the Length, Color, and Width of each line.
* **Multi-Timeframe (MTF):** Select any timeframe for any MA. (e.g., Keep MA1 on the "Chart" timeframe, but lock MA4 to the "Daily" timeframe).
* **6 MA Types:** Choose between SMA, EMA, WMA, HMA (Hull), RMA, and VWMA for each line independently.
* **Clean Interface:** Toggle any line On/Off via settings without removing the indicator.
**Usage & Interpretation**
* **Trend Identification:** The 200 (Red) and 389 (Blue) lines are designed to visualize the long-term market bias. In technical analysis, price action sustaining above these levels is generally considered a bullish context, while price below suggests a bearish context.
* **Crossover Monitoring:** The script facilitates the observation of interactions between short-term and long-term averages (e.g., the 50 crossing the 200), allowing users to easily spot common technical patterns like the "Golden Cross".
* **Dynamic Levels:** The 99 and 200-period lines act as dynamic levels that may align with technical support or resistance zones during market retracements.
**Settings**
* **Timeframe:** Leave empty to use the current chart's timeframe, or select a specific one (e.g., "1D" or "4H").
* **Type:** Select your preferred calculation method (SMA is default).
**Disclaimer**
This tool is for educational purposes and trend visualization only. Always manage your risk.
