Hidden BreakerHidden Breaker
DESCRIPTION
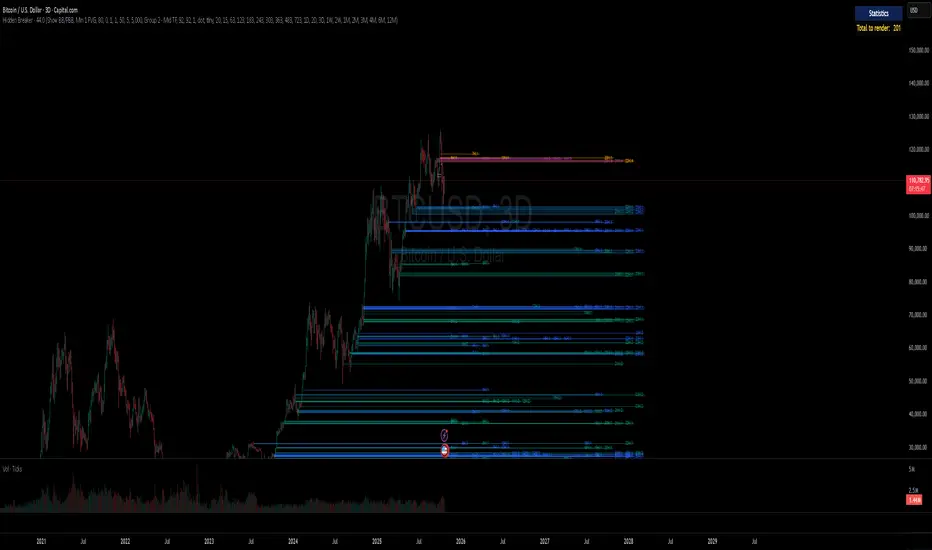
The Hidden Breaker identifies Order Blocks and tracks their transformation when they interact with Fair Value Gaps. It displays both standard Order Blocks and those modified by FVG (Breaker Blocks) across multiple timeframes within a single chart view.
METHODOLOGY ORIGIN
This indicator is based on concepts from the MoneyTaur trading methodology, which focuses on identifying Order Blocks hidden behind Fair Value Gaps from the multi-timeframe perspective.
WHAT MAKES THIS UNIQUE
- Box Management System: User-controlled box allocation through dynamic filters, ensuring all detected blocks remain visible within Pine Script's 500 box limit. Users can manage which blocks to display through price range and filter adjustments.
- Creates unified columnar visualization
- Processes 70+ timeframes (incl custom)
- Tracks each block's complete lifecycle
KEY FEATURES
Order Blocks (OB): Detects engulfing candle patterns between candle bodies with customizable deviation tolerance.
Breaker Blocks (BB): Order Blocks (candle body) that crossed Fair Value Gaps by 100% without being touched by wicks.
Partial Breaker Blocks (PBB): Candle bodies that didn't fit 100% within an FVG or were partially mitigated by wicks. Min BB size in % after passing FVG is adjustable within filter.
Multi-Timeframe Analysis: Processes 70+ timeframes without repainting
Visual Organization: Displays blocks in columns by timeframe for easy comparison. Spacing is adjustable within menu.
FVG Counter: Shows interaction count (1-5) for each block
Statistics Table: Real-time monitoring of detected blocks
Price Range Filter: Manages Pine Script's 500 box limit effectively
HOW IT WORKS
The indicator uses a three-stage detection process:
Stage 1 - Order Block Detection:
Identifies engulfing patterns where one candle body fully engulfs the body of the previous opposite candle. The system allows for small price deviations. The detected zone spans from the open to close of the engulfed candle.
Stage 2 - FVG Interaction:
Monitors for Fair Value Gaps that occur when the candle's low is above the high from two candles ago (bullish gap) or when the high is below the low from two candles ago (bearish gap). When such a gap overlaps an existing Order Block, the system evaluates:
Checks whether the OB’s body is fully contained within the FVG range (passed 100% through it without wick contact) — shown as 1H | 1, where 1H is the timeframe and 1 the FVG count.
The percentage of the OB body retained within the FVG after zone adjustment is filter-controlled.
Directional bias is inherited from the FVG.
Blocks with multiple FVG interactions (counted 1–5+) allow filtering of BBs based on their FVG overlap frequency.
Stage 3 - Single or Multi-Timeframe Processing:
Collects data from multiple timeframes simultaneously, processes it without repainting, and displays horizontal boxes with timeframe labels arranged in vertical columns, where each timeframe occupies its own designated horizontal space for clear visual separation.
DETECTION CRITERIA
Order Block: Engulfing with body-to-body alignment within adjustable deviation tolerance
Breaker Block: OB that intersects with subsequent FVG. When filter is set to 100%, shows only BBs where the body fully passed through FVG without wick touches.
Partial Breaker Block (PBB): An Order Block partially intersected by an FVG or partially mitigated by a subsequent candle, narrowing the original Breaker Block range.
FVG validation: Gap between candles 1 and 3
VISUAL GUIDE
Green: Bullish Order Blocks
Red: Bearish Order Blocks
Blue: Bullish Breaker Blocks
Orange: Bearish Breaker Blocks
Teal: Bullish Partial Breaker Blocks
Purple: Bearish Partial Breaker Blocks
Numbers: FVG interaction count (1-5)
Percentages: Remaining unmitigated area
SETTINGS
Block Type Selection: Choose to display OB only, BB/PBB only
Deviation (%): Tolerance for engulfing pattern detection
Min Engulfing Impulse (%): Minimum required price movement for valid engulfing
FVG Filter: Set minimum FVG count required (1-5)
Min BB Size after FVG (%): Minimum remaining size of an BB after passing an FVG
Hide if Mitigated More Than (%): Visibility threshold for partially mitigated blocks
Price Range Filter (%): Limit Block detection to specific price ranges from current price
Price Range Axis (%): Offset reference point for price range
Timeframe Groups: Select from 6 predefined groups or custom timeframes
Max Bars to Scan: Historical lookback period (100-10000)
Replay Mode: used for historical backtesting and visual analysis for higher TF data.
TIMEFRAME GROUPS
Group 1: Minutes & Short Hours (5m-4H)
Group 2: Extended Hours (5H-23H)
Group 3: Days (1D-19D)
Group 4: Weeks (1W-12W)
Group 5: Months (1M-12M)
Group 6: 19 Custom timeframes
USAGE NOTES
Select appropriate timeframe groups for your analysis style
Adjust deviation and impulse settings based on market volatility
Use FVG filter to focus on blocks with multiple gap interactions
Monitor the statistics table to ensure box count stays under 500. If approaching limit, narrow the price range filter
Each box shows its description aligned vertically by timeframe
TECHNICAL SPECIFICATIONS
Pine Script Version 6
Default scan range: 5000 historical bars
Maximum 500 boxes per chart (Pine Script limitation)
Non-repainting calculations
Compatible with all markets and timeframes
Optimized memory management for multi-timeframe processing
TERMS AND CONDITIONS
This indicator and its documentation do not constitute financial or investment advice.
Users should make independent trading decisions and accept full responsibility for their outcomes.
Use of this tool implies that you understand the risks of financial markets and agree that the author is not liable for any loss or damage arising from its use.
This indicator is designed solely as a visualisation tool to assist with chart analysis.
It does not teach, promote, or automate any specific trading strategy, concept, or methodology.
All visual elements — such as OBs, BBs, PBBs, FVGs, and related interactions — are intended to support manual study and backtesting, not to generate trading signals.
Past performance does not guarantee future results. By using this tool, users agree to these terms.
Multitimeframe
Multitime TrendThis indicator combines 3 of the most powerful components:
Component Timeframe Purpose
EMA Fast & Slow Current chart timeframe Defines the dynamic trend (faster reaction to trend shifts)
Tchimoku (Tenkan / Kijun) Current chart timeframe Identifies the current price equilibrium zone (mean reversion)
Multi-Timeframe Ichimoku H5 (5 minutes) & H1 (1 hour) Confirms higher timeframe trend to filter noise & avoid trading against major trend.
EMA Trend (Primary Direction)
ema_fast = EMA 34
ema_slow = EMA 72
If EMA 34 crosses above EMA 72 → Bullish Trend
If EMA 34 crosses below EMA 72 → Bearish Trend
EMA color changes automatically (lime = buy, red = sell).
Tchimoku Tenkan-Kijun (Mean Reversion Logic)
Not using full Ichimoku — only Tenkan + Kijun, enhanced with ATR
If Tenkan > Kijun → short-term momentum is bullish
If Tenkan < Kijun → short-term momentum is bearish
Both lines are plotted and color-filled to visualize which side has control
→ More sensitive than EMA → reacts faster to real-time market flow.
Higher Timeframe Confirmation (H5 + H1)
Using the same Tenkan/Kijun algorithm, but calculated from:
H5 (5-minute timeframe)
H1 (1-hour timeframe)
If both H5 & H1 show the same fill color (teal = bullish, red = bearish):
→ Higher timeframe MTF confluence is confirmed
→ Helps avoid entering against dominant macro trend even if current chart shows minor reversal.
Role of This Indicator
Acts as a trend filter & smart bias detector, helping you decide BEFORE entering a trade.
It does not auto-execute trades, but instantly tells you:
✅ Should I BUY?
✅ Should I SELL?
❌ Should I STAY OUT because higher timeframe is against me?

ZEN MTF Price ProjectionZEN MTF Price Projection
A lightweight, multi‑timeframe price projection that extends a ZigZag‑style path into the future. It chains six timeframes (1m → 5m → 15m → 1H → 4H → 1D) where each segment continues the previous one, creating a continuous forward path of arrows. The engine blends expected move and volatility to estimate the next leg for each TF. Calculations are proprietary and optimized for real‑time updates.
Caution
Treat the projection as a guide, not a guarantee. Avoid trading directly against higher‑TF segment direction.
Key features
MTF chained path: each TF continues the previous, producing a continuous forward “ZigZag‑style” projection.
Real‑time or timed updates: redraws every bar (Realtime) or every N minutes.
Visual arrows every N bars for readability; configurable segment length per TF.
Resource‑safe rendering with automatic cleanup.
Inputs (quick guide)
Bars per timeframe: number of bars each TF projects forward.
Arrow every N bars: density of arrows along each segment.
Update mode: Realtime or Every N minutes (default 1).
Colors: up/down palette for projected segments.
Alerts and workflow tips
Use Trading Panel alerts on color changes of the active segment (manual rule).
Combine with your execution playbook (e.g., candle confirmation, volume burst, or LTF pullback).
Best with liquid markets and regular sessions; widen SL on high‑volatility assets.
What this indicator is not
Not a crystal ball; it’s a probabilistic forward path based on proprietary MTF expectations and volatility scaling.
Not a replacement for risk management or market context.
Disclaimer
For educational purposes only. Past performance is not indicative of future results. Trade at your own risk.

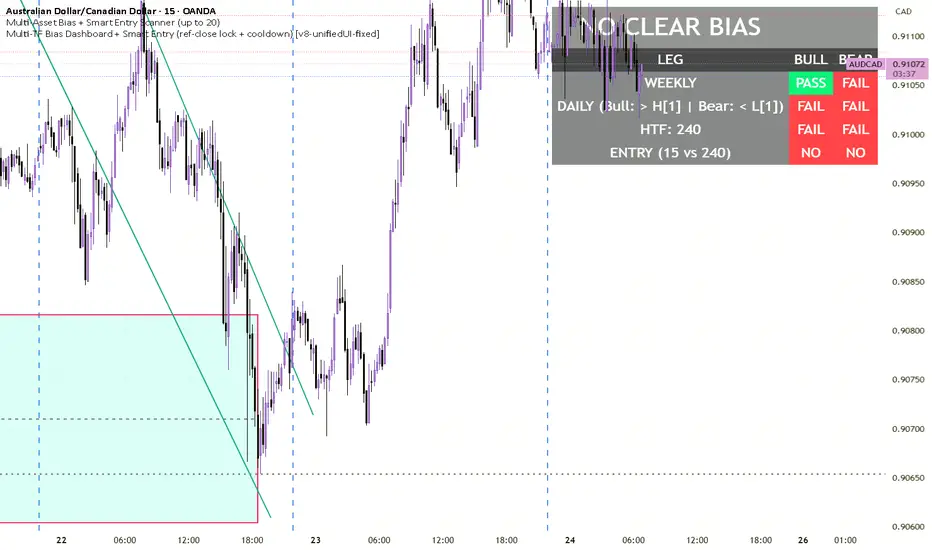
Multi-TF Bias Dashboard + Smart Entry V8Multi-TF Bias Dashboard + Smart Entry provides a complete top-down bias and entry confirmation system for professional traders.
It evaluates Weekly, Daily, and Custom HTF (e.g. 4H) candle structures to define directional bias, then synchronizes entry triggers from a lower timeframe using a reference–entry lock and optional cooldown filter to prevent overtrading.
A unified dashboard panel displays:
✅ Weekly / Daily / HTF leg PASS-FAIL logic
✅ Auto-locked entries only after reference bar close
✅ Bias banner (Bullish / Bearish / Neutral)
✅ Cooldown timer (Bars or Minutes) to space entries
✅ Real-time alerts + on-chart entry markers
Choppiness Index | CipherDecodedThe Choppiness Index is a multi-timeframe regime indicator that measures whether price action is trending or consolidating.
This recreation was inspired by the Choppiness Index chart from Checkonchain, with full credit to their team for the idea.
🔹 How It Works
CI = 100 * log10( SUM(ATR(1), n) / (highest(high, n) – lowest(low, n)) ) / log10(n)
Where:
n – lookback length (e.g. 14 days / 10 weeks / 10 months)
ATR(1) – true-range of each bar
SUM(ATR(1), n) – total true-range over n bars
highest(high, n) and lowest(low, n) – price range over n bars
Low values → strong trend
High values → sideways consolidation
Below is a simplified function used in the script for computing CI on any timeframe:
f_ci(_n) =>
_tr = ta.tr(true)
_sum = math.sum(_tr, _n)
_hh = ta.highest(high, _n)
_ll = ta.lowest(low, _n)
_rng = _hh - _ll
_rng > 0 ? 100 * math.log10(_sum / _rng) / math.log10(_n) : na
Consolidation Threshold — 50.0
Trend Threshold — 38.2
When Weekly CI < Trend Threshold, a trending zone (yellow) appears.
When Weekly CI > Consolidation Threshold, a consolidation zone (purple) appears.
Users can toggle either background independently.
🔹 Example Background Logic
bgcolor(isTrend and Trend ? color.new(#f3e459, 50) : na, title = "Trending", force_overlay = true)
bgcolor(isConsol and Cons ? color.new(#974aa5, 50) : na, title = "Consolidation", force_overlay = true)
🔹 Usage Tips
Observe the Weekly CI for regime context.
Combine with price structure or trend filters for signal confirmation.
Low CI values (< 38) indicate strong trend activity — the market may soon consolidate to reset.
High CI values (> 60) reflect sideways or range-bound conditions — the market is recharging before a potential new trend.
🔹 Disclaimer
This indicator is provided for educational purposes.
No trading outcomes are guaranteed.
This tool does not guarantee market turns or performance; it should be used as part of a broader system.
Use responsibly and perform your own testing.
🔹 Credits
Concept origin — Checkonchain Choppiness Index

Overnight Gap Detector - 4H Body to BodyThis TradingView indicator automatically detects and tracks overnight price gaps based on 4-hour candle bodies, displaying them as colored rectangles on your chart.
Key Features:
Gap Detection:
Identifies true wick-to-wick gaps that occur at the start of each new trading day
Gap Up: Detected when previous candle's high is below current candle's low
Gap Down: Detected when previous candle's low is above current candle's high
Rectangles are drawn from candle body to body (not wicks), providing clean gap zones
Gap Tracking:
Gaps are marked as "GAP HOLE" when first detected
Automatically tracks when gaps get filled
Changes to "FILLED" label and color when price closes through the gap zone
Gaps extend horizontally until filled or chart end
Customizable Display:
Label Position: Choose between "Inside" (centered in box) or "Outside" the gap rectangle
Label Offset: Adjust how far from the right edge labels appear (0-50 bars)
Minimum Gap Size: Filter out small gaps by setting minimum percentage threshold (default 0.05%)
Max Stored Gaps: Control how many gaps are kept on chart (default 200)
Visual Options:
Optional midline showing the 50% fill level of each gap
Fully customizable colors for Gap Up, Gap Down, and Filled gaps
Separate transparency controls for box backgrounds and label backgrounds
Adjustable border and midline widths
Toggle labels and midlines on/off
Color Coding:
Green: Gap Up (default)
Red: Gap Down (default)
Yellow: Filled gaps (default)
Perfect for traders who use gap-fill strategies or want to track key price levels where gaps occurred

Dual Median TrendSyncDual Median TrendSync ~ GForge
Revolutionary trend-following system that combines dual median analysis with adaptive momentum deviation bands for precise market timing across all asset classes.
🎯 WHAT IS MEDIAN TRENDSYNC?
Median TrendSync is a sophisticated technical indicator that leverages the statistical power of dual median calculations combined with dynamic momentum deviation analysis. Unlike traditional moving average systems that can be skewed by outliers, this system uses robust median-based calculations to identify genuine trend changes while filtering out market noise. The result is a highly adaptive system that works across all timeframes and asset classes, with exceptional performance in volatile 24/7 markets.
🔬 CORE INNOVATION: MOMENTUM DEVIATION TECHNOLOGY
The breakthrough feature of this system is its proprietary Momentum Deviation Bands - a secondary layer of adaptive volatility analysis applied to the oscillator itself. This creates a "volatility-of-volatility" measurement that dynamically adjusts to changing market conditions, providing earlier and more precise entry signals compared to traditional threshold-based systems.
Key Technical Advantages:
Dual Median Architecture: Two independent median systems work in harmony, each analyzing different price aspects and timeframes to capture both micro and macro trend shifts.
Adaptive Volatility Bands: Standard deviation bands that automatically expand during volatile periods and contract during consolidation, ensuring consistent signal quality regardless of market conditions.
Momentum Deviation Analysis: Advanced oscillator-level volatility measurement that identifies extreme momentum zones for optimal entry timing.
Statistical Robustness: Median calculations are inherently resistant to price spikes and false breakouts, providing more reliable trend identification than mean-based methods.
🌍 WHY IT'S UNIVERSAL: WORKS ACROSS ALL MARKETS
Asset Class Agnostic Design:
The system's median-based foundation makes it remarkably versatile across different asset classes:
Cryptocurrencies: Exceptional performance in 24/7 volatile markets with large price swings
Forex: Adapts to currency pair characteristics and varying volatility regimes
Stocks: Reliable trend identification for both individual stocks and indices
Commodities: Handles the unique cyclical nature of commodity markets
Futures: Robust performance across diverse futures contracts
Timeframe Flexibility:
Works seamlessly from Short-term to long-term position trading (daily/weekly charts). The adaptive nature of the system automatically calibrates to the chosen timeframe's volatility profile.
🚀 OPTIMIZED FOR CRYPTOCURRENCY MARKETS
While the system is universal, it truly excels in crypto for several key reasons:
24/7 Market Dynamics: Continuous price action allows the median calculations to build more comprehensive statistical profiles without overnight gaps.
High Volatility Adaptation: Crypto's extreme volatility is exactly where adaptive deviation bands shine - they expand during volatile moves and contract during consolidation, maintaining signal accuracy.
Trend Persistence: Crypto markets often exhibit strong, sustained trends that the dual median system is specifically designed to capture and ride.
Noise Filtering: The median-based approach naturally filters out the "pump and dump" spikes and flash crashes common in crypto, focusing on genuine trend changes.
Momentum Clarity: Crypto's clear momentum phases (accumulation, markup, distribution, markdown) align perfectly with the momentum deviation detection system.
⚙️ HOW THE SYSTEM WORKS
Signal Generation Process:
Dual Median Calculation: Two independent median systems analyze price action using different lookback periods and price sources, providing multi-dimensional market perspective.
Deviation Band Creation: Statistical volatility bands are constructed around each median using adaptive standard deviation measurements.
Oscillator Normalization: Price position relative to deviation bands is converted to a normalized oscillator reading (0-100+ scale).
Momentum Deviation Analysis: A secondary volatility layer is applied to the oscillator itself, creating dynamic momentum deviation bands that identify extreme zones.
Threshold Crossing Detection: When momentum deviation bands cross specific thresholds, high-probability trend change signals are generated.
5 Signal Combination Modes:
Median1 Only: Uses the primary median system for signals
Median2 Only: Uses the secondary median system for signals
Average: Combines both systems by averaging their readings (most balanced)
Both Required: Generates signals only when both systems agree (highest accuracy)
Either One: Triggers when either system signals (highest sensitivity)
📊 COMPREHENSIVE VISUAL ANALYTICS
Multi-Layer Visualization System:
Gradient Bar Coloring: Real-time visual representation of oscillator state with smooth color transitions from bearish to bullish zones
Dynamic State Bar: Bottom-of-chart gradient indicator showing current momentum position at a glance
Optional Overlay Bands: Deviation bands, threshold lines, and median lines can be displayed directly on the price chart for enhanced context
Momentum Deviation Bands: Visual representation of the advanced volatility-of-volatility measurement
Signal Markers: Clear diamond indicators for entry and exit points
Professional Metrics Dashboard:
The integrated analytics table displays real-time performance metrics:
Net Profit & Current P&L
Win Rate & Total Trades
Maximum Drawdown
Calmar Ratio (return/risk efficiency)
Sharpe Ratio (risk-adjusted returns)
Sortino Ratio (downside risk focus)
Half Kelly Position Sizing Recommendation
Current Position & Momentum Deviation State
1D & 1H BTC
🎮 FLEXIBLE TRADING MODES
Long/Short Mode: Full bi-directional trading for maximum opportunity capture
Long/Cash Mode: Conservative approach - only long positions with cash during bearish periods
Both modes include comprehensive backtesting with date range filtering and detailed performance analytics.
⚡ ALERT SYSTEM
Built-in alert conditions for:
Long signal detection
Short signal detection
Cash/exit signal detection
Never miss a trading opportunity with customizable TradingView alerts.
💡 BEST PRACTICES FOR OPTIMAL RESULTS
Start with Default Settings: The system is pre-optimized for broad market applicability. Test default parameters before making adjustments.
Match Mode to Market: Use "Average" mode for balanced signals, "Both Required" for higher accuracy in choppy markets, "Either One" for trending markets.
Timeframe Selection: While universal, the system shows exceptional results from low timeframes up to the daily timeframe.
Combine with Risk Management: Use the Kelly ½ recommendation as a starting point for position sizing.
Monitor Metrics: Keep the metrics table visible to track real-time performance and adjust strategy as needed.
Respect the Oscillator Gradient: The bar coloring provides continuous feedback - avoid counter-trend entries when gradient shows strong directional color.
🔒 CLOSED SOURCE - PROPRIETARY ALGORITHM
This indicator features a proprietary algorithm developed through extensive research and testing. The code is protected and closed-source to preserve the intellectual property of the unique momentum deviation methodology.
⚠️ DISCLAIMER
This indicator is a technical analysis tool designed to assist in trading decisions. Past performance does not guarantee future results. Always conduct your own research and use proper risk management. This tool should be used as part of a comprehensive trading strategy, not as a standalone solution.
📈 UNLOCK PRECISION TRADING WITH MEDIAN TRENDSYNC
Experience the power of dual median analysis combined with advanced momentum deviation technology. Whether you're trading crypto, forex, stocks, or any other asset class, Median TrendSync adapts to deliver consistent, reliable signals across all market conditions.
Developed by GForge Trading Systems

CBC Flip StrategyThe CBC Flip Strategy is a momentum-based trading system that identifies shifts in market control by monitoring price closes relative to previous bars' highs and lows: it flips to bullish mode when the close exceeds the prior high (indicating bulls in control) and enters a long position, or to bearish mode when the close falls below the prior low (indicating bears in control) and enters a short position, all while incorporating optional confluences like higher timeframe CBC alignment, RSI thresholds (above 50 + offset for longs, below 50 - offset for shorts), and EMA positioning (above for longs, below for shorts) to filter entries; trades are restricted to a user-defined session window and direction preferences, with exits handled via tick-based TP/SL, reversal on chart or higher timeframe CBC flips, and an optional flatten at a specified time to close all positions.
Number of Contracts: Adjust the quantity of contracts per trade (default: 1).
SL and TP Ticks: Set stop-loss (default: 12 ticks) and take-profit (default: 24 ticks) distances from entry.
Exit Strategy: Choose from TP/SL in ticks, exit on chart CBC flip (reverses on opposite signal), or exit on higher timeframe CBC flip.
Flatten All: Enable/disable flattening all positions at a customizable time (default: 16:00, with adjustable hour/minute).
Trading Session: Define the time window for allowing entries (default: 0800-1700).
Trade Direction: Select "Both" (longs and shorts), "Only Long", "Only Short", or "Towards Daily Open" (longs if below daily open, shorts if above).
Higher Timeframe CBC Confluence: Toggle use of HTF CBC alignment (default: enabled, with customizable HTF like "240").
RSI Confluence: Toggle RSI filter (default: enabled, with adjustable length=14, offset=20 for thresholds).
EMA Confluence: Toggle EMA filter (default: enabled, with adjustable length=200 for position relative to price).

VipPro VWAP Momentum Tracker — Auto Buy/Sell + Fibonacci TPVipPro VWAP Momentum Tracker is an auxiliary tool designed to complement the main VipPro Realtime indicator.
It is primarily used on lower timeframes to filter false entries and refine intraday precision.
The script combines VWAP (Volume Weighted Average Price) with short-term momentum analysis and Fibonacci-based target projection.
It automatically generates two technical profit levels derived from Fibonacci extensions — 1.27 and 1.61 — providing a structured approach to short-term trade management.
VWAP acts as the dynamic reference line (orange).
When price is above VWAP, it reflects buying pressure and potential long setups.
When price is below VWAP, it suggests selling pressure and potential short opportunities.
The VWAP represents the market’s fair-value zone based on both price and volume, making it one of the most reliable metrics for identifying institutional positioning and volume-weighted trend direction.
This tool can be used independently or in combination with VipPro Realtime, especially when confirming signals from the upper dashboard that summarizes:
Market trend
Liquidity conditions
Momentum strength
RSI and volatility context
Overbought/Oversold signals
Results may vary depending on the trader’s experience and ability to interpret market structure in conjunction with VWAP behavior and momentum alignment.

Vip Pro Realtime VipPro Realtime — Technical Overview
VipPro Realtime is a multi-layer analytical indicator designed for real-time liquidity and momentum tracking across all markets on TradingView.
It integrates price structure, volatility, and volume dynamics into a unified dashboard that allows traders to visually interpret market phases in seconds.
🔹 Core Components
Directional Framework (Trend Logic)
VipPro Realtime uses a dual-EMA structure to determine short- and mid-term momentum alignment.
When both layers confirm, the background color changes to visualize the prevailing trend:
🟢 Green → bullish momentum
🔴 Red → bearish momentum
⚪ Gray → corrective or neutral phase
Liquidity & Volume Mapping
The script evaluates volume pressure relative to its moving average and applies a dynamic volume-to-volatility ratio.
This helps detect where actual market participation occurs instead of relying only on price movement.
RSI & Volatility Filters
RSI and ATR values are normalized to reduce noise.
The indicator highlights overbought/oversold conditions and provides contextual volatility levels to help avoid false signals in low-liquidity environments.
VWAP Integration
A VWAP baseline defines fair-value zones and helps identify extension points for potential mean reversion setups.
Open Interest Layer (OI Monitor)
When available, the indicator requests aggregated open interest data from related perpetual markets and calculates short-term deltas to visualize:
📈 Increasing OI with rising price → potential long buildup
📉 Increasing OI with falling price → potential short buildup
⚠️ Decreasing OI → profit-taking or liquidation reduction
Wave & Fibonacci Targeting
The tool automatically identifies impulsive and corrective phases and projects short-term expansion levels (1.27 and 1.61) based on recent swings.
Dashboard Interface
The top-center table summarizes all key parameters:
Trend direction
Liquidity state
Momentum strength
Volatility context
RSI condition
Signal status
OI condition
🔹 Use Case
VipPro Realtime is built for traders who need quantitative confirmation of price behavior rather than subjective pattern recognition.
It helps interpret when a movement is supported by real liquidity inflow/outflow, allowing better timing for entries and exits across intraday or swing strategies.
🔹 Compatibility
✅ Works on all TradingView timeframes
✅ Applicable to crypto, forex, stocks, and commodities
✅ Requires no external data feeds or third-party services
🔹 Important Note
This script does not provide financial advice or guaranteed results.
Its purpose is to enhance situational awareness by merging multiple layers of market data (trend, volume, momentum, and OI) into one simplified view.
Traders should always confirm signals with their own risk management and market understanding.
Feel free to ask any questions at amr@mobeline.de .

Ali's TTM+MFRSIthis indicators gives multiple buy and sell signal based on multiframe RSI and TTM squeeze and some other conditions

Liquidity Swap Detector Ultimate - Cedric JeanjeanAdvanced Smart Money Concepts indicator designed to detect high-probability liquidity sweeps and institutional order flow reversals. This professional-grade tool combines multiple ICT (Inner Circle Trader) strategies to identify optimal entry points.
═══════════════════════════════════════════════════════
📊 KEY FEATURES:
✅ Smart Swing Detection
- Identifies confirmed swing highs and lows using adaptive lookback periods
- Eliminates false signals through double-confirmation logic
- Detects liquidity grabs at key market structure points
✅ Fair Value Gap (FVG) Analysis
- Multi-timeframe FVG detection for enhanced accuracy
- Filters imbalances by minimum size threshold
- Combines current timeframe and higher timeframe FVGs
✅ Advanced Volatility Filter
- ATR-based volatility analysis to avoid low-quality setups
- Adjustable volatility threshold (default 0.35%)
- Ensures entries during optimal market conditions
✅ Precision Signal Generation
- LONG signals: Confirmed swing lows + FVG + volatility confirmation
- SHORT signals: Confirmed swing highs + FVG + volatility confirmation
- Clear visual markers with price labels
✅ Comprehensive Alert System
- Three alert types: Simple, Detailed, JSON (for webhooks)
- Separate LONG/SHORT alert controls
- Compatible with MT5 integration via webhooks
- TradingView native alertcondition support
✅ Professional Dashboard
- Real-time ATR monitoring
- Volatility percentage display
- FVG status indicator
- Alert status tracker
═══════════════════════════════════════════════════════
⚙️ CUSTOMIZABLE PARAMETERS:
🔹 Lookback Swing (1-50): Defines swing detection sensitivity
🔹 ATR Multiplier: Controls wick filter strength
🔹 Volatility Filter: Minimum required market volatility (%)
🔹 FVG Filter: Minimum fair value gap size (%)
🔹 FVG Timeframe: Higher timeframe for multi-TF analysis
🔹 Visual Options: Toggle swing marks, FVG zones, labels
🔹 Alert Controls: Enable/disable LONG/SHORT notifications
═══════════════════════════════════════════════════════
📈 HOW IT WORKS:
1. The indicator scans for confirmed swing points using a robust double-confirmation algorithm
2. Simultaneously analyzes Fair Value Gaps on both current and higher timeframes
3. Validates market volatility to ensure sufficient price movement
4. Generates precise entry signals when all conditions align
5. Triggers customizable alerts for instant notification
═══════════════════════════════════════════════════════
🎯 BEST PRACTICES:
- Use on liquid markets (Forex majors, indices, crypto)
- Recommended timeframes: 15m, 1H, 4H
- Combine with support/resistance for confirmation
- Adjust lookback period based on market volatility
- Test alert settings before live trading
- Use JSON alerts for automated trading integration
═══════════════════════════════════════════════════════
⚡ ALERT CONFIGURATION:
1. Click the Alert icon (bell) in TradingView
2. Select "Liquidity Swap Detector Ultimate - TITAN v6"
3. Choose your preferred alert condition:
- LONG Signal: Only bullish setups
- SHORT Signal: Only bearish setups
- ANY Signal: All trading opportunities
4. Set expiration and notification preferences
5. For MT5 integration: Select "JSON" message type and configure webhook URL

Timeframe LiquidityTimeframe Liquidity – Multi-Timeframe Highs & Lows by
Timeframe Liquidity automatically plots previous day, week, month, and year highs and lows, key liquidity zones used by smart money and price-action traders. These levels extend into the future and can automatically stop once price wicks through, showing clear liquidity sweeps and tested zones.
Perfect for traders using ICT / SMC concepts, liquidity theory, or market structure analysis. Instantly see where liquidity rests, where it’s been taken, and how price reacts at major support and resistance.
Features:
Auto-plots PDH/PDL, PWH/PWL, PMH/PML, PYH/PYL
Custom line styles, colors, and label sizes
Option to stop line on wick (liquidity sweep)
Smart timeframe visibility (hides same-TF levels)
Accurate UTC offset handling
Identify liquidity pools fast, trade cleaner charts, and track where smart money hunts liquidity.
Built for precision, clarity, and confluence.

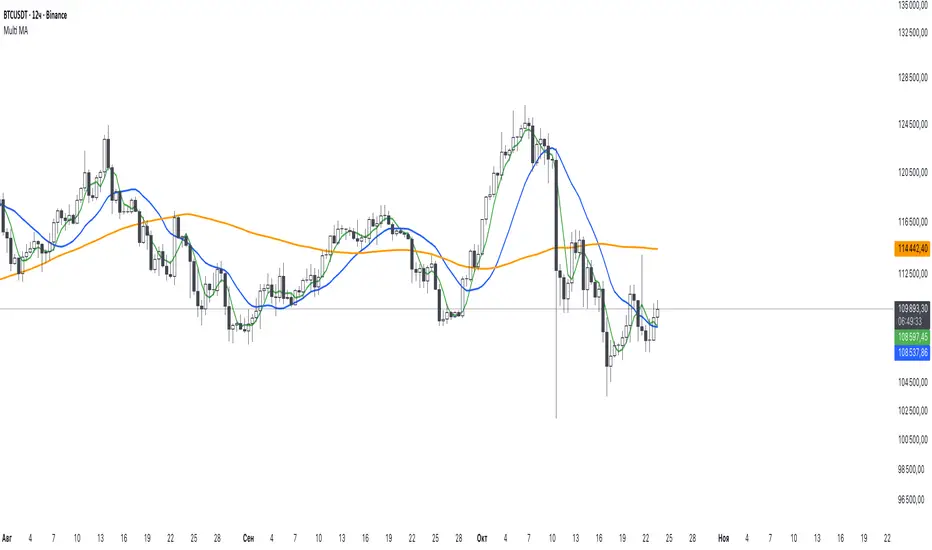
Multi Fixed MAMulti Fixed MA Indicator
This Pine Script indicator displays up to three customizable Moving Averages (MAs) on the chart, allowing users to analyze price trends across different timeframes. Each MA can be independently configured for type, length, timeframe, and colors for bullish and bearish slopes.
Features:
MA Types: Choose from Simple (SMA), Exponential (EMA), Weighted (WMA), or Linear Regression (Linear) MAs.
Customizable Timeframes: Select from a range of timeframes (1min to 1M) for each MA.
Show/Hide MAs: Enable or disable each of the three MAs via checkboxes.
Dynamic Coloring: Each MA changes color based on its slope (bullish or bearish), with user-defined bull and bear colors.
Flexible Lengths: Set individual lengths for each MA.
Usage:
Configure the MA type, length, and timeframe for each of the three MAs.
Toggle visibility for each MA using the "Show" checkboxes.
Customize bull and bear colors for each MA to visually distinguish trends.
The indicator plots MAs on the chart, with colors reflecting whether the current MA value is higher (bullish) or lower (bearish) than the previous value, maintaining the prior color when equal.
Ideal for traders analyzing trends across multiple timeframes with tailored visual cues.