ROC & Momentum FusionROC & Momentum Fusion
(by HabibiTrades ©)
Purpose:
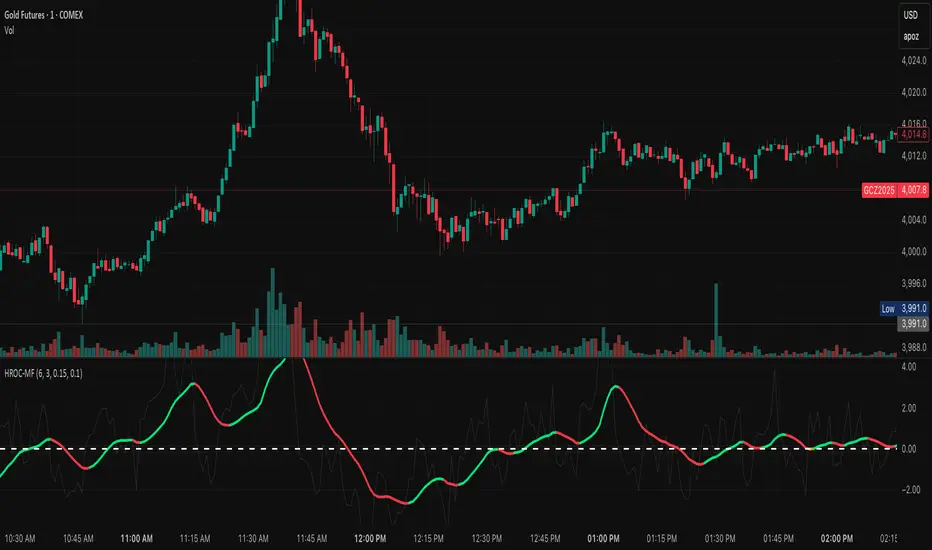
“ROC & Momentum Fusion” combines the Rate of Change (ROC) with a MACD-style signal engine to identify early momentum reversals, confirmed trend shifts, and low-volatility choppy zones.
It’s built for traders who want early momentum detection with the clarity of trend persistence — adaptable to any instrument and timeframe.
⚙️ How It Works
Rate of Change (ROC):
Measures the percentage speed of price change over time, showing the raw momentum strength.
Signal Line (EMA):
A short EMA of the ROC — responds faster to new directional shifts, similar to a MACD signal line.
Histogram:
Displays acceleration and deceleration between the ROC and its signal line.
Persistent Trend States:
When the ROC crosses the signal line or zero, the indicator enters a new momentum regime
(bullish or bearish) and stays in that color until another flip occurs.
Dynamic Choppy Zone:
When ROC momentum fades within the zero buffer zone, the indicator turns orange, signaling a sideways or indecisive market.
🟢 Visual Regimes
Regime Description Color
Bullish Momentum ROC above zero or signal line 🟢 Neon Green
Bearish Momentum ROC below zero or signal line 🔴 Neon Red
Choppy / Neutral ROC hovering within ±threshold range 🟠 Neon Orange
This color system makes it visually effortless to see whether the market is trending, reversing, or consolidating.
🧭 Adaptive Intelligence
The script automatically adjusts to market type and session for consistent accuracy:
Session Adaptive: Adjusts smoothing based on global sessions (Asian, London, New York, Sydney).
Instrument Adaptive: Fine-tunes sensitivity automatically for major assets — NASDAQ (NQ), S&P 500 (ES), Gold (GC), Oil (CL), Bitcoin (BTC).
Volatility Normalization: Optionally divides ROC by its own standard deviation to stabilize noisy assets and maintain consistent scaling.
🔔 Signals & Alerts
Bullish Reversal:
ROC crosses above its signal or zero line — early momentum flip.
Bearish Reversal:
ROC crosses below its signal or zero line — downward momentum flip.
Alerts:
Both reversal conditions include built-in alert triggers for automation and notifications.
🎨 Visual Features
Main ROC Line: Adaptive EMA of ROC, color-coded by trend regime.
Signal Line: Optional white EMA overlay for MACD-style crossovers.
Histogram: Visual burst display of acceleration (green/red).
Reversal Markers: Optional triangles marking exact crossover points.
Threshold Lines: Highlight the zero and buffer zones for visual clarity.
🧩 Best Use Cases
Identify early momentum shifts before price confirms them.
Confirm trend continuation or exhaustion with color persistence.
Detect choppy / low-volatility periods instantly.
Works across all timeframes — from 1-minute scalping to weekly swings.
Combine with structure, EMAs, or volume for confirmation.
⚙️ Recommended Settings
Setting Default Description
ROC Period 6 Core momentum length (lower = faster response).
Signal EMA Length 3 MACD-style responsiveness (lower = more reactive).
Zero Buffer Threshold 0.15 Defines the width of the neutral zone around zero.
Choppy Zone Multiplier 1.0 Expands or tightens the orange zone sensitivity.
These defaults have been optimized through real-market testing to balance responsiveness and smoothness across different asset classes.
⚠️ Notes
The color regime is persistent, meaning once the line turns bullish or bearish, it remains in that state until momentum structurally flips.
The orange zone represents momentum uncertainty and helps avoid false entries in range-bound markets.
Works seamlessly on any timeframe and with any asset.
Multitimeframe
Atif's Liquidity Toolkit💎 GENERAL OVERVIEW:
Atif’s Liquidity Toolkit is a price-action-based indicator used to identify Buyside & Sellside Liquidity Levels, Liquidity Sweeps, FVG Sweeps, and Buy/Sell signals, following specific rules from Atif Hussain.
This indicator was developed by Flux Charts in collaboration with Atif Hussain.
🔹Purpose of this indicator:
The purpose of Atif’s Liquidity Toolkit is to help traders understand where liquidity is forming, when it’s being taken, and how momentum shifts immediately afterward. It automates the entire process of identifying buyside & sellside liquidity, detecting liquidity sweeps, and confirming whether displacement followed through a Fair Value Gap. The goal is to give traders a consistent, rule-based framework to interpret market structure.
🎯ATIF’S LIQUIDITY TOOLKIT FEATURES:
Atif’s Liquidity Toolkit indicator includes 6 main features:
Fair Value Gaps
Multi-Timeframe Liquidity Levels
Liquidity Sweeps
Fair Value Gap Sweeps
Buy & Sell Signals with Take-Profit & Stop-Loss Levels
Alerts
1️⃣Fair Value Gaps
🔹What is a Fair Value Gap?:
A Fair Value Gap (FVG) is an area where the market’s perception of fair value suddenly changes. On your chart, it appears as a three-candle pattern: a large candle in the middle, with smaller candles on each side that don’t fully overlap it. A bullish FVG forms when a bullish candle is between two smaller bullish/bearish candles, where the first and third candles’ wicks don’t overlap each other at all. A bearish FVG forms when a bearish candle is between two smaller bullish/bearish candles, where the first and third candles’ wicks don’t overlap each other at all.
Bullish & Bearish FVGs:
In the settings, you can toggle on/off FVGs, choose the invalidation method, adjust the sensitivity, and toggle on FVG Midline & Labels.
🔹Invalidation Method:
The Invalidation Method setting allows traders to choose how an FVG is invalidated. You can choose between Close and Wick.
Close: A candle must close below a bullish FVG or above a bearish FVG to invalidate it.
Wick: A candle’s wick must go below a bullish FVG or above a bearish FVG to invalidate it.
🔹Sensitivity:
The sensitivity setting determines the minimum gap size required for an FVG detection. A higher sensitivity will filter out smaller gaps, while a lower sensitivity will detect more frequent, smaller gaps. Setting the sensitivity to 0 will display all gaps, regardless of their size.
On the left, the sensitivity is 5. On the right, the sensitivity is 0.
🔹Midline:
When enabled, a dashed line is drawn at the center of the FVG.
🔹Labels:
When enabled, a text label will be plotted with the gap, clearly identifying the zone as a FVG.
2️⃣ Multi-Timeframe Liquidity Levels
The indicator automatically detects and plots Buyside Liquidity (BSL) & Sellside Liquidity (SSL) Levels across up to three timeframes simultaneously.
🔹What is Buyside Liquidity?
Buyside Liquidity (BSL) represents price levels where many buy stop orders are sitting, usually from traders holding short positions. When price moves into these areas, those stop-loss orders get triggered and short sellers are forced to buy back their positions. These zones often form above key highs such as the previous day, week, or month. Understanding BSL is important because when price reaches these levels, the sudden wave of buy orders can create sharp reactions or reversals as liquidity is taken from the market.
🔹What is Sellside Liquidity?
Sellside Liquidity (SSL) represents price levels where many sell stop orders are waiting, usually from traders holding long positions. When price drops into these areas, those stop-loss orders are triggered and long traders are forced to sell their positions. These zones often form below key lows such as the previous day, week, or month. Understanding SSL is important because when price reaches these levels, the surge of sell orders can cause sharp reactions or reversals as liquidity is taken from the market.
Atif’s Liquidity Toolkit indicator automatically plots Buyside & Sellside Liquidity levels using the following levels:
Previous Day High (PDH) & Previous Day Low (PDL)
Previous Week High (PWH) & Previous Week Low (PWL)
Previous Month High (PMH) & Previous Month Low (PML)
Asia Session Highs/Lows
London Session Highs/Lows
New York Session Highs/Lows
The session start and end times are not customizable. The following times in EST are used for each session:
Asia Session: 20:00-00:00
London Session: 02:00-05:00
New York Sessions:
NY AM: 09:30-11:00
NY Lunch: 12:00-13:00
NY PM: 14:00-16:00
Users can also plot swing highs/lows using a lookback period and choosing the higher timeframe. Users can choose two custom higher timeframes and also enable swing highs/lows from the current chart’s timeframe.
There are three settings to customize for the current chart’s timeframe and higher timeframes:
Current TF - when toggled on, swing highs/lows will be plotted from the chart’s timeframe using the pivot length input
HTF 1 - when toggled on, swing highs/lows will be plotted from the user-inputted timeframe using the pivot length input
HTF 2 - when toggled on, swing highs/lows will be plotted from the user-inputted timeframe using the pivot length input
The Pivot Length controls how far back the indicator checks to confirm whether a candle’s high or low is a true swing point (also called a “pivot”). When detecting a swing high, the indicator checks if that candle’s high is higher than the highs of the previous X candles and the next X candles. For a swing low, it checks if the candle’s low is lower than the lows of the previous X candles and the next X candles. The number X comes from your Pivot Length setting.
A lower Pivot Length input (for example, 3 or 4) means the indicator only looks at a few candles on each side, so it will detect more swing points, including smaller, less significant ones. A higher Pivot Length input (for example, 20 or 25) makes the indicator look at more candles on each side, so it only marks major turning points that stand out clearly on the chart.
In short:
Low Pivot Length = more frequent, smaller levels (short-term focus)
High Pivot Length = fewer, stronger levels (major swing focus)
The Pivot Length input for each setting (Current TF, HTF 1, and HTF 2) are displayed below in the red boxes:
Each liquidity level is plotted with a text label, making it easy to identify where a level came from. You can turn off the ‘Show Levels’ setting if you don’t want to see the levels on your chart.
Please note: Liquidity Levels play a key role in finding liquidity sweeps, FVG Sweeps, and Buy/Sell signals. Keeping the levels turned off will not stop the indicator from using the levels that are enabled from being used for the other features mentioned.
3️⃣Liquidity Sweeps:
The indicator automatically detects bullish and bearish liquidity sweeps using the liquidity levels you have enabled.
🔹What is a Liquidity Sweep?
A liquidity sweep is a market phenomenon where significant players, such as institutional traders, deliberately drive prices through key levels to trigger clusters of pending buy or sell orders. It’s how the market gathers the liquidity needed for larger participants to enter positions.
Traders often place stop-loss orders around obvious highs and lows, such as the previous day’s, week’s, or month’s levels. When price pushes through one of these areas, it triggers the stops placed there and generates a burst of volume. This often creates a short-term fake-out before the market reverses in the opposite direction.
By detecting these sweeps in real time, traders can identify potential reversal areas or “trap” areas where liquidity has been taken.
🔹Bullish Liquidity Sweep
These occur when price dips below a Sellside Liquidity (SSL) level, taking out the stop-loss orders placed by long traders below that low. The indicator marks a zone around the candle that swept the SSL to highlight where liquidity was removed from the market.
When this happens, it shows that the market just cleared out sell-side liquidity, meaning traders who were long had their stops hit. This is often followed by a reversal or strong reaction upward, because the market no longer has pending liquidity to fill below that level.
🔹Bearish Liquidity Sweep
These occur when price dips above a Buyside Liquidity (BSL) level, taking out the stop-loss orders placed by short seller traders above that high. The indicator marks a zone around the candle that swept the BSL to highlight where liquidity was removed from the market.
When this happens, it shows that the market just cleared out buyside liquidity, meaning short traders had their stops hit. This is often followed by a reversal or strong reaction downward, because the market no longer has pending liquidity to fill above that level.
Under the ‘Liquidity Sweeps’ section in the settings, you can toggle on/off Bullish Regular Sweeps and Bearish Regular Sweeps. You can also customize the line style and color of liquidity levels that have been swept.
🔹How to Use Liquidity Sweeps
Liquidity sweeps are not direct trade signals. They are best used as context when forming a directional bias. A sweep shows that the market has removed liquidity from one side, which can hint at where the next move may develop.
For example:
When Buyside Liquidity (BSL) is swept, it often signals that buy stops have been triggered and the market may be preparing to move lower. Traders may then begin looking for short opportunities.
When Sellside Liquidity (SSL) is swept, it often signals that sell stops have been triggered and the market may be preparing to move higher. Traders may then begin looking for long opportunities.
It’s common practice to use liquidity sweeps as the first step in building a trade idea. Many traders will wait for additional confirmation, such as a fair value gap forming after the sweep, before opening a position.
Under the ‘Liquidity Sweeps’ section in the settings, you can toggle on/off:
Bullish Regular Sweeps - when disabled, Bullish Regular Sweeps won’t appear on your chart.
Bearish Regular Sweeps - when disabled, Bearish Regular Sweeps won’t appear on your chart.
4️⃣Fair Value Gap Sweeps:
The indicator automatically detects bullish and bearish Fair Value Gap sweeps (FVG Sweep) using the liquidity levels you have enabled.
🔹What is a FVG Sweep?
A FVG Sweep is a specific type of liquidity sweep that not only clears liquidity above or below a key level, but also forms a Fair Value Gap (FVG) immediately afterward.
The liquidity sweep shows where stop orders were triggered, areas where the market aggressively took out one side’s liquidity. The formation of a Fair Value Gap right after the sweep confirms that displacement followed. This means that the sweep was not just a stop hunt, but a deliberate move backed by momentum.
In simple terms, a regular liquidity sweep only tells you that liquidity was taken. A FVG Sweep tells you that liquidity was taken and a strong directional move started immediately after, leaving an imbalance in price. That imbalance represents where aggressive buyers or sellers entered the market without enough opposite-side orders to keep price balanced. This combination adds a confirmation and intent behind regular liquidity sweeps.
🔹Bullish FVG Sweep
The indicator automatically detects bullish FVG Sweeps when price takes out a Sellside Liquidity (SSL) level and then forms a bullish FVG within the next few candles. This sequence shows that sellers were stopped out and buyers immediately entered the market with momentum.
🔹Bearish FVG Sweep
The indicator automatically detects bearish FVG Sweeps when price takes out a Buyside Liquidity (BSL) level and then forms a bearish FVG shortly after. This shows that short sellers’ stops were triggered, and new selling pressure entered the market right away.
🔹How to Use FVG Sweeps
Unlike regular liquidity sweeps, FVG Sweeps can be used as trade entries because they confirm both liquidity being cleared and immediate momentum. A regular sweep only shows that stop-losses were triggered, but an FVG Sweep proves that price not only cleared liquidity but also moved away with momentum, leaving behind an imbalance (Fair Value Gap). This shift often marks the start of a new short-term trend.
We’ll cover this in more detail in the Buy and Sell Signal section below, but in short, a bullish FVG Sweep can act as confirmation for a potential long entry after price takes out a low, while a bearish FVG Sweep can confirm a short entry after price takes out a high.
The strongest FVG Sweeps come from extremely sharp reversals. On the chart, they look like a “V” shape for bullish setups or an inverted “V” shape for bearish setups. This shape shows how quickly momentum shifted after liquidity was cleared. When price instantly reverses and leaves a Fair Value Gap behind, it’s a clear sign that buyers or sellers stepped in aggressively and absorbed all available liquidity on the opposite side.
In practice, traders often use FVG Sweeps as a trigger to align their bias. For example, after a bullish FVG Sweep, the focus shifts toward looking for long setups within the new imbalance or during a small retracement into the Fair Value Gap. After a bearish FVG Sweep, traders focus on short setups as price retraces back into the gap before continuing lower. The key takeaway is that FVG Sweeps show conviction.
Under the ‘Liquidity Sweeps’ section in the settings, you can toggle on/off:
Bullish FVG Sweeps - when disabled, Bullish FVG Sweeps won’t appear on your chart.
Bearish FVG Sweeps - when disabled, Bearish FVG Sweeps won’t appear on your chart.
Please Note: the settings you choose to use for Fair Value Gaps, under the ‘Fair Value Gaps’ section, will be used for FVG Sweeps. This is important because if you increase the sensitivity value for FVGs, not all FVG Sweeps will appear if the FVG’s size doesn’t meet the sensitivity threshold.
5️⃣Buy & Sell Signals:
This indicator also plots Buy & Sell signals. These signals follow logic based on Atif Hussain’s FVG trading model. The entry requirements for a Long & Short signal are outlined below.
🔹Buy Signal:
In order for a Buy Signal to generate, the following conditions must occur in order:
Bullish FVG Sweep
Price Retraces to the Bullish FVG
🔹Sell Signal:
In order for a Buy Signal to generate, the following conditions must occur in order:
Bearish FVG Sweep
Price Retraces to the FVG
🔹Require Retracement:
Under the ‘Signals’ section in the settings, you can toggle on/off the ‘Require Retracement’ setting. When disabled, a long/short signal will appear immediately after a Bullish or Bearish FVG Sweep, instead of waiting for price to retrace back to the gap.
Please Note: the liquidity levels you enable under the ‘Liquidity Levels’ section will be the levels used for signals. Thus, if you only have the Previous Day Highs/Lows enabled, then only those levels will be used to generate buy/sell signals. Also, long Signals will only appear if Bullish FVG Sweeps are enabled, and Short Signals will only appear if Bearish FVG Sweeps are enabled.
When a Buy Signal or Sell Signal is plotted, three suggested take-profit levels and one suggested stop-loss level are plotted. There are two different Take-Profit methods you can choose from within the indicator settings: Manual or Auto.
🔹Manual Take-Profit:
If you’re using manual take-profit levels, you can customize the Risk-to-Reward (RR) for Take-Profit 1, 2, and 3 by adjusting the “RR 1”, “RR 2”, and “RR 3” settings. Setting RR 1 to 1 means take-profit 1 is a 1:1 risk-to-reward ratio. The stop-loss will always be placed at the recent low for Buy Signals, and at the recent high for Sell Signals.
🔹Auto Take-Profit:
If you select to use Auto Take-Profit instead of Manual, then Take-Profit 1, 2, and 3 will be automatically determined based on nearby liquidity levels. The stop-loss will be placed at the recent low for Buy Signals, and at the recent high for Sell Signals. Take-Profit Levels 1, 2, and 3 will be placed at the three closest opposite liquidity levels. If the take-profit 2 and take-profit 3 levels are too far away, only one take-profit level will be displayed.
🔹Signal Settings:
Long Signals:
When enabled, long signals are shown. When disabled, long signals will not appear.
Short Signals:
When enabled, short signals are shown. When disabled, short signals will not appear.
Require Retracement:
When enabled, price must retrace to a FVG after a FVG Sweep in order for a signal to be generated.
Take-Profit Levels:
When enabled, take-profit levels (TP 1, TP 2, and TP 3) are shown with long/short signals. When disabled, take-profit levels and their price labels are not displayed.
Take-Profit Labels:
When enabled, take-profit labels are displayed when price reaches one of the three take-profit levels. When disabled, labels won’t appear when price reaches take-profit levels.
Stop-Loss Levels:
When enabled, stop-loss levels are shown for long/short signals. When disabled, the stop-loss level and its price label are not displayed.
Stop-Loss Labels:
When enabled, stop-loss levels are shown for long/short signals. When disabled, a label won’t appear when price reaches the stop-loss level.
6️⃣Alerts:
The indicator supports alerts, so you never miss a key market move. You can choose to receive alerts for each of the following conditions:
Bearish Liquidity Sweep
Bullish Liquidity Sweep
Bearish FVG Sweep
Bullish FVG Sweep
Long Signal
Short Signal
TP 1
TP 2
TP 3
Stop-Loss
‼️Important Notes:
TradingView has limitations when running features on multiple timeframes, such as the liquidity levels, which can result in the following error:
🔹Computation Error:
The computation of using MTF features are very intensive on TradingView. This can sometimes cause calculation timeouts. When this occurs, simply force the recalculation by modifying one indicator’s settings or by removing the indicator and adding it to your chart again.
🚩 UNIQUENESS:
This indicator is unique because it identifies a specific type of liquidity event referred to as FVG Sweeps, where price takes liquidity and then immediately forms a Fair Value Gap in the opposite direction. These FVG Sweeps serve as the foundation of the model, and the script uses them as the required condition for generating Buy and Sell signals. Once an FVG Sweep is confirmed, the indicator automatically produces a fully defined trade idea with a stop-loss and up to three take-profit targets, following a consistent rule-based execution approach.

Pearson SL/TP📘 Description
Pearson SL/TP — Advanced Correlation-Based Strategy with Full Risk Management
The Pearson SL/TP indicator is an advanced market analysis tool that combines Pearson correlation, volatility-based stop/target levels, and dynamic signal strength evaluation.
It is designed for traders who want to visualize potential momentum shifts and risk/reward zones in a single, integrated chart.
🔍 Core Concept
This script measures the **Pearson correlation coefficient between recent price movements and time progression, highlighting potential trend exhaustion or momentum reversals when the correlation reaches extreme values.
* High positive correlation (near +1) → price moving steadily upward → possible overbought condition.
* High negative correlation (near -1) → price moving steadily downward → possible oversold condition.
When these extremes are reached, and confirmed by several internal filters, the script generates LONG or SHORT signals with fully calculated Stop Loss and Take Profit levels.
⚙️ Main Features
📈 Signal Generation
* Uses Pearson correlation as a primary indicator of trend intensity.
* Detects potential reversal zones when correlation crosses user-defined thresholds.
* Optional divergence confirmation enhances signal reliability.
💰 Risk Management
* Stop Loss (SL) and Take Profits (TP1 & TP2) automatically adapt to volatility using the ATR (Average True Range).
* Dynamic risk/reward ratios help assess trade quality.
* Adjustable multipliers let you fine-tune your risk parameters.
🧠 Signal Strength Analysis
Each signal is graded from Weak to Very Strong based on four factors:
1. Volume activity
2. Trend alignment
3. Pearson momentum
4. Correlation change intensity
🎨 Visualization
* Overbought / Oversold background zones
* Signal arrows (LONG / SHORT)
* SL / TP** price levels and labels
* Interactive dashboard** displaying:
* Current Pearson value
* Market state (Overbought / Oversold / Neutral)
* Signal strength
* Latest trade data (Entry, SL, TP1, TP2, Risk:Reward)
🔔 Alerts
Built-in alerts for:
* Confirmed LONG / SHORT signals
* Bullish / Bearish divergences
🧩 Customization
All major parameters — including **Pearson length, thresholds, ATR multipliers, and visual options — are fully customizable.
This allows you to adapt the indicator to any market, timeframe, or trading style.

Power Balance ForecasterHey trader buddy! Remember the old IBM 5150 on Wall Street back in the 80s? :) Well, I wanted to pay tribute to it with this retro-style code when MS DOS and CRT screens were the cutting edge of technology...
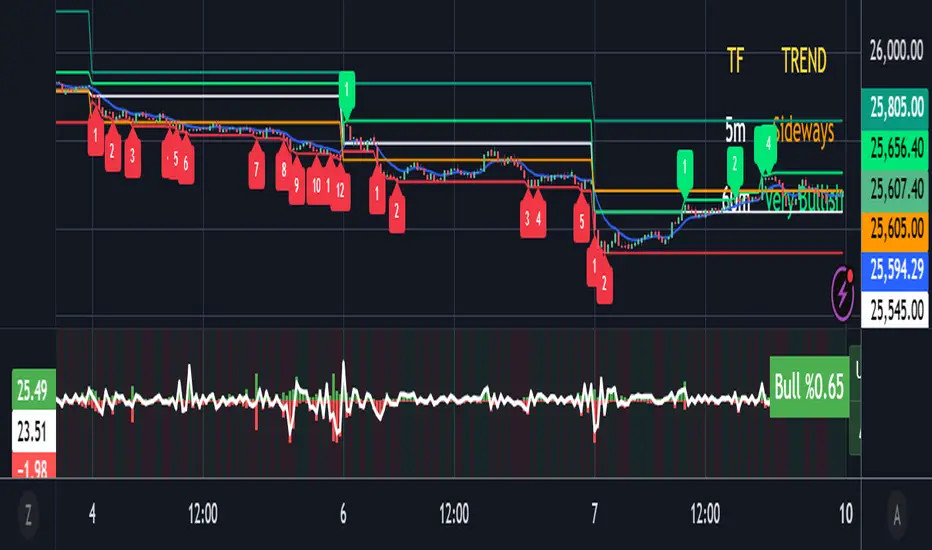
Analysis of the balance of power between buyers and sellers with price predictions
What This Indicator Does
The Power Balance Forecaster indicator analyzes the relationship between buyer and seller strength to predict future price movements. Here's what it does in detail:
Main Features:
Power Balance Analysis: Calculates real-time percentage of buyer power vs seller power
Price Predictions: Estimates next closing level based on current momentum
Market State Detection: Identifies 5 different market conditions
Visual Signals: Shows directional arrows and price targets
How the Trading Logic Works
Power Balance Calculation:
Analyzes Consecutive Bars - Counts consecutive bullish and bearish bars
Calculates Momentum - Uses ATR-normalized momentum to measure trend strength
Determines Market State - Assigns one of 5 market states based on conditions
Market States:
Bull Control: Strong uptrend (75% buyer power)
Bear Control: Strong downtrend (75% seller power)
Buying Pressure: Bullish pressure (65% buyer power)
Selling Pressure: Bearish pressure (65% seller power)
Balance Area: Market in equilibrium (50/50)
Prediction System:
Bullish Condition: Buyer power > 55% + Positive momentum = Bullish prediction
Bearish Condition: Seller power > 55% + Negative momentum = Bearish prediction
Price Target: Based on ATR multiplied by timeframe factor
Configurable Parameters:
Analysis Sensitivity (5-50): Controls how responsive the indicator is
Low values (5-15): More sensitive, ideal for scalping
High values (30-50): More stable, ideal for swing trading
Table Position: Choose from 9 positions to display the data table
Trading Signals:
Green Triangle ▲: Bullish signal, price expected to increase
Green Triangle ▼: Bearish signal, price expected to decrease
Dashed Line: Shows the price target projection
Label: Displays the exact target value
Recommended Timeframes:
Lower Timeframes (1-15 minutes):
Sensitivity: 10-20
Automatic Low TF mode
Higher Timeframes (1 hour - 1 day):
Sensitivity: 25-40
Automatic High TF mode
Important Notes:
Always use this indicator in combination with:
Market context analysis
Proper risk management
Confirmation from other indicators
Mandatory stop losses
The indicator works best in trending markets and may be less effective during extreme consolidation periods.

Trend (5m & 1h) by Ben2010🧭 What it does:
✅ Checks 5 min and 1 hour timeframes (you can change them).
✅ Evaluates:
RSI: momentum
MACD: direction
VWAP: price vs fair value
Volume: buyers vs sellers
Price structure: Higher High or Lower Low
✅ Combines all into a qualitative strength label (Very Bullish → Very Bearish).
✅ Displays everything in a neat table at the top-right corner.
ATH Retracement Levels### ATH Retracement Levels Indicator
**Overview**
The ATH Retracement Levels indicator is a powerful tool designed for technical analysts and traders seeking to identify key support zones during market pullbacks. By dynamically calculating the all-time high (ATH) of the instrument's price history, this indicator automatically plots horizontal retracement lines at -5%, -10%, -15%, and -20% below the ATH. These levels serve as potential support thresholds, helping traders anticipate price reactions and refine entry/exit strategies in trending or consolidating markets.
**Key Features**
- **Dynamic ATH Detection**: Continuously tracks and updates the highest high across the entire chart history for real-time relevance.
- **Customizable Retracement Lines**:
- **ATH Line** (Green, 2px): Marks the peak price for quick visual reference.
- **-5% Level** (Red, 1px): Shallow pullback zone for early support testing.
- **-10% Level** (Orange, 1px): Moderate retracement, often a psychological barrier.
- **-15% Level** (Yellow, 1px): Deeper correction, signaling potential trend weakness.
- **-20% Level** (Purple, 1px): Significant drawdown level, ideal for contrarian setups.
- **Informative Labels**: On the latest bar, each level displays its precise price value (formatted to two decimal places) with color-coordinated tags for effortless interpretation.
- **Pine Script v5 Optimized**: Built for efficiency with `max_lines_count=500` to handle extended timeframes without performance lag. Fully overlay-compatible for seamless integration with other indicators.
**How to Use**
Apply this indicator to any chart (stocks, forex, crypto, etc.) via TradingView's Pine Editor. It works best on daily or higher timeframes for long-term trend analysis but adapts to intraday views. Watch for price bounces or breakdowns at these levels to inform trades—e.g., buy on a -10% retest with bullish confirmation. For advanced users, the open-source code allows easy tweaks, such as adding more levels or alerts.
Elevate your charting workflow with ATH Retracement Levels—precision meets simplicity for smarter trading decisions. Share your feedback or custom variations in the comments!

Supply/Demand HTF (RBD/DBR) – FIX + DebugOverview:
This indicator automatically detects and plots institutional supply and demand zones on any timeframe.
It analyzes price action to identify Drop-Base-Rally (DBR) and Rally-Base-Drop (RBD) structures — the core formations of supply and demand trading.
How It Works
1. The script scans price candles to detect “base” formations — small consolidation candles between impulsive moves.
2. When it finds a valid base followed by a strong move, it marks that area as:
• 🟩 Demand Zone (DBR): price dropped → consolidated → rallied upward
• 🟥 Supply Zone (RBD): price rallied → consolidated → dropped downward
3. Each detected zone is extended to the right so you can see if price returns to it later.
Color
Meaning
Description:
🟩 Green Zone
Demand
Institutional buy area (potential bullish reversal)
🟥 Red Zone
Supply
Institutional sell area (potential bearish reversal)
🟦 Blue Box
(Debug) HTF candle box used for internal analysis — can be hidden
🟡 Yellow Fill
Zone has been touched by price (reactivated)
Usage
• Works best when detecting zones from H4 or H1 and trading confirmations on M5 or M15.
• Ideal for institutional-style or “Smart Money Concepts” traders.
• Zones are auto-updated as new structures appear.

Pivots 15m en 1mThis script is designed for scalpers and day traders who base their entries on low timeframes (like 1m) but reference liquidity levels from higher timeframes (HTF), in this case, 15m.Key Features:HTF Pivots on LTF: It calculates swing highs and swing lows (pivots) from the 15m chart and projects them as horizontal rays onto your 1m chart.Real-Time Mitigation: The rays (representing pending liquidity) are automatically deleted on the 1m candle as soon as the price mitigates (touches or breaks) that level. This allows you to clearly see which levels have already been tested and which have not.Configurable Pivot Strength: Includes an input to define the "Pivot Strength," allowing you to adjust how many candles on each side are needed to confirm a swing point (e.g., a value of 1 creates 3-bar pivots, a value of 2 creates 5-bar pivots, etc.).Info Table: Displays a real-time table with vital information from the current 1m candle:Time remaining until the candle closes.Total range of the candle in ticks.How to Use:This indicator must be loaded exclusively on a 1-minute (1m) chart.Adjust the "Pivot Strength" in the settings according to your strategy (a value of 1 or 2 is recommended).

MTF RSI+EMA Trend Dashboard🧭 MTF RSI + EMA Trend Dashboard
📌 Overview
The MTF RSI + EMA Trend Dashboard is a powerful multi-timeframe trend analyzer designed to help traders instantly identify bullish, bearish, and neutral trends across multiple timeframes — all in one compact dashboard.
It combines two of the most reliable momentum and trend indicators — RSI (Relative Strength Index) and EMA (Exponential Moving Average) — to provide a clear and color-coded view of market direction and strength.
⚙️ How It Works
For each selected timeframe (default: 4H, 1D, 1W, 1M, 3M), the indicator calculates:
RSI to measure momentum
EMA to track the prevailing trend
Price position vs. EMA to confirm trend bias
A timeframe is classified as:
🟢 Bullish → RSI > 60 and Price > EMA
🔴 Bearish → RSI < 40 and Price < EMA
🟡 Neutral → Otherwise
These conditions are displayed in a clean table format for quick visual analysis.
📊 Dashboard Details
Column 1: Timeframe
Column 2: RSI value (with dynamic color for overbought/oversold zones)
Column 3: Trend status (Bullish / Bearish / Neutral)
At the bottom-right corner, the indicator shows the Overall Trend Summary:
✅ “Overall: Bullish” → All timeframes are bullish
❌ “Overall: Bearish” → All timeframes are bearish
⚖️ “Overall: Mixed” → Mixed trends across timeframes
🔔 Built-in Alerts
You’ll receive alerts when:
All timeframes turn Bullish → Possible long opportunity
All timeframes turn Bearish → Possible short opportunity
(You can customize RSI thresholds and EMA period in the input settings.)
✨ Key Features
✅ Multi-timeframe RSI + EMA alignment
✅ Clear visual dashboard for quick decision-making
✅ Adjustable RSI and EMA parameters
✅ Fully customizable timeframes
✅ Auto color-coded RSI and trend cells
✅ Optional alerts for strong trend alignment
📈 Ideal For
Swing traders identifying momentum across higher timeframes
Day traders confirming trend bias
Position traders aligning entries with macro trends
⚠️ Disclaimer
This indicator is intended for educational and informational purposes only.
It does not constitute financial advice. Always use proper risk management and confirm signals with other analyses before making trading decisions.

KSK One Signal + Full TableThis indicator helps intraday traders identify high-probability entry points by combining four powerful concepts:
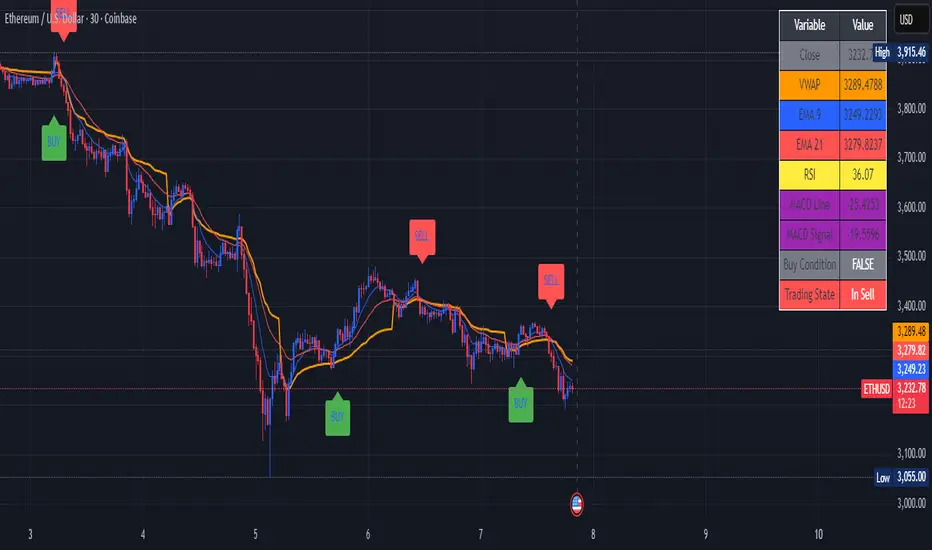
VWAP (Volume-Weighted Average Price) – Institutional benchmark
EMA Crossover (9 & 21) – Short-term trend direction
RSI (14-period) – Momentum & overbought/oversold filter
MACD (10,20,9) – Momentum confirmation
✅ No signal spam – Only one BUY appears until a SELL occurs (and vice versa).
✅ Real-time data table shows all values so you understand why a signal triggered.
✅ Works best on 5-minute or 15-minute charts for stocks, futures, or forex.
📈 Signal Rules
✅ BUY Signal Appears When ALL Are True:
Price is above VWAP (bullish bias)
EMA 9 > EMA 21 and price > EMA 9 (uptrend confirmed)
RSI between 55–80 (strong but not overextended)
MACD line > Signal line (positive momentum)
📉 SELL Signal Appears When ALL Are True:
Price is below VWAP (bearish bias)
EMA 9 < EMA 21 and price < EMA 9 (downtrend confirmed)
RSI between 20–55 (weak but not oversold)
MACD line < Signal line (negative momentum)
⚠️ Important: Once a BUY appears, no new BUY will show until a SELL happens first (and vice versa). This prevents overtrading.
🖥️ On-Chart Features
Orange line: VWAP (resets daily)
Blue line: EMA 9
Red line: EMA 21
Green "BUY" label below bar → Long entry
Red "SELL" label above bar → Short entry
Live table (top-right) shows:
Current time, price, VWAP, EMAs
RSI & MACD values
Whether BUY/SELL conditions are met
Current trading state ("In Buy", "In Sell", or "Neutral")
🛠️ How to Use
Apply to a 5m or 15m chart
Wait for a green BUY or red SELL label
Enter trade at the close of that candle (non-repainting)
Use your own stop-loss & take-profit (not included)
Ignore new signals of the same type until the opposite appears
💡 Why This Works
VWAP filters out noise — only trades in the day’s dominant sentiment.
EMA 9/21 acts as a dynamic trend filter (faster than 20 EMA).
RSI zone tweaks (55–80 / 20–55) avoid chasing extremes.
MACD adds momentum confirmation.
Single-signal logic forces discipline — no FOMO entries.
📝 Note
This is a manual trading tool — not a fully automated strategy.
VWAP resets at market open — do not use on daily/weekly charts.
👨💻 Customizable Inputs
You can adjust:
RSI length (default: 14)
Short EMA (default: 9)
Long EMA (default: 21)
MACD settings (hardcoded as 10,20,9 for responsiveness)
Order Block Smart Entry (v6)very useful indicator, analyze multiframes to identify the trend, then find out the valid order block and after analyzing lower time frame entry gives the singal.

Dios51 TrendMatrix🟢 Dios51 TrendMatrix – User Manual
Purpose:
Identify early trend breakouts with EMA High/Low channels, EMA200 trend filter, and RSI momentum confirmation.
📊 Components Overview
EMA High / EMA Low (Green & Red lines) – Define a dynamic price channel for breakout detection.
EMA200 (Yellow = Bullish, Red = Bearish) – Shows overall trend direction. Trade primarily in the EMA200 trend direction.
RSI + MA – Confirms momentum; crossover above MA signals bullish momentum, below MA signals bearish.
Background Fill – Green = bullish, Red = bearish. Visual aid for trend alignment.
Signal Arrows –
🔼 Green = Long breakout signal
🔽 Red = Short breakout signal
✅ Long Signal (Buy) Criteria
Candle closes above EMA High
RSI crosses above its MA
Candle is bullish (close > open)
Candle meets ATR filter (strong breakout)
EMA200 is Yellow (Bullish)
Cooldown period between signals is satisfied
❌ Short Signal (Sell) Criteria
Candle closes below EMA Low
RSI crosses below its MA
Candle is bearish (close < open)
Candle meets ATR filter (strong breakout)
EMA200 is Red (Bearish)
Cooldown period between signals is satisfied
🎯 Trade Management
Entry:
Next candle after the arrow appears
Confirm EMA200 trend aligns with the signal direction
Stop-loss:
For Long → below EMA Low
For Short → above EMA High
Exit:
Price re-enters EMA channel
Trend weakens (EMA200 changes color)
⚙️ Tips for Best Performance
Ideal on 15m–4h charts
Avoid sideways/consolidation markets
Trade only in direction of EMA200 color for higher probability
Combine with volume or higher timeframe EMA for additional confirmation
📌 Panel Legend (if using on-chart panel)
EMA200: Yellow = Bullish, Red = Bearish
Last Signal: Long / Short / None
RSI Status: Above MA = bullish, Below MA = bearish
QuantumFlow MTF System Extended
QuantumFlow MTF System Extended
Multi-Timeframe Directional Flow & Volatility Alignment Engine — Higher-Timeframe Edition
The QuantumFlow MTF System Extended is a higher-timeframe analytical framework that expands upon the original QuantumFlow concept.
While the base version focuses on short-term structures (1M – 15M), this edition is designed for traders who need to observe medium- to long-term directional harmony across the 30M, 45M, 1H, 2H, 3H and 4H timeframes.
Its purpose is to provide a structured, non-repainting overview of how momentum and volatility align over broader market horizons — helping traders understand the prevailing directional flow rather than predicting future prices.
Concept
The system aggregates confirmed Supertrend directions from each higher timeframe, converting them into normalized bullish or bearish values.
These values are then processed through dual-layer EMA momentum filters that validate the directional strength of each component.
The resulting matrix displays a precise snapshot of how higher-timeframe market structures are synchronized — serving as a compass of directional alignment rather than a buy/sell signal generator.
A multi-ATR framework defines adaptive volatility zones, allowing each instrument to react proportionally to its intrinsic volatility profile.
This approach smooths sensitivity shifts that often occur between intraday and multi-hour structures, delivering consistent analytical behavior across asset classes.
How It Works
Confirmed Multi-Timeframe Supertrend
Each timeframe produces a close-confirmed Supertrend direction, ensuring signal stability and preventing repainting.
Adaptive Multi-ATR Model
Multiple ATR instances with distinct deviation factors define dynamic volatility thresholds that self-adjust to market conditions.
Dual EMA Momentum Validation
Two independent EMA layers filter and confirm each Supertrend direction, improving directional clarity and reliability.
Flow Totals Engine
The indicator sums all timeframe states into real-time bullish/bearish totals and percentage ratios, clearly visualized within a single panel.
Configurable Alerts (Optional)
Users may set threshold-based alerts when directional alignment reaches specified intensity levels (for example, when all timeframes are synchronized).
Full Customization
All visual elements — colors, text, background, and layout — can be adjusted to match personal preferences or chart themes.
Intended Use and Benefits
Observe how higher-timeframe trends align to reveal medium-term directional bias.
Quantify the balance of bullish vs bearish momentum across multiple timeframes.
Combine with lower-timeframe analysis (e.g. the original QuantumFlow System) to establish multi-layer confirmation between short- and mid-term flows.
Maintain awareness of trend synchronization or divergence without relying on subjective chart interpretation.
This indicator does not provide trading signals, forecasts, or financial advice.
It is an analytical tool intended to assist users in studying market structure and volatility behavior.
Chart Display
QuantumFlow Extended presents a unified dashboard that lists each analyzed timeframe, its active directional state, and the overall flow balance in numeric and percentage form.
It functions seamlessly on all instruments and can be used standalone or alongside the original short-term version.
Access
This is an invite-only indicator.
To request access or additional information, please contact the author privately via the TradingView profile.

Price Action Bar Counter for Crypto Traders标注美股开收盘时间的K线辅助指标,自动调整夏令时与冬令时,适用于5m、15m、30m与1h级别。
Highlights U.S. stock market open and close times with automatic DST adjustment.
Best used on 5m, 15m, 30m, and 1h charts.

Quantura - Quantified Price Action StrategyIntroduction
“Quantura – Quantified Price Action Strategy” is an invite-only Pine Script strategy designed to combine multiple price action concepts into a single trading framework. It integrates supply and demand zones, liquidity sweeps and runs, fair value gaps (FVGs), RSI filters, and EMA trend confirmation. The strategy also provides a visual overlay with dynamic trend-colored candles for easier chart interpretation. It is intended for multi-market use across cryptocurrencies, Forex, equities, and indices.
Originality & Value
The strategy is original in how it unifies several institutional-style price action elements and validates trades only when they align. This reduces noise compared to using single indicators in isolation. Its unique value lies in the combination of:
Supply & Demand detection: Dynamic boxes identified through pivots, ATR, and volume sensitivity.
Liquidity sweeps and runs: Detects when swing highs/lows are broken and retested, distinguishing between liquidity grabs (sweeps) and directional runs.
RSI filter: Can be set to normal or aggressive, confirming momentum before trades.
Fair Value Gaps (FVGs): Optional detection and filtering of price inefficiencies.
EMA filter: Aligns trades with the broader market trend.
Trend candle visualization: Candles dynamically colored bullish, bearish, or neutral, based on strategy positions.
This layered confluence approach ensures that entries are not taken on a single condition but require agreement across several dimensions of market structure, momentum, and order flow.
Functionality & Indicators
Supply & Demand Zones: Zones are created when pivots, ATR sensitivity, and volume thresholds overlap.
Liquidity: Swing highs and lows are tracked, with options for sweep (fakeout/reversal) or run (continuation) detection.
RSI: Confirms long signals when oversold and shorts when overbought, with configurable aggressiveness.
FVG filter: Adds validation by requiring price interaction with inefficiency zones.
EMA filter: Ensures longs are above EMA and shorts below EMA.
Signals & Visualization: Trade entries are marked on the chart, while candles change color to reflect trade direction and status.
Parameters & Customization
Supply & Demand: Sensitivity (swing range, volume multiplier, ATR multiplier) and display options.
Liquidity filter: Mode (Run or Sweep), display, and swing length.
RSI: Enable/disable, length, and style (normal or aggressive).
Fair Value Gaps: Sensitivity via ATR factor, optional volume filter, and display toggles.
EMA: Length, enable/disable, and visualization.
Risk management: Up to three configurable take-profit levels, stop-loss, break-even logic, and capital-based position sizing.
Visualization: Custom candle coloring and optional overlay for better clarity.
Default Properties (Strategy Settings)
Initial Capital: 10,000 USD
Position Size: 100% of equity per trade (backtest default)
Commission: 0.1%
Slippage: 1
Pyramiding: 0 (only one position at a time)
Note: The default of 100% equity per trade is used for testing purposes only and would not be sustainable in real trading. A typical allocation in practice would be between 1–5% of account equity per trade, sometimes up to 10%.
Backtesting & Performance
Backtests on XPTUSD over 2.5 years with the default settings produced:
164 trades
67.68% win rate
Profit factor: 1.7
Maximum drawdown: 27.81%
These results show how the confluence of supply/demand, liquidity, and RSI filters can produce robust setups. However, past performance does not guarantee future results. While the trade count (164) is sufficient for statistical analysis, results may vary across markets and timeframes.
Risk Management
Three configurable take-profit levels with percentage allocation.
Initial stop-loss based on user-defined percentage.
Dynamic stop-loss that adjusts with market movement.
Break-even logic that shifts stops to entry after predefined gains.
Position sizing based on risk percentage of equity.
This framework allows both conservative and aggressive configurations, depending on user preference.
Limitations & Market Conditions
Works best in volatile and liquid markets such as crypto, metals, indices, and FX.
May produce false signals in low-volume or sideways environments.
Unexpected news or macro events can override technical conditions.
Default position sizing of 100% equity is highly aggressive and should be reduced before any practical use.
Usage Guide
Add “Quantura – Quantified Price Action Strategy” to your chart.
Select Supply & Demand, Liquidity, RSI, EMA, and FVG settings according to your market and timeframe.
Configure risk management: take-profits, stop-loss, and risk-per-trade percentage.
Use the Strategy Tester to analyze statistics, equity curve, and performance under different conditions.
Optimize parameters before applying the strategy to different markets.
Author & Access
Developed 100% by Quantura. Published as an Invite-Only script.
Important
This description complies with TradingView’s publishing rules. It clarifies originality, explains the underlying logic, discloses default properties, and presents backtest results with realistic disclaimers.

Cloud and Table - Ostinato TradingMain indicator of Ostinato Trading, the moving averages cloud and table. You can superpose various moving averages, bollinger bands and their color fill. Additionaly the table is used to plot the distance from the price to moving averages, the ATR value, the stop loss ... You can also plot a bulls eyes of SL and TP in points to visualise it on the chart.

RTH Previous Day's Range + SMTs [bilal x shpat]Overview
This advanced indicator is designed specifically for futures and equity traders who focus on Regular Trading Hours (RTH) sessions. It automatically plots the previous RTH session's high and low levels and detects Smart Money Theory (SMT) divergences across multiple correlated or inversely correlated instruments.
Key Features
📊 RTH Range Detection
Automatically identifies and tracks Regular Trading Hours (9:30 AM - 4:14 PM New York time)
Plots horizontal lines at the previous RTH session's high and low
Works seamlessly on all timeframes, including ETH (Extended Trading Hours) charts
Lines dynamically extend and update as new bars form
🔄 Smart Money Theory (SMT) Divergence Detection
Compares up to 3 correlated or inversely correlated assets simultaneously
Detects bullish and bearish SMT divergences automatically
Visual divergence lines connect previous session levels to current intraday highs/lows
Customizable SMT labels showing which instruments are diverging
Option to mark assets as "Correlated" or "Inversely Correlated" for accurate divergence detection
SMT detection occurs only during RTH sessions for cleaner signals
🎨 Fully Customizable Styling
3 Label Styles: Choose between "Full" (RTH Previous Day High), "Short" (RTH PDH), or "Lowercase" (rth previous day high)
Adjustable Label Sizes: Tiny, Small, Normal, or Large
Custom Colors: Separate color controls for lines, labels, bullish SMT, and bearish SMT
Line Extension: Control how many bars ahead lines extend
Line Width: Customize line thickness
📈 SMT Visual Indicators
Arrow Symbols: ▲ = Higher / ▼ = Lower (for correlated assets)
Alternate Symbols: 🔺 = Higher / 🔻 = Lower (for inversely correlated assets)
Color-coded divergence lines (white by default, fully customizable)
Optional SMT labels showing ticker symbols with directional indicators
Optional comparison table displaying current divergence status
⚙️ Comparison Settings
Add up to 2 comparison symbols (e.g., ES1!, YM1!, NQ1!)
Toggle each comparison asset on/off independently
Set correlation type (Correlated or Inversely Correlated) for each asset
Popular comparisons: ES vs NQ, YM vs ES, Equity vs Futures
🧹 Clean Chart Management
Option to delete previous RTH SMTs when new session starts
Automatic cleanup of outdated lines and labels
Transparent label backgrounds for minimal chart clutter
Lines track exact bar where high/low occurred
How It Works
Session Detection: The indicator identifies when RTH begins (9:30 AM ET) and tracks all price action during the session until close (4:14 PM ET)
Level Capture: At the start of each new RTH session, it captures the previous session's high and low and plots them as reference levels
SMT Analysis: During the current RTH session, it continuously compares the current session's high/low with the previous session's high/low across all selected instruments
Divergence Identification: When one instrument makes a higher high while another makes a lower high (or vice versa), an SMT divergence is detected and visualized
Use Cases
Liquidity Analysis: Identify when markets are taking liquidity at different rates
Reversal Signals: SMT divergences often precede significant reversals
Correlation Trading: Monitor when traditionally correlated markets begin to diverge
Key Level Trading: Use previous RTH high/low as support/resistance levels
Multi-Market Analysis: Compare ES, NQ, and YM simultaneously for institutional flow
Best Practices
Most effective on intraday timeframes (1m - 15m charts)
Works on both RTH and ETH chart sessions - meant to be used on a RTH chart
Compare highly correlated instruments (e.g., ES1! vs NQ1!)
Use in combination with volume analysis and market structure
SMT divergences are most powerful near key levels
Settings Overview
Comparison Symbols
Asset 2 & 3: Select tickers to compare (e.g., ES1!, YM1!)
Correlation toggles for each asset
Enable/disable each comparison independently
Styling
Line color, width, and extension length
Label color, size, and style (3 options)
Separate colors for bullish and bearish SMT lines
SMT Controls
Toggle SMT detection on/off
Show/hide SMT text labels
Optional SMT comparison table
Delete previous session SMTs option
Note: This indicator is best used by traders familiar with Smart Money Concepts (SMC) and inter-market analysis. Understanding market correlations is essential for accurate interpretation of SMT divergences.
thank you shpat for the SMT option in the last indicator, i tweaked it for this one

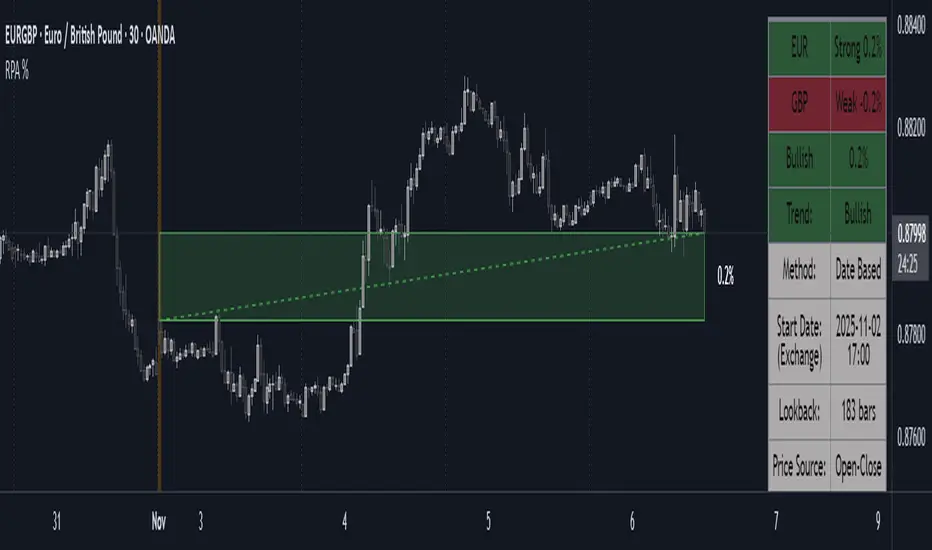
Period Range AnalyzerThis indicator analyzes a specific periodic range, which can start from a fixed date or a defined lookback period. It draws percentage levels and colored zones between the highest and lowest price. It also displays a detailed information table, which shows the price's position within the range in "Trend" mode, and the relative strength of currency pairs in "Forex" mode. The current price position is also indicated by a label with a percentage value and the name of the corresponding zone.
User Guide
Calculation Method
This setting determines how the indicator defines the range used for the calculation.
Lookback Period: In this mode, the indicator uses the last N candles (the number can be specified in the "Lookback Period (bars)" field). The range (the highest and lowest price) is "floating," meaning it is recalculated with each new candle based on the last N candles.
Date Based: In this mode, the calculation starts from a fixed date and time you select. The indicator finds the opening price of the start date and continuously tracks the highest and lowest price from that point on. This mode is ideal for measuring performance from a specific event (e.g., start of a week/month/year, news).
Data Handling Note: If you select a date in "Date Based" mode for which no data is available on the current timeframe (e.g., switching to a very low timeframe), the indicator will automatically use the earliest available candle as the starting point. All calculations (Open, Max, Min, Range, Percentage, Change, Trend) are based on this actual start date.
Start Date & Time
This setting is only active in "Date Based" mode.
Here you can specify the fixed starting point for the calculation.
The specified time is in the Exchange timezone.
Important limitation: Due to TradingView platform limits, visual elements (levels, zones) are only drawn for a maximum of 250 candles back. If the set date is older than this, the calculation still applies to the entire period (from the set date), but the drawing only covers the last 250 candles. The table always displays accurate data for the entire period.
When switching to a higher timeframe, the range may restart from a slightly later bar due to TradingView's bar alignment. For best accuracy, set your timeframe first, then select the start date.
Table Mode
This setting controls what data the information table displays.
Trend: This is the default mode, which works on any symbol (stock, index, crypto, etc.). It displays information related to the trend and the range.
Forex: This is a special mode used to measure the strength of currency and crypto pairs. It only works on symbols with exactly 6 characters (e.g., "EURUSD", "BTCUSD"). It treats the first 3 characters as the base currency (e.g., EUR) and the last 3 as the quote currency (e.g., USD). If the symbol does not have 6 characters, the table will automatically display in "Trend" mode.
Trend
This trend determination operates based on the formation order of the high and low within the analyzed range:
Its switch is located in the “Table Additional Rows” menu.
Bullish: Indicated if the low was formed before the high (on different candles). Or if they formed on the same candle, it was a bullish candle.
Bearish: Indicated if the high was formed before the low (on different candles). Or if they formed on the same candle, it was a bearish candle.
Neutral: Indicated if the high and low formed on the same candle, and it was a "doji" candle (close = open).
Upper & Lower Threshold
These settings (Upper Threshold (%) and Lower Threshold (%) in the "Label Coloring" section) primarily determine the state (Bullish/Bearish/Neutral) of the top row of the table.
The logic is not based on the percentage change of the price movement, but on the current price's position within the range, where the bottom of the range is 0% and the top is 100%.
Upper Threshold (%): The percentage level (e.g., 60.0) above which the indicator considers the price position "Bullish" (or "Strong").
Lower Threshold (%): The percentage level (e.g., 40.0) below which the indicator considers the price position "Bearish" (or "Weak").
If the price is between the two (e.g., between 40% and 60%), the signal is Neutral.
Secondary function: These thresholds also control the color of the label next to the price, provided the "Dynamic Label Coloring" option is enabled.

Quantura - Quantitative AlgorythmIntroduction
“Quantura – Quantitative Algorithm” is an invite-only Pine Script strategy designed for multi-timeframe analysis, combining technical filters with user-adjustable fundamental sentiment. It was primarily developed for cryptocurrency markets but can also be applied across other assets such as Forex, stocks, and indices. The goal is to generate structured trade signals through a confluence of techniques rather than relying on a single indicator.
Originality & Value
Quantura is not a simple mashup of indicators. Its originality comes from how multiple layers of analysis are integrated into a single decision framework . Instead of showing indicators separately, the strategy only issues trades when several conditions align simultaneously:
RSI entry triggers confirm overbought/oversold reversals.
Market structure on a higher timeframe confirms trend direction.
Order block detection highlights zones of concentrated supply and demand.
Premium/Discount zones identify potential over- and undervaluation.
HTF EMA provides trend confirmation.
Optional candlestick patterns strengthen reversal or continuation signals.
An optional correlation filter compares the main asset to a reference instrument.
This design forces agreement between different methodologies (momentum, structure, value, volume, sentiment), which reduces noise compared to using them in isolation.
Functionality & Indicators
Entry trigger: RSI exits from extreme zones.
Filters: Only valid when all selected filters (HTF structure, EMA, order blocks, premium/discount, candlesticks, correlation, volume) confirm the direction.
Fundamental bias: User-defined sentiment and analysis settings (bullish, bearish, neutral) influence whether long or short trades are permitted.
Exits: ATR-based take profit and stop loss, with optional breakeven, opposite-signal exit, and session-end exit.
Visualization: Buy/Sell markers, trend-colored candles, and an optional dashboard summarizing indicator status.
Parameters & Customization
Timeframes: Independent HTF and LTF selection.
Trading direction: Long / Short / Both.
Session and weekday filters.
RSI length and thresholds.
Filters: HTF structure, order blocks, premium/discount, EMA, candlestick, ATR volatility, volume zones, correlation.
Exit rules: ATR multipliers for TP/SL, breakeven logic, session-end exit, opposite-signal exit.
Visuals: Toggle signals, candles, dashboard, custom colors.
Default Properties (Strategy Settings)
Initial Capital: 100,000 USD
Position Size: 15% of equity per trade
Commission: 0.25%
Slippage: enabled
Pyramiding: 0 (one position at a time)
Note: The position sizing of 15% equity per trade is intentionally set for backtesting demonstration. In real trading, risking this much is considered aggressive. Most traders prefer to risk 1-5% of equity, and rarely above 10%.
Backtesting & Performance
Backtests on BTCUSD (2 years) with the above defaults showed:
112 trades
Win rate: 40%
Profit factor: 1.4
Maximum drawdown: 34%
These results illustrate how the confluence model behaves, but they are not predictive of future performance . The trade sample size (72 trades) is below the 100+ usually recommended for statistical robustness. Users should re-test with their own preferred symbols, settings, and timeframes.
Risk Management
ATR-based stops and targets scale with volatility.
Commission and slippage are included by default for realistic modeling.
Opposite-signal exit helps capture trend reversals.
Session-end exit can close intraday positions before illiquid hours.
Breakeven option protects profits when available.
Although the default allocation uses 15% per trade for demonstration, this is not a recommendation. Users are encouraged to adjust risk sizing downwards to sustainable levels (commonly 1-5%).
Limitations & Market Conditions
Performs best in volatile, liquid markets (e.g., crypto).
May struggle in prolonged sideways markets with low volatility.
News events and fundamentals outside user inputs can override signals.
Backtests below 100 trades should be considered exploratory, not statistically conclusive.
Usage Guide
Add “Quantura – Quantitative Algorithm” to your chart in strategy mode.
Select HTF and LTF timeframes, trading direction, and session filters.
Configure confluence filters (structure, EMA, order blocks, premium/discount, candlestick, correlation, volume).
Set sentiment and analysis bias in fundamental settings.
Adjust ATR multipliers and exits.
Review buy/sell signals and analyze performance in the Strategy Tester.
Author & Access
Developed 100% by Quantura . Distributed as an Invite-Only script . Details are provided in the Author’s Instructions field.
Important: This description complies with TradingView’s Script Publishing Rules and House Rules. It does not guarantee profitability, avoids unrealistic claims, and explains how the strategy integrates multiple methods into a coherent decision framework.


HVIB UltimateThis script shows specific VIBs (volume imbalances) Customizable
HVIB - shows all HVIBS for short/ long, timeframe customization (current, 10, 15), colour customization, Fill close customisation (body/wick, number of closes needed to stop showing it as a valid)
2: FVIB indicator - shows two types of Failed vibs
FHVIBs (basicaly HVIBS but only those failed ones)
FVIB - Vib between two same candles closed by the third opposite candle (failed vib)
I like to have those two indicators three times copied for each timeframes /HVIBS 3 times and Fhvibs three times. to turn in quickly on and off and look which timeframes are aligned (which is even stronger I believe)

TPAmacd — Free by TPA OG💎 TPAmacd — Free by TPA OG
Professional Divergence Detection for Confident Technical Analysis
🧭 Overview
TPAmacd is an advanced divergence-analysis tool built for traders who value precision, adaptability, and clarity.
It automatically identifies bullish and bearish divergences on the MACD histogram, confirms momentum shifts, and provides a clean, customizable visual framework — helping you interpret market transitions with greater confidence.
⚙️ Key Features
- Auto-detected Bullish / Bearish Divergences — instantly highlights potential momentum shifts.
- Multi-Timeframe Compatibility — analyze divergences seamlessly across any chart period.
- Histogram Reversal Alerts — get notified as momentum changes direction.
- Customizable Settings — choose between EMA / SMA, set color themes, and adjust visual precision.
- Efficient, Lightweight Design — optimized for clarity and performance on all devices.
📈 Why Traders Choose TPAmacd
- Professional-grade divergence mapping
- Intuitive design — minimal clutter, maximum context
- Adaptable for scalping, swing, or long-term analysis
- Clear alerts and smooth integration with your workflow
⚠️ Important Disclaimer
This script is provided for educational and informational purposes only.
It does not constitute financial, investment, or trading advice.
No indicator, including TPAmacd or any related tools by TPA OG, can guarantee accuracy or profitability.
All trading involves risk, and past performance is not indicative of future results.
Always perform independent analysis and use appropriate risk-management practices before placing any trade.

Range Percentage Analyzer This indicator is a tool for analyzing the market range and trend. It calculates the extent of price movement between a specified starting point and the current price, displaying it as a percentage.
The calculation can be based on a fixed lookback period (e.g., the last 30 candles) or from a fixed start date. It also provides a clear table that shows the general trend in "Trend" mode, and the relative strength of the base and quote currencies of forex pairs (e.g., EURUSD) in "Forex" mode.
User Guide
Calculation Method
This setting determines how the indicator defines the starting point for the calculation.
Lookback Period: In this mode, the indicator uses the last N candles (the number can be specified in the "Lookback Period (bars)" field, maximum 250).
The starting point is "floating," meaning it shifts with each new candle. For example, with a setting of 30, the 30th candle from the current one will always be the starting point.
Date Based: In this mode, the calculation starts from a fixed date and time you select.
This mode is ideal for measuring performance from a specific event (e.g., news, start of a week/month).
Note: If you select a date in "Date Based" mode for which no data is available on the current timeframe (e.g., switching to a very low timeframe), the indicator will automatically use the earliest available candle as the starting point.
Start Date & Time
This setting is only active in "Date Based" mode.
Here you can specify the fixed starting point for the calculation.
The specified time is in the Exchange timezone.
Important limitation: Due to TradingView platform limits, visual elements (box, line) are only drawn for a maximum of 250 candles back.
If the set date is older than this, the calculation still applies to the entire period (from the set date), but the drawing only covers the last 250 candles.
When switching to a higher timeframe, the range may restart from a slightly later bar due to TradingView's bar alignment. For best accuracy, set your timeframe first, then select the start date.
Table Mode
This setting controls what data the information table displays.
Trend: This is the default mode, which works on any symbol (stock, index, crypto, etc.). It displays information related to the trend.
Forex: This is a special mode used to measure the strength of currency pairs.
It only works on symbols with exactly 6 characters (e.g., "EURUSD", "BTCUSD"). It treats the first 3 characters as the base currency (e.g., EUR) and the last 3 as the quote currency (e.g., USD).
If the symbol does not have 6 characters, the table will automatically display in "Trend" mode.
Extremes Trend Row
If this is enabled, the table displays an additional row that determines the trend based on the formation order of the high and low within the analyzed range.
The logic is as follows:
Bullish: Indicated if the low was formed before the high.
(Or if they formed on the same candle, which was a bullish candle).
Bearish: Indicated if the high was formed before the low.
(Or if they formed on the same candle, which was a bearish candle).
Neutral: Indicated if the high and low formed on the same candle, and it was a "doji" candle (close = open).
Upper & Lower Threshold
These settings control the logic for the "Change Trend" and "Forex Display" rows at the top of the table.
They determine when the total percentage change for the entire period is considered "Bullish/Strong", "Bearish/Weak", or "Neutral".
Upper Threshold (%): The percentage value (default 0.1%) above which the indicator considers the change "Bullish/Strong".
Lower Threshold (%): The percentage value (default -0.1%) below which the indicator considers the change "Bearish/Weak".
If the change is between the two, the signal is Neutral.