TREND (Type II) | Hamster-CoderTREND (Type II) — Smart Trend Reversal Indicator Based on RCI & MACD
TREND (Type II) is a powerful tool for traders who want to spot not just where the market is now, but where it might be heading next.
It combines the analytical strength of RSI and MACD to identify potential trend reversal points before they become obvious on the chart.
🚀 Key Advantages
Early trend detection. TREND can anticipate possible reversals even before the actual crossover occurs.
Flexible visualization. Displayed in a separate panel while showing buy/sell signals directly on the main chart.
Multi-timeframe support. Analyze signals from higher or lower timeframes without switching charts.
Intuitive color background. The background automatically turns red during bearish conditions for instant market sentiment recognition.
🎯 Signal Types
Primary Signal. When RCI and MACD lines actually cross, confirming a trend shift.
Preliminary Signal. When a crossover is projected to occur on the next bar.
Overheat Signal. When the market reaches a defined threshold (e.g. ±90) and starts showing signs of cooling down.
🧠 Unique Features
Extra Filters (experimental). Filters out weak or false signals, showing only those confirmed by additional criteria.
RCI–MACD Difference Mode. Visualize the distance between RCI and MACD as a histogram to assess divergence strength.
Custom Thresholds. Define your own overbought/oversold zones to fine-tune signal sensitivity.
🔍 Who It’s For
TREND (Type II) is ideal for traders who:
seek dynamic entry and exit points without lagging indicators;
want visual and statistical confirmation of trend changes;
build multi-layered strategies requiring signal validation.
💬 Use TREND (Type II) to see the market one step ahead.
This isn’t just another indicator — it’s an early warning system for potential trend reversals .
相對強弱指標(RSI)

Momentum-Based Fair Value Gaps [BackQuant]Momentum-Based Fair Value Gaps
A precision tool that detects Fair Value Gaps and color-codes each zone by momentum, so you can quickly tell which imbalances matter, which are likely to fill, and which may power continuation.
What is a Fair Value Gap
A Fair Value Gap is a 3-candle price imbalance that forms when the middle candle expands fast enough that it leaves a void between candle 1 and candle 3.
Bullish FVG : low > high . This marks a bullish imbalance left beneath price.
Bearish FVG : high < low . This marks a bearish imbalance left above price.
These zones often act as magnets for mean reversion or as fuel for trend continuation when price respects the gap boundary and runs.
Why add momentum
Not all gaps are equal. This script measures momentum with RSI on your chosen source and paints each FVG with a momentum heatmap. Strong-momentum gaps are more likely to hold or propel continuation. Weak-momentum gaps are more likely to fill.
Core Features
Auto FVG Detection with size filters in percent of price.
Momentum Heatmap per gap using RSI with smoothing. Multiple palettes: Gradient, Discrete, Simple, and scientific schemes like Viridis, Plasma, Inferno, Magma, Cividis, Turbo, Jet, plus Red-Green and Blue-White-Red.
Bull and Bear Modes with independent toggles.
Extend Until Filled : keep drawing live to the right until price fully fills the gap.
Auto Remove Filled for a clean chart.
Optional Labels showing the smoothed RSI value stored at the gap’s birth.
RSI-based Filters : only accept bullish gaps when RSI is oversold and bearish gaps when RSI is overbought.
Performance Controls : cap how many FVGs to keep on chart.
Alerts : new bullish or bearish FVG, filled FVG, and extreme RSI FVGs.
How it works
Source for Momentum : choose Returns, Close, or Volume.
Returns computes percent change over a short lookback to focus on impulse quality.
RSI and Smoothing : RSI length and a small SMA smooth the signal to stabilize the color coding.
Gap Scan : each bar checks for a 3-candle bullish or bearish imbalance that also clears your minimum size filter in percent of price.
Heatmap Color : the gap is painted at creation with a color from your palette based on the smoothed RSI value, preserving the momentum signature that formed it.
Lifecycle : if Extend Unfilled is on, the zone projects forward until price fully trades through the far edge. If Auto Remove is on, a filled gap is deleted immediately.
How to use it
Scan for structure : turn on both bullish and bearish FVGs. Start with a moderate Min FVG Size percent to reduce noise. You will see stacked clusters in trends and scattered singletons in chop.
Read the colors : brighter or stronger palette values imply stronger momentum at gap formation. Weakly colored gaps are lower conviction.
Decide bias : bullish FVGs below price suggest demand footprints. Bearish FVGs above price suggest supply footprints. Use the heatmap and RSI value to rank importance.
Choose your playbook :
Mean reversion : target partial or full fills of opposing FVGs that were created on weak momentum or that sit against higher timeframe context.
Trend continuation : look for price to respect the near edge of a strong-momentum FVG, then break away in the direction of the original impulse.
Manage risk : in continuation ideas, invalidation often sits beyond the opposite edge of the active FVG. In reversion ideas, invalidation sits beyond the gap that should attract price.
Two trade playbooks
Continuation - Buy the hold of a bullish FVG
Context uptrend.
A bullish FVG prints with strong RSI color.
Price revisits the top of the gap, holds, and rotates up. Enter on hold or first higher low inside or just above the gap.
Invalidation: below the gap bottom. Targets: prior swing, measured move, or next LV area.
Reversion - Fade a weak bearish FVG toward fill
Context range or fading trend.
A bearish FVG prints with weak RSI color near a completed move.
Price fails to accelerate lower and rotates back into the gap.
Enter toward mid-gap with confirmation.
Invalidation: above gap top. Target: opposite edge for a full fill, or the gap midline for partials.
Key settings
Max FVG Display : memory cap to keep charts fast. Try 30 to 60 on intraday.
Min FVG Size % : sets a quality floor. Start near 0.20 to 0.50 on liquid markets.
RSI Length and Smooth : 14 and 3 are balanced. Increase length for higher timeframe stability.
RSI Source :
Returns : most sensitive to true momentum bursts
Close : traditional.
Volume : uses raw volume impulses to judge footprint strength.
Filter by RSI Extremes : tighten rules so only the most stretched gaps print as signals.
Heatmap Style and Palette : pick a palette with good contrast for your background. Gradient for continuous feel, Discrete for quick zoning, Simple for binary, Palette for scientific schemes.
Extend Unfilled - Auto Remove : choose live projection and cleanup behavior to match your workflow.
Reading the chart
Bullish zones sit beneath price. Respect and hold of the upper boundary suggests demand. Strong green or warm palette tones indicate impulse quality.
Bearish zones sit above price. Respect and hold of the lower boundary suggests supply. Strong red or cool palette tones indicate impulse quality.
Stacking : multiple same-direction gaps stacked in a trend create ladders. Ladders often act as stepping stones for continuation.
Overlapping : opposing gaps overlapping in a small region usually mark a battle zone. Expect chop until one side is absorbed.
Workflow tips
Map higher timeframe trend first. Use lower timeframe FVGs for entries aligned with the higher timeframe bias.
Increase Min FVG Size percent and RSI length for noisy symbols.
Use labels when learning to correlate the RSI numbers with your palette colors.
Combine with VWAP or moving averages for confluence at FVG edges.
If you see repeated fills and refills of the same zone, treat that area as fair value and avoid chasing.
Alerts included
New Bullish FVG
New Bearish FVG
Bullish FVG Filled
Bearish FVG Filled
Extreme Oversold FVG - bullish
Extreme Overbought FVG - bearish
Practical defaults
RSI Length 14, Smooth 3, Source Returns.
Min FVG Size 0.25 percent on liquid majors.
Heatmap Style Gradient, Palette Viridis or Turbo for contrast.
Extend Unfilled on, Auto Remove on for a clean live map.
Notes
This tool does not predict the future. It maps imbalances and momentum so you can frame trades with clearer context, cleaner invalidation, and better ranking of which gaps matter. Use it with risk control and in combination with your broader process.

smart honey liteThis is template for strategy with averaging
After "longcondition = " you can set your own terms for first entry
AlgoWay GRSIM🧭 What this strategy tries to do
This strategy detects when a market move is losing strength and prepares for a potential reversal, but it waits for fresh momentum confirmation before acting.
It combines:
• RSI-based divergence (to spot exhaustion and potential turning points),
• Impulse MACD (to verify that the new direction actually has force behind it).
________________________________________
⚙️ When it takes trades
Long (Buy):
• A bullish RSI divergence appears (a clue that selling pressure is fading);
• Within a short time window, the Impulse MACD turns strongly positive;
• Optionally, the impulse line itself must be rising (if the Impulse Direction Filter is
enabled).
Short (Sell):
• A bearish RSI divergence appears (buying pressure fading);
• Within a short time window, the Impulse MACD turns strongly negative;
• Optionally, the impulse line must be falling (if the Impulse Direction Filter is enabled).
If momentum confirmation happens too late, the divergence “expires” and the signal is ignored.
________________________________________
🧩 How entries work
1. Reversal clue:
The strategy detects disagreement between price and RSI (price makes a new high/low, RSI doesn’t).
That suggests a shift in underlying strength.
2. Momentum confirmation:
Before entering, the Impulse MACD must agree — showing real push in the same direction.
3. Impulse direction filter (optional):
When enabled, the impulse itself must accelerate (rise for longs, fall for shorts), avoiding fake signals where price diverges but momentum is still fading.
4. No stacking:
It opens only one position at a time.
________________________________________
🚪 How exits work
Two main exit styles:
Conservative (default):
Longs close when impulse crosses below its signal line.
Shorts close when impulse crosses above its signal line.
✅ Keeps trades as long as momentum agrees.
Color-change (fast):
Longs close immediately when impulse flips bearish.
Shorts close immediately when impulse flips bullish.
⚡ Faster and more defensive.
Plus:
Stop Loss (%) and Take Profit (%) act as fixed-distance protective exits (set to 0 to disable either one).
________________________________________
📊 What you’ll see on the chart
A thick Impulse MACD line and thin signal line (oscillator view).
Diamonds — detected bullish/bearish divergence points.
Circles — where impulse crosses its signal (momentum change).
A performance panel (top-right) showing Net Profit, Trades, Win Rate, Profit Factor, Pessimistic PF, and Max Drawdown.
________________________________________
🔧 What you can tune
Signal Lifetime (bars): how long a divergence remains valid.
Impulse Direction Filter: ensure the impulse itself is moving in the trade’s direction.
Stop Loss / Take Profit (%): risk and target in percent.
Exit Style: conservative cross or faster color-change.
RSI / MA / Signal Lengths: adjust responsiveness (defaults are balanced).
________________________________________
💪 Strengths
Confirms reversals using momentum direction, not just divergence.
Avoids “early” signals where momentum is still fading.
Works symmetrically for longs and shorts.
Built-in stop/target protection.
Clear, visual confirmation of all logic components.
________________________________________
⚠️ Things to keep in mind
In sideways markets, the impulse can flip often — prefer conservative exits.
Too small SL/TP → constant stop-outs.
Too wide SL/TP → deep drawdowns.
Always test with different timeframes and markets.
________________________________________
💡 Practical tips
Start with default settings.
Enable “Use Impulse Direction Filter” in trending markets, disable it in very choppy ones.
Focus on Profit Factor, Win Rate, and Max Drawdown after several dozen trades.
Keep SL/TP roughly aligned with typical swing size.
“AlgoWay GRSIM” is a reversal-with-confirmation strategy: it spots likely turns, demands real momentum alignment (optionally verified by impulse direction), and manages exits with clear momentum cues plus built-in protective limits.

VWAP + Multi-Condition RSI Signals + FibonacciPlatform / System
Platform: TradingView
Language: Pine Script® v6
Purpose: This script is an overlay indicator for technical analysis on charts. It combines multiple tools: VWAP, RSI signals, and Fibonacci levels.
1️⃣ VWAP (Volume Weighted Average Price)
What it does:
Plots the VWAP line on the chart, which is a weighted average price based on volume.
Can be anchored to different periods: Session, Week, Month, Quarter, Year, Decade, Century, or corporate events like Earnings, Dividends, Splits.
Optionally plots bands above and below VWAP based on standard deviation or a percentage.
Supports up to 3 bands with customizable multipliers.
Will not display if the timeframe is daily or higher and the hideonDWM option is enabled.
Visual on chart: A main VWAP line with optional shaded bands.
2️⃣ RSI (Relative Strength Index) Signals
What it does:
Calculates RSI with a configurable period.
Identifies overbought and oversold zones using user-defined levels.
Generates buy/sell signals based on:
RSI crossing above oversold → Buy
RSI crossing below overbought → Sell
Detects strong signals using divergences:
Bullish divergence: Price makes lower low, RSI makes higher low → Strong Buy
Bearish divergence: Price makes higher high, RSI makes lower high → Strong Sell
Optional momentum signals when RSI crosses 50 after recent overbought/oversold conditions.
Visual on chart:
Triangles for buy/sell
Different color triangles/circles for strong and momentum signals
Background shading in RSI overbought/oversold zones
Alerts: The script can trigger alerts when any of these signals occur.
3️⃣ Fibonacci Levels
What it does:
Calculates Fibonacci retracement and extension levels based on the highest high and lowest low over a configurable lookback period.
Plots standard Fibonacci levels: 0.146, 0.236, 0.382, 0.5, 0.618, 0.786, 1.0
Plots extension levels: 1.272, 1.618, 2.0, 2.618
Helps identify potential support/resistance zones.
Visual on chart: Horizontal lines at each Fibonacci level, shaded with different transparencies.
Summary
This script is essentially a multi-tool trading indicator that combines:
VWAP with dynamic bands for trend analysis and price positioning
RSI signals with divergences for entry/exit points
Fibonacci retracement and extension levels for support/resistance
It is interactive and visual, providing both chart overlays and alert functionality for active trading strategies.
This code is provided for training and educational purposes only. It is not financial advice and should not be used for live trading without proper testing and professional guidance.

RSI Divergence Screener [Pineify]RSI Divergence Screener
Key Features
Multi-symbol and multi-timeframe support for advanced market screening.
Real-time detection and visualization of bullish and bearish RSI divergences.
Seamless integration with core technical indicators and custom divergences.
Highly customizable parameters for precise adaptation to personal trading strategies.
Comprehensive screener table for swift asset comparison and analysis.
How It Works
The RSI Divergence Screener leverages the power of Relative Strength Index (RSI) to systematically track momentum shifts across cryptocurrencies and their respective timeframes. By monitoring both fast and slow RSI calculations, the screener isolates divergence signals—key reversal points that often precede major price moves.
The indicator calculates two RSI values for each selected asset: one with a short lookback (Fast RSI) and another with a longer period (Slow RSI).
It runs a comparative algorithm to find divergences—whenever Fast RSI deviates significantly from Slow RSI, it flags the signal as bullish or bearish.
All detected divergences are dynamically presented in a table view, allowing traders to scan symbols and timeframes for optimal trading setups.
Trading Ideas and Insights
Spot early momentum reversals and preempt major price swings via divergence signals.
Combine multiple symbols and timeframes for cross-market trending opportunities.
Identify high-probability scalping and swing trading setups informed by RSI divergence logic.
Quickly compare crypto asset strength and trend exhaustion across short and long-term horizons.
How Multiple Indicators Work Together
This screener’s edge lies in its synergistic use of multi-setting RSI calculations and customizable input groups.
The dual-RSI approach (Fast vs. Slow) isolates subtle trend shifts missed by traditional single-period RSI.
Safe and reliable divergences arise only when the mathematical difference between Fast RSI and Slow RSI meets predefined thresholds, minimizing false positives.
Divergences are contextualized using tailored color codes and backgrounds, rendering insights immediately actionable.
You can expand analysis with additional moving average filters or overlays for further confirmation.
Unique Aspects
First-of-its-kind screener dedicated solely to RSI divergence, designed especially for crypto volatility.
Efficient screening of up to eight assets and multiple timeframes in one compact dashboard.
Intuitive iconography, color logic, and table layouts optimized for rapid decision-making.
Advanced input group design for fine-tuning indicator settings per symbol, timeframe, and source.
How to Use
Select up to eight cryptocurrency symbols to screen for divergence signals.
Assign individual timeframes and source prices for each asset to customize analysis.
Set Fast RSI and Slow RSI lengths according to your preferred strategy (e.g., scalping, swing, or trend following).
Review the screener table: colored cells highlight actionable bullish (green) and bearish (red) divergences.
Confirm trade setups with additional indicators or price action for robust risk management.
Customization
Symbols: Choose any crypto pair or ticker for dynamic divergence tracking.
Timeframes: Scan across 1m, 5m, 10m, 30m, and more for full market coverage.
RSI lengths: Configure Fast and Slow RSI periods based on volatility and trading style.
Visuals: Tailor table colors, fonts, and alert backgrounds per your preference.
Conclusion
The RSI Divergence Screener is a versatile, original TradingView indicator that empowers traders to scan, compare, and act on divergence signals with speed and precision. Its multi-symbol design, robust logic, and extensive customization options set a new standard for market screening tools. Integrate it into your crypto trading process to capture actionable opportunities ahead of the crowd and optimize your technical analysis workflow.

Fury by Tetrad Fury by Tetrad
What it is:
A rules-based Bollinger+RSI strategy that fades extremes: it looks for price stretching beyond Bollinger Bands while RSI confirms exhaustion, enters countertrend, then exits at predefined profit multipliers or optional stoploss. “Ultra Glow” visuals are purely cosmetic.
How it works — logic at a glance
Framework: Classic Bollinger Bands (SMA basis; configurable length & multiplier) + RSI (configurable length).
Long entries:
Price closes below the lower band and RSI < Long RSI threshold (default 28.3) → open LONG (subject to your “Market Direction” setting).
Short entries:
Price closes above the upper band and RSI > Short RSI threshold (default 88.4) → open SHORT.
Profit exits (price targets):
Uses simple multipliers of the strategy’s average entry price:
Long exit = `entry × Long Exit Multiplier` (default 1.14).
Short exit = `entry × Short Exit Multiplier` (default 0.915).
Risk controls:
Optional pricebased stoploss (disabled by default) via:
Long stop = `entry × Long Stop Factor` (default 0.73).
Short stop = `entry × Short Stop Factor` (default 1.05).
Directional filter:
“Market Direction” input lets you constrain entries to Market Neutral, Long Only, or Short Only.
Visuals:
“Ultra Glow” draws thin layered bands around upper/basis/lower; these do not affect signals.
> Note: Inputs exist for a timebased stop tracker in code, but this version exits via targets and (optional) price stop only.
Why it’s different / original
Explicit extreme + momentum pairing: Entries require simultaneous band breach and RSI exhaustion, aiming to avoid entries on gardenvariety volatility pokes.
Deterministic exits: Multiplier-based targets keep results auditable and reproducible across datasets and assets.
Minimal, unobtrusive visuals: Thin, layered glow preserves chart readability while communicating regime around the Bollinger structure.
Inputs you can tune
Bollinger: Length (default 205), Multiplier (default 2.2).
RSI: Length (default 23), Long/Short thresholds (28.3 / 88.4).
Targets: Long Exit Mult (1.14), Short Exit Mult (0.915).
Stops (optional): Enable/disable; Long/Short Stop Factors (0.73 / 1.05).
Market Direction: Market Neutral / Long Only / Short Only.
Visuals: Ultra Glow on/off, light bar tint, trade labels on/off.
How to use it
1. Timeframe & assets: Works on any symbol/timeframe; start with liquid majors and 60m–1D to establish baseline behavior, then adapt.
2. Calibrate thresholds:
Narrow/meanreverting markets often tolerate tighter RSI thresholds.
Fast/volatile markets may need wider RSI thresholds and stronger stop factors.
3. Pick realistic targets: The default multipliers are illustrative; tune them to reflect typical mean reversion distance for your instrument/timeframe (e.g., ATRinformed profiling).
4. Risk: If enabling stops, size positions so risk per trade ≤ 1–2% of equity (max 5–10% is a commonly cited upper bound).
5. Mode: Use Long Only or Short Only when your discretionary bias or higher timeframe model favors one side; otherwise Market Neutral.
Recommended publication properties (for backtests that don’t mislead)
When you publish, set your strategy’s Properties to realistic values and keep them consistent with this description:
Initial capital: 10,000 (typical retail baseline).
Commission: ≥ 0.05% (adjust for your venue).
Slippage: ≥ 2–3 ticks (or a conservative pertrade value).
Position sizing: Avoid risking > 5–10% equity per trade; fixedfractional sizing ≤ 10% or fixedcash sizing is recommended.
Dataset / sample size: Prefer symbols/timeframes yielding 100+ trades over the tested period for statistical relevance. If you deviate, say why.
> If you choose different defaults (e.g., capital, commission, slippage, sizing), explain and justify them here, and use the same settings in your publication.
Interpreting results & limitations
This is a countertrend approach; it can struggle in strong trends where band breaches compound.
Parameter sensitivity is real: thresholds and multipliers materially change trade frequency and expectancy.
No predictive claims: Past performance is not indicative of future results. The future is unknowable; treat outputs as decision support, not guarantees.
Suggested validation workflow
Try different assets. (TSLA, AAPL, BTC, SOL, XRP)
Run a walkforward across multiple years and market regimes.
Test several timeframes and multiple instruments. (30m Suggested)
Compare different commission/slippage assumptions.
Inspect distribution of returns, max drawdown, win/loss expectancy, and exposure.
Confirm behavior during trend vs. range segments.
Alerts & automation
This release focuses on chart execution and visualization. If you plan to automate, create alerts at your entry/exit conditions and ensure your broker/venue fills reflect your slippage/fees assumptions.
Disclaimer
This script is provided for educational and research purposes. It is not investment advice. Trading involves risk, including the possible loss of principal. © Tetrad Protocol.

Solana 4H RSI->MACD — Counter-Trend By TetradTetrad RSI→RSI Cross→MACD (Sequenced) — Counter-Trend (SL-Only)
Category: Market-neutral, counter-trend, sequenced entries
Timeframe default: Works on any TF; designed around 4H On Solana
Markets: Any (spot, perp, futures); parameterize to your asset
What it does
This strategy hunts reversals using a 3-step sequence on RSI and MACD, then optionally restricts entries by market regime and a price gate. It shows stop-loss lines only when hit (clean chart), and paints a Donchian glow for quick read of backdrop conditions.
Entry logic (sequenced)
1. RSI Extreme:
Long path activates when RSI < Oversold (default 27.5).
Short path activates when RSI > Overbought (default 74).
2. RSI Cross confirmation:
Long path: RSI crosses up back above the oversold level.
Short path: RSI crosses down back below the overbought level.
Each step has a max bar lookback so stale signals time out.
3. MACD Cross trigger:
Long: MACD line crosses above Signal.
Short: MACD line crosses below Signal.
→ When step 3 fires and gates are satisfied, a trade is entered.
Optional gates & filters
Regime Filter (Counter-Trend):
Longs allowed in **Range / Short Trend / Short Parabolic** regimes.
Shorts allowed in **Range / Long Trend / Long Parabolic** regimes.
Based on ADX/DI and ATR% intensity.
* Price Gate (Long Ceiling):
Toggle to **disable new longs above a chosen price (default 209.0 For SOL).
Useful for assets like SOL where you want longs only below a cap.
Exits / Risk
* Stop-Loss (% of entry):** default **14%**, toggleable.
* SL visualization:** plots a **thin dashed red line only on the bar it’s hit**.
* (No take-profit or time-based exit in this version—keep it pure to the sequence and regime. Add TP/time exits if desired.)
Visuals
* Donchian Glow (50): background band only (upper/lower lines hidden).
* Regime HUD: compact table (top-right) highlighting the active regime.
* Minimal marks: no entry/exit “arms” clutter; only SL-hit lines render.
Inputs (key)
* Core: RSI Length, Oversold/Overbought, MACD Fast/Slow/Signal.
* Sequence: Max bars from Extreme→RSI Cross and RSI Cross→MACD Cross.
* Regime: ADX Length, Trend/Parabolic thresholds, ATR length & floor.
* Stops: Enable/disable; SL %.
* Price Gate: Enable; Long ceiling price.
Alerts
Sequenced Long (CT): RSIhigh → RSI cross down → MACD bear cross.
## Notes & Tips
Designed for counter-trend fades that become trend rides. The regime filter helps avoid fading true parabolics and aligns entries with safer contexts.
The sequence is stateful (steps must occur in order). If a step times out, the path resets.
Works on lower TFs, but the 4H baseline reduces noise and over-trading.
Consider pairing with volume or structure filters if you want fewer but higher-conviction entries.
Past performance ≠ future results. **Educational use only. Not financial advice.

Order Flow RSI - Price / CVD / OIOrder Flow RSI blends three powerful market perspectives — Price , Cumulative Volume Delta (CVD) , and Open Interest (OI) — into one unified RSI-style oscillator.
It reveals momentum and imbalance across these data streams and highlights situations where participation, liquidity, and positioning disagree — moments that often precede reversals.
What it does
The indicator converts:
Price → RSI (classic momentum),
CVD → RSI (buy/sell pressure balance),
OI → RSI (position expansion/contraction)
…then plots all three RSIs together on the same 0–100 scale.
A fourth Consensus RSI (average of any two or all three) can optionally be shown to simplify the view.
Core logic
CVD engine – based on TradingView’s native volume-delta request.
Modes: Continuous (default, smooth line), Anchored (resets each session), Rolling window.
Open Interest – pulled automatically from the symbol’s “_OI” feed; aligns to chart timeframe for real-time flow.
RSI calculation – standard RSI applied to each data stream, optionally smoothed (SMA / EMA / RMA / WMA / VWMA).
Signals – optional background highlights when:
All three RSIs are overbought (red) or oversold (green), or
Any pair show opposite extremes (e.g., price overbought + OI oversold).
Consensus RSI – arithmetic mean of the selected RSIs, summarizing overall market tone.
Inputs overview
CVD settings: anchor period, lower-TF delta, mode, rolling length
RSI lengths: separate for price, CVD, OI
Smoothing: type + period applied to all RSIs at once
Consensus: choose which RSIs to average
Signals: enable/disable each combination; optional alerts
Levels: adjustable OB/MID/OS (default 70 / 50 / 30)
Visuals: fill between active RSIs, background highlights, level lines, colors in Style tab
How to read it
All 3 overbought (red): broad exhaustion → possible correction
All 3 oversold (green): broad depletion → possible bounce
Opposite pairs: divergence between price and participation
Price↑ but OI↓ (red) → weak rally, fading participation
Price↓ but CVD↑ (green) → hidden accumulation
Combine with structure and volume profile for confirmation.
Notes
Works best on assets with full CVD + OI data (futures, BTC, etc.).
Use Continuous CVD for smooth RSI, Anchored for session analysis.
Smoothing 2–5 EMA is a good starting point to reduce noise.
All styling (colors, line types, thickness) is adjustable in the Style tab.
Limitations & caveats
CVD requires accurate tick/volume/delta data from your data feed. Performance may differ across instruments.
OI availability varies by exchange / symbol. Where OI is absent, pairwise OI signals are not evaluated.
This indicator is a tool — it generates signals of interest, not guaranteed profitable trades. Backtest and combine with your risk rules.
Smoothing introduces lag; longer smoothing reduces noise but delays signals.
Order Flow RSI bridges traditional momentum analysis and order-flow context — giving a multi-dimensional view of when markets are truly stretched or quietly reloading.
Sometimes it works, sometimes it doesn't.

Free Stock ScreenerMissing great trade opportunities is annoying, and unless you have 12 screens or only trade one market, you are missing a lot of trades. To fix that, we created this free stock screener so you get notified instantly of potential great trading conditions in real time, right on your chart.
You get notified of trading benchmarks being met by the value being displayed on the scanner as well as a color change so that it grabs your attention and makes you aware that you should take a look at the other market and look for a potential trade. It also has built in alerts so you can have an alert notification go off when any of your trading conditions are met instead of needing to watch the scanner for color changes.
The screener will change the ticker symbol background color to red green when price is above or below the previous daily range and above or below both VWAPs. This signals that the ticker is trending, which typically means it is a great time to trade that market and follow the trend.
This free stock screener allows you to scan up to 10 different markets at the same time for various different conditions so you always know what is going on with your favorite trading symbols. If you want to scan more tickers, just add the indicator to your chart again and change the table position to the other side of the screen and update the tickers on the 2nd screener, allowing you to have 20 tickers at a time.
The scanner can be fully customized by changing the markets that it screens and turning on or off as many of them as you would like. You can also turn on or off any of the different data sets so that you only get information about trading conditions that matter to you.
The screener can provide data on any type of market, such as stocks, crypto, futures, forex and more. Each ticker can be adjusted to whatever market you would like it to scan for data in the settings panel, the only limitation is that it will not provide data for the VWAP and volume trend score if the ticker you are screening does not provide volume data.
Screener Features
The scanner will provide the following types of data for each ticker that is turned on:
Volume - Provides a volume score compared to the average volume and notifies you of higher than normal volume and volume spikes on individual bars by changing colors.
Volatility - Provides a volatility score compared to the average volatility and notifies you of higher than normal volatility by changing colors.
Oscillator - Choose between the RSI or CCI. The value of that oscillator will be displayed and will notify you when values are in extreme ranges such as overbought or oversold conditions according to the threshold values you enter in the settings panel. When those thresholds have been breached, you will be notified by it changing color.
Big Candles - Compares the current candle to average previous candle sizes, and changes color to notify you of big candles including a big top wick, big bottom wick, big candle body and big candle high to low range.
Daily Level Touches & Trends - Calculates and displays various daily candle and intraday open price levels that act as support and resistance. Notifies you when price is touching any of the daily levels that are turned on. The levels you can have on are as follows: previous day high, previous day low or previous day open. It also will notify you when price is touching the current day’s open, NY 930am open, Asia 8pm open, London 2am open and NY midnight 12am open. It will also say “Above” if price is above the previous day’s high or it will say “Below” if price is below the previous day’s low. The color of the cell will also change when a level touch is happening or price is above the previous day high or below the previous day low.
VWAP - Choose from 2 different VWAP lengths, default settings are daily and weekly VWAPs. You will get notified if price touches either of the VWAPs and they will also say “Above” or “Below” if price is currently above or below each VWAP.
How To Use The Screener To Help You Trade
The main purpose of the screener is to scan other markets and notify you of potential good trading opportunities such as price bouncing off of the daily levels or VWAPs. It can also be used to know when price is trending according to the VWAPs and daily levels. Lastly, you can use it to know how the volume and volatility trends are currently which gives you more confidence in taking a trade with this data when volume and volatility are present.
Volume Score
When volume is high, this represents a good time to trade because there are many market participants and price is likely to be volatile while there is high volume which can present a lot of good trade setups for you to take.
The volume score shown on the screener measures the current volume trend compared to previous volume trends and calculates that into a score based on 100 being the same as the previous volume trend. So any value above 100 means it is high volume and any value less than 100 means it is lower volume than normal.
In the settings panel, you can adjust the volume threshold that needs to be met for a volume notification to show up. The default setting is at 120, so you will get notified when the current volume trend score is 120 or higher or you can adjust that threshold value to whatever value you prefer.
It also will notify you when there is a volume spike on the current bar. This is determined by calculating an average of the recent volume totals and then checking to see if the current bar is greater than or equal to that average multiplied by 3. So if a single bar has volume that is greater than 3 times what the average volume is, then you will get a notification that says “Spike” to make you aware of that volume spike.
The volume trend threshold, volume spike multiplier and lookback length for the average volume used in volume spike calculations can all be adjusted in the settings panel to fit your desired preferences.
Volatility Score
High volatility can mean it is a great time to trade because the market is moving quickly and providing large enough movements that you can get in and out in a short amount of time, while still accruing decent sized trade PnL.
The volatility score will calculate the current volatility for each market compared to previous conditions and then divide the current volatility by the average volatility to give you a volatility score. Anything over 100 means the market is decently volatile and you should look at that market to find potential trade setups to execute on. Anything below 100 means the market is not very volatile and it is usually best to just wait until volatility returns before you start trading again.
The screener will notify you when the volatility score is above the threshold you set. The default value is set to 90, but can be adjusted to your preference. Pay attention to any market that shows an alert and take a look at that chart because the high volatility may present a good trade setup for you in the near future.
Oscillator Score
The oscillator data can be switched between Relative Strength Index(RSI) and Commodity Channel Index(CCI).
The RSI provides a value between 0 and 100 that indicates the momentum and strength of the recent price action. Many traders use the extremes of the 0-100 range to signal overbought or oversold conditions and use that as a sign to look for price to reverse in the near future. The typical values used for this and the default settings to provide notifications are: 70 for overbought and 30 for oversold. The scanner will notify you when the RSI value is considered overbought or oversold so you know to take a look at the chart and analyze if it is ready for a trade to be taken.
The CCI provides a value that can be used to determine the trend strength of the underlying asset when the oscillator moves above 100 or below -100. These extreme values are outside of the normal accumulation range and signify that price is moving strongly in that direction so it may be a good time to take a trade in the direction of the trend. The scanner will show you the value of the CCI for each market and notify you if that value is above 100 or below -100.
Both RSI and CCI settings can be adjusted in the settings panel to your desired settings so you have the exact oscillator settings you prefer to use as well as the exact values that you want to use for being notified.
Big Candles
Big candles can mean that many traders are buying or selling at the same time and many times indicate a good signal to trade in that same direction. That is why we included this calculation in the screener, so you are always aware when a large candle prints.
It calculates the average size of the recent candles and then uses that average as the benchmark to determine if the current candle is considered big and worthy of notifying you to take a look at that chart.
You can adjust the multiplier used for the big candle threshold to whatever you desire, but the default setting is 3 which means the candle will be considered big and notify you if it is 3 times as large as an average candle.
The big candles data will track the following candle values and notify you with these labels:
High to Low candle size = HL
Candle Body from open to close candle size = OC
Top Wick size = TW
Bottom Wick size = BW
Daily Level Touches & Trend
Daily level touches are excellent levels to watch for price to bounce because they often act as support and resistance levels for intraday trading. The scanner will track each market and notify you when the current candle is touching any of the daily levels that you have turned on in the settings panel.
The main levels that are turned on by default and are useful for all markets and how they will be labeled on the scanner are as follows:
Previous Day High = High
Previous Day Low = Low
Previous Day Open = < Open
Previous Day Close = Close
Current Day Open = Open
We also included some extra levels that are useful for futures traders. They are as follows:
NY 930am Open = 930am
NY 12am Midnight Open = 12am
Asia Open at 8pm NY time = Asia
London Open at 2am NY Time = London
Watch how price reacts to these levels and then trade the bounces off of these levels if the price action confirms that it is going to respect that level.
When price is currently above the previous day high, the scanner will say “Above” and show a green color, indicating a bullish trend and that price is above the previous daily candle’s high.
When price is currently below the previous day low, the scanner will say “Below” and show a red color, indicating a bearish trend and that price is below the previous daily candle’s low.
Pay attention to when price is trending above or below the previous daily candle as those trends can provide excellent trend trading opportunities.
The daily levels that you have turned on in the settings will also show as lines on the chart and include a label next to them, identifying each level so you know what each line represents. You can turn on or off all of the lines shown on the chart in the main settings or turn them off one by one in the style panel of the settings. Labels can also be turned on or off for all of the lines in the main settings panel. You can adjust the label positioning in the Label Offset section of the settings panel.
VWAP Touches & Trend
VWAP stands for volume weighted average price and is a very popular tool that traders use to determine trend direction based on volume as well as an excellent level to trade price bounces off of.
The typical VWAP time period used is Daily, which means the volume weighted average price will reset at the beginning of a new day. We set the first VWAP to be the daily VWAP by default and the second one to be the weekly VWAP. You can adjust both of the time periods to be any of the provided time lengths that you choose.
The screener will show “Above” with a green background color when price is above the VWAP, indicating a bullish trend. It will show “Below” with a red background color when price is below the VWAP, indicating a bearish trend. When both VWAPs are showing Above or Below, you can expect price to trend in that direction, so look for pullbacks you can trade in the direction of the trend. If the VWAPs are showing different directions, then you should expect to bounce back and forth between the VWAPs, but be careful and watch out for price to break beyond either one and start a trend.
When the current candle is touching the VWAP, the scanner will change colors and say VWAP to notify you that price is touching the VWAP and you should look at that chart and analyze the market for a potential bounce off of the VWAP to trade.
Trending Market Signals
Strong trends are excellent markets to trade and can many times provide excellent trading opportunities that don’t require expert price action reading skills to be able to take winning trades from. That is why we included a signal to notify you of a strong trending market.
The strong trending market will show up as a green or red background color for the ticker name. If the color of the ticker name is green, it is notifying you that the price is above the previous daily high, above VWAP 1 and above VWAP 2 and is a good market to look for bullish trend trades. If the color of the ticker name is red, it is notifying you that the price is below the previous daily low, below VWAP 1 and below VWAP 2 and is a good market to look for bearish trend trades.
Changing The Tickers It Scans
To change the tickers that the indicator scans, scroll near the bottom of the settings panel and select the ticker symbol you want to update and then search for the exact symbol you want to use. If you want to scan less tickers, then just turn some of the tickers off that you don’t need.
Scanning More Than 10 Tickers
If you want to scan more than 10 tickers, you can add the scanner to your chart again and then just change the table position to the other side of the screen. This will allow you to scan 10 more tickers that will show up separately. Then if you want even more, just add the indicator to your chart again and update the table position until you have as many markets as you want. The table position setting can be found at the bottom of the main settings panel.
Alerts
The screener has alerts that can be used to notify you when any of the data set thresholds have been met or if price is touching one of the levels. You can set alerts for the following events:
Bullish Trend Alert - Price is above the previous daily high and above both VWAPs.
Bearish Trend Alert - Price is below the previous daily low and below both VWAPs.
High Volume Alert - Volume is higher than the threshold or a volume spike is detected.
High Volatility Alert - Volatility is higher than the threshold.
Oscillator Is Extended Alert - Oscillator value has exceeded the upper or lower threshold.
Big Candle Alert - A big candle has been detected.
Daily Level Touch Alert - One of the daily levels that is turned on is being touched.
VWAP Touch Alert - One of the 2 VWAPs are being touched.
An alert will trigger when any one of tickers on your scanner meets the alert conditions, so when you see the alert, you will need to go to your chart and look at the scanner to see which ticker it was and then navigate to that chart to look for potential trade setups.
The alerts will use the exact same settings you have configured in the settings panel to send you alert notifications. With normal settings, this could give you a lot of alerts, so if you only want alerts to fire when abnormal conditions are being met, try setting up a second screener on your chart that has very high threshold values and only has the most important level touches on. Then turn the setting "Do Not Show The Screener On The Chart" to off so the calculations will still run and fire alerts, but won't clog up your charts. This way you can only get alert notifications when major events happen but still have your normal screener settings available on your chart.
Markets This Can Be Used On
This screener uses the price action and volume data so you can use it to scan any type of market you would like as long as the ticker you are scanning has price and volume data feeds. If a market does not have volume data, then it will just show NaN in the volume row and the VWAP rows will not show anything.

Advanced Speedometer Gauge [PhenLabs]Advanced Speedometer Gauge
Version: PineScript™v6
📌 Description
The Advanced Speedometer Gauge is a revolutionary multi-metric visualization tool that consolidates 13 distinct trading indicators into a single, intuitive speedometer display. Instead of cluttering your workspace with multiple oscillators and panels, this gauge provides a unified interface where you can switch between different metrics while maintaining consistent visual interpretation.
Built on PineScript™ v6, the indicator transforms complex technical calculations into an easy-to-read semi-circular gauge with color-coded zones and a precision needle indicator. Each of the 13 available metrics has been carefully normalized to a 0-100 scale, ensuring that whether you’re analyzing RSI, volume trends, or volatility extremes, the visual interpretation remains consistent and intuitive.
The gauge is designed for traders who value efficiency and clarity. By consolidating multiple analytical perspectives into one compact display, you can quickly assess market conditions without the visual noise of traditional multi-indicator setups. All metrics are non-overlapping, meaning each provides unique insights into different aspects of market behavior.
🚀 Points of Innovation
13 selectable metrics covering momentum, volume, volatility, trend, and statistical analysis, all accessible through a single dropdown menu
Universal 0-100 normalization system that standardizes different indicator scales for consistent visual interpretation across all metrics
Semi-circular gauge design with 21 arc segments providing smooth precision and clear visual feedback through color-coded zones
Non-redundant metric selection ensuring each indicator provides unique market insights without analytical overlap
Advanced metrics including MFI (volume-weighted momentum), CCI (statistical deviation), Volatility Rank (extended lookback), Trend Strength (ADX-style), Choppiness Index, Volume Trend, and Price Distance from MA
Flexible positioning system with 5 chart locations, 3 size options, and fully customizable color schemes for optimal workspace integration
🔧 Core Components
Metric Selection Engine: Dropdown interface allowing instant switching between 13 different technical indicators, each with independent parameter controls
Normalization System: All metrics converted to 0-100 scale using indicator-specific algorithms that preserve the statistical significance of each measurement
Semi-Circular Gauge: Visual display using 21 arc segments arranged in curved formation with two-row thickness for enhanced visibility
Color Zone System: Three distinct zones (0-40 green, 40-70 yellow, 70-100 red) providing instant visual feedback on metric extremes
Needle Indicator: Dynamic pointer that positions across the gauge arc based on precise current metric value
Table Implementation: Professional table structure ensuring consistent positioning and rendering across different chart configurations
🔥 Key Features
RSI (Relative Strength Index): Classic momentum oscillator measuring overbought/oversold conditions with adjustable period length (default 14)
Stochastic Oscillator: Compares closing price to price range over specified period with smoothing, ideal for identifying momentum shifts
MFI (Money Flow Index): Volume-weighted RSI that combines price movement with volume to measure buying and selling pressure intensity
CCI (Commodity Channel Index): Measures statistical deviation from average price, normalized from typical -200 to +200 range to 0-100 scale
Williams %R: Alternative overbought/oversold indicator using high-low range analysis, inverted to match 0-100 scale conventions
Volume %: Current volume relative to moving average expressed as percentage, capped at 100 for extreme spikes
Volume Trend: Cumulative directional volume flow showing whether volume is flowing into up moves or down moves over specified period
ATR Percentile: Current Average True Range position within historical range using specified lookback period (default 100 bars)
Volatility Rank: Close-to-close volatility measured against extended historical range (default 252 days), differs from ATR in calculation method
Momentum: Rate of change calculation showing price movement speed, centered at 50 and normalized to 0-100 range
Trend Strength: ADX-style calculation using directional movement to quantify trend intensity regardless of direction
Choppiness Index: Measures market choppiness versus trending behavior, where high values indicate ranging markets and low values indicate strong trends
Price Distance from MA: Measures current price over-extension from moving average using standard deviation calculations
🎨 Visualization
Semi-Circular Arc Display: Curved gauge spanning from 0 (left) to 100 (right) with smooth progression and two-row thickness for visibility
Color-Coded Zones: Green zone (0-40) for low/oversold conditions, yellow zone (40-70) for neutral readings, red zone (70-100) for high/overbought conditions
Needle Indicator: Downward-pointing triangle (▼) positioned precisely at current metric value along the gauge arc
Scale Markers: Vertical line markers at 0, 25, 50, 75, and 100 positions with corresponding numerical labels below
Title Display: Merged cell showing “𓄀 PhenLabs” branding plus currently selected metric name in monospace font
Large Value Display: Current metric value shown with two decimal precision in large text directly below title
Table Structure: Professional table with customizable background color, text color, and transparency for minimal chart obstruction
📖 Usage Guidelines
Metric Selection
Select Metric: Default: RSI | Options: RSI, Stochastic, Volume %, ATR Percentile, Momentum, MFI (Money Flow), CCI (Commodity Channel), Williams %R, Volatility Rank, Trend Strength, Choppiness Index, Volume Trend, Price Distance | Choose the technical indicator you want to display on the gauge based on your current analytical needs
RSI Settings
RSI Length: Default: 14 | Range: 1+ | Controls the lookback period for RSI calculation, shorter periods increase sensitivity to recent price changes
Stochastic Settings
Stochastic Length: Default: 14 | Range: 1+ | Lookback period for stochastic calculation comparing close to high-low range
Stochastic Smooth: Default: 3 | Range: 1+ | Smoothing period applied to raw stochastic value to reduce noise and false signals
Volume Settings
Volume MA Length: Default: 20 | Range: 1+ | Moving average period used to calculate average volume for comparison with current volume
Volume Trend Length: Default: 20 | Range: 5+ | Period for calculating cumulative directional volume flow trend
ATR and Volatility Settings
ATR Length: Default: 14 | Range: 1+ | Period for Average True Range calculation used in ATR Percentile metric
ATR Percentile Lookback: Default: 100 | Range: 20+ | Historical range used to determine current ATR position as percentile
Volatility Rank Lookback (Days): Default: 252 | Range: 50+ | Extended lookback period for Volatility Rank metric using close-to-close volatility
Momentum and Trend Settings
Momentum Length: Default: 10 | Range: 1+ | Lookback period for rate of change calculation in Momentum metric
Trend Strength Length: Default: 20 | Range: 5+ | Period for directional movement calculations in ADX-style Trend Strength metric
Advanced Metric Settings
MFI Length: Default: 14 | Range: 1+ | Lookback period for Money Flow Index calculation combining price and volume
CCI Length: Default: 20 | Range: 1+ | Period for Commodity Channel Index statistical deviation calculation
Williams %R Length: Default: 14 | Range: 1+ | Lookback period for Williams %R high-low range analysis
Choppiness Index Length: Default: 14 | Range: 5+ | Period for calculating market choppiness versus trending behavior
Price Distance MA Length: Default: 50 | Range: 10+ | Moving average period used for Price Distance standard deviation calculation
Visual Customization
Position: Default: Top Right | Options: Top Left, Top Right, Bottom Left, Bottom Right, Middle Right | Controls gauge placement on chart for optimal workspace organization
Size: Default: Normal | Options: Small, Normal, Large | Adjusts overall gauge dimensions and text size for different monitor resolutions and preferences
Low Zone Color (0-40): Default: Green (#00FF00) | Customize color for low/oversold zone of gauge arc
Medium Zone Color (40-70): Default: Yellow (#FFFF00) | Customize color for neutral/medium zone of gauge arc
High Zone Color (70-100): Default: Red (#FF0000) | Customize color for high/overbought zone of gauge arc
Background Color: Default: Semi-transparent dark gray | Customize gauge background for contrast and chart integration
Text Color: Default: White (#FFFFFF) | Customize all text elements including title, value, and scale labels
✅ Best Use Cases
Quick visual assessment of market conditions when you need instant feedback on whether an asset is in extreme territory across multiple analytical dimensions
Workspace organization for traders who monitor multiple indicators but want to reduce chart clutter and visual complexity
Metric comparison by switching between different indicators while maintaining consistent visual interpretation through the 0-100 normalization
Overbought/oversold identification using RSI, Stochastic, Williams %R, or MFI depending on whether you prefer price-only or volume-weighted analysis
Volume analysis through Volume %, Volume Trend, or MFI to confirm price movements with corresponding volume characteristics
Volatility monitoring using ATR Percentile or Volatility Rank to identify expansion/contraction cycles and adjust position sizing
Trend vs range identification by comparing Trend Strength (high values = trending) against Choppiness Index (high values = ranging)
Statistical over-extension detection using CCI or Price Distance to identify when price has deviated significantly from normal behavior
Multi-timeframe analysis by duplicating the gauge on different timeframe charts to compare metric readings across time horizons
Educational purposes for new traders learning to interpret technical indicators through consistent visual representation
⚠️ Limitations
The gauge displays only one metric at a time, requiring manual switching to compare different indicators rather than simultaneous multi-metric viewing
The 0-100 normalization, while providing consistency, may obscure the raw values and specific nuances of each underlying indicator
Table-based visualization cannot be exported or saved as an image separately from the full chart screenshot
Optimal parameter settings vary by asset type, timeframe, and market conditions, requiring user experimentation for best results
💡 What Makes This Unique
Unified Multi-Metric Interface: The only gauge-style indicator offering 13 distinct metrics through a single interface, eliminating the need for multiple oscillator panels
Non-Overlapping Analytics: Each metric provides genuinely unique insights—MFI combines volume with price, CCI measures statistical deviation, Volatility Rank uses extended lookback, Trend Strength quantifies directional movement, and Choppiness Index measures ranging behavior
Universal Normalization System: All metrics standardized to 0-100 scale using indicator-appropriate algorithms that preserve statistical meaning while enabling consistent visual interpretation
Professional Visual Design: Semi-circular gauge with 21 arc segments, precision needle positioning, color-coded zones, and clean table implementation that maintains clarity across all chart configurations
Extensive Customization: Independent parameter controls for each metric, five position options, three size presets, and full color customization for seamless workspace integration
🔬 How It Works
1. Metric Calculation Phase:
All 13 metrics are calculated simultaneously on every bar using their respective algorithms with user-defined parameters
Each metric applies its own specific calculation method—RSI uses average gains vs losses, Stochastic compares close to high-low range, MFI incorporates typical price and volume, CCI measures deviation from statistical mean, ATR calculates true range, directional indicators measure up/down movement, and statistical metrics analyze price relationships
2. Normalization Process:
Each calculated metric is converted to a standardized 0-100 scale using indicator-appropriate transformations
Some metrics are naturally 0-100 (RSI, Stochastic, MFI, Williams %R), while others require scaling—CCI transforms from ±200 range, Momentum centers around 50, Volume ratio caps at 2x for 100, ATR and Volatility Rank calculate percentile positions, and Price Distance scales by standard deviations
3. Gauge Rendering:
The selected metric’s normalized value determines the needle position across 21 arc segments spanning 0-100
Each arc segment receives its color based on position—segments 0-8 are green zone, segments 9-14 are yellow zone, segments 15-20 are red zone
The needle indicator (▼) appears in row 5 at the column corresponding to the current metric value, providing precise visual feedback
4. Table Construction:
The gauge uses TradingView’s table system with merged cells for title and value display, ensuring consistent positioning regardless of chart configuration
Rows are allocated as follows: Row 0 merged for title, Row 1 merged for large value display, Row 2 for spacing, Rows 3-4 for the semi-circular arc with curved shaping, Row 5 for needle indicator, Row 6 for scale markers, Row 7 for numerical labels at 0/25/50/75/100
All visual elements update on every bar when barstate.islast is true, ensuring real-time accuracy without performance impact
💡 Note:
This indicator is designed for visual analysis and market condition assessment, not as a standalone trading system. For best results, combine gauge readings with price action analysis, support and resistance levels, and broader market context. Parameter optimization is recommended based on your specific trading timeframe and asset class. The gauge works on all timeframes but may require different parameter settings for intraday versus daily/weekly analysis. Consider using multiple instances of the gauge set to different metrics for comprehensive market analysis without switching between settings.

Triple SuperTrend + RSI + Fib BBTriple SuperTrend + RSI + Fibonacci Bollinger Bands Strategy
📊 Overview
This advanced trading strategy combines the power of three SuperTrend indicators with RSI confirmation and Fibonacci Bollinger Bands to generate high-probability trade signals. The strategy is designed to capture strong trending moves while filtering out false signals through multi-indicator confluence.
🔧 Core Components
Three SuperTrend Indicators
The strategy uses three SuperTrend indicators with progressively longer periods and multipliers:
SuperTrend 1: 10-period ATR, 1.0 multiplier (fastest, most sensitive)
SuperTrend 2: 11-period ATR, 2.0 multiplier (medium sensitivity)
SuperTrend 3: 12-period ATR, 3.0 multiplier (slowest, most stable)
This layered approach ensures that all three timeframe perspectives align before generating a signal, significantly reducing false entries.
RSI Confirmation (7-period)
The Relative Strength Index acts as a momentum filter:
Long signals require RSI > 50 (bullish momentum)
Short signals require RSI < 50 (bearish momentum)
This prevents entries during weak or divergent price action.
Fibonacci Bollinger Bands (200, 2.618)
Uses a 200-period Simple Moving Average with 2.618 standard deviation bands (Fibonacci ratio). These bands serve dual purposes:
Visual representation of price extremes
Automatic exit trigger when price reaches overextended levels
📈 Entry Logic
LONG Entry (BUY Signal)
A LONG position is opened when ALL of the following conditions are met simultaneously:
All three SuperTrend indicators turn green (bullish)
RSI(7) is above 50
This is the first bar where all conditions align (no repainting)
SHORT Entry (SELL Signal)
A SHORT position is opened when ALL of the following conditions are met simultaneously:
All three SuperTrend indicators turn red (bearish)
RSI(7) is below 50
This is the first bar where all conditions align (no repainting)
🚪 Exit Logic
Positions are automatically closed when ANY of these conditions occur:
SuperTrend Color Change: Any one of the three SuperTrend indicators changes direction
Fibonacci BB Touch: Price reaches or exceeds the upper or lower Fibonacci Bollinger Band (2.618 standard deviations)
This dual-exit approach protects profits by:
Exiting quickly when trend momentum shifts (SuperTrend change)
Taking profits at statistical price extremes (Fib BB touch)
🎨 Visual Features
Signal Arrows
Green Up Arrow (BUY): Appears below the bar when long entry conditions are met
Red Down Arrow (SELL): Appears above the bar when short entry conditions are met
Yellow Down Arrow (EXIT): Appears above the bar when exit conditions are met
Background Coloring
Light Green Tint: All three SuperTrends are bullish (uptrend environment)
Light Red Tint: All three SuperTrends are bearish (downtrend environment)
SuperTrend Lines
Three colored lines plotted with varying opacity:
Solid line (ST1): Most responsive to price changes
Semi-transparent (ST2): Medium-term trend
Most transparent (ST3): Long-term trend structure
Dashboard
Real-time information panel showing:
Individual SuperTrend status (UP/DOWN)
Current RSI value and color-coded status
Current position (LONG/SHORT/FLAT)
Net Profit/Loss
⚙️ Customizable Parameters
SuperTrend Settings
ATR periods for each SuperTrend (default: 10, 11, 12)
Multipliers for each SuperTrend (default: 1.0, 2.0, 3.0)
RSI Settings
RSI length (default: 7)
RSI source (default: close)
Fibonacci Bollinger Bands
BB length (default: 200)
BB multiplier (default: 2.618)
Strategy Options
Enable/disable long trades
Enable/disable short trades
Initial capital
Position sizing
Commission settings
💡 Strategy Philosophy
This strategy is built on the principle of confluence trading - waiting for multiple independent indicators to align before taking a position. By requiring three SuperTrend indicators AND RSI confirmation, the strategy filters out the majority of low-probability setups.
The multi-timeframe SuperTrend approach ensures that short-term, medium-term, and longer-term trends are all in agreement, which typically occurs during strong, sustainable price moves.
The exit strategy is equally important, using both trend-following logic (SuperTrend changes) and mean-reversion logic (Fibonacci BB touches) to adapt to different market conditions.
📊 Best Use Cases
Trending Markets: Works best in markets with clear directional bias
Higher Timeframes: Designed for 15-minute to daily charts
Volatile Assets: SuperTrend indicators excel in assets with clear trends
Swing Trading: Hold times typically range from hours to days
⚠️ Important Notes
No Repainting: All signals are confirmed and will not change on historical bars
One Signal Per Setup: The strategy prevents duplicate signals on consecutive bars
Exit Protection: Always exits before potentially taking an opposite position
Visual Clarity: All three SuperTrend lines are visible simultaneously for transparency
🎯 Recommended Settings
While default parameters are optimized for general use, consider:
Crypto/Volatile Markets: May benefit from slightly higher multipliers
Forex: Default settings work well for major pairs
Stocks: Consider longer BB periods (250-300) for daily charts
Lower Timeframes: Reduce all periods proportionally for scalping
📝 Alerts
Built-in alert conditions for:
BUY signal triggered
SELL signal triggered
EXIT signal triggered
Set up notifications to never miss a trade opportunity!
Disclaimer: This strategy is for educational and informational purposes only. Past performance does not guarantee future results. Always backtest thoroughly and practice proper risk management before live trading.

Relative Strength Index Remastered [CHE]Relative Strength Index Remastered — Enhanced RSI with robust divergence detection using price-based pivots and line-of-sight validation to reduce false signals compared to the standard RSI indicator.
Summary
RSI Remastered builds on the classic Relative Strength Index by adding a more reliable divergence detection system that relies on price pivots rather than RSI pivots alone, incorporating a line-of-sight check to ensure the RSI path between points remains clear. This approach filters out many false divergences that occur in the original RSI indicator due to its volatile pivot detection on the RSI line itself. Users benefit from clearer reversal and continuation signals, especially in noisy markets, with optional hidden divergence support for trend confirmation. The core RSI calculation and smoothing options remain familiar, but the divergence logic provides materially fewer alerts while maintaining sensitivity.
Motivation: Why this design?
The standard RSI indicator often generates misleading divergence signals because it detects pivots directly on the RSI values, which can fluctuate erratically in volatile conditions, leading to frequent false positives that confuse traders during ranging or choppy price action. RSI Remastered addresses this by shifting pivot detection to the underlying price highs and lows, which are more stable, and adding a validation step that confirms the RSI line does not cross the direct path between pivot points. This design targets the real problem of over-signaling in the original, promoting more actionable insights without altering the RSI's core momentum measurement.
What’s different vs. standard approaches?
- Reference baseline: The classical TradingView RSI indicator, which uses simple RSI-based pivot detection for divergences.
- Architecture differences:
- Pivot identification on price extremes (highs and lows) instead of RSI values, extracting RSI levels at those points for comparison.
- Addition of a line-of-sight validation that checks the RSI path bar by bar between pivots to prevent signals where the line is interrupted.
- Inclusion of hidden divergence types alongside regular ones, using the same robust framework.
- Configurable drawing of connecting lines between validated pivot RSI points for visual clarity.
- Practical effect: Charts show fewer but higher-quality divergence markers and lines, reducing clutter from the original's frequent RSI pivot triggers; this matters for avoiding whipsaws in intraday trading, where the standard version might flag dozens of invalid setups per session.
Key Comparison Aspects
Aspect: Title/Shorttitle
Original RSI: "Relative Strength Index" / "RSI"
Robust Variant: "Relative Strength Index Remastered " / "RSI RM"
Aspect: Max. Lines/Labels
Original RSI: No specification (Standard: 50/50)
Robust Variant: max_lines_count=200, max_labels_count=200 (for more lines/markers in divergences)
Aspect: RSI Calculation & Plots
Original RSI: Identical: RSI with RMA, Plots (line, bands, gradient fills)
Robust Variant: Identical: RSI with RMA, Plots (line, bands, gradient fills)
Aspect: Smoothing (MA)
Original RSI: Identical: Inputs for MA types (SMA, EMA etc.), Bollinger Bands optional
Robust Variant: Identical: Inputs for MA types (SMA, EMA etc.), Bollinger Bands optional
Aspect: Divergence Activation
Original RSI: input.bool(false, "Calculate Divergence") (disabled by default)
Robust Variant: input.bool(true, "Calculate Divergence") (enabled by default, with tooltip)
Aspect: Pivot Calculation
Original RSI: Pivots on RSI (ta.pivotlow/high on RSI values)
Robust Variant: Pivots on price (ta.pivotlow/high on low/high), RSI values then extracted
Aspect: Lookback Values
Original RSI: Fixed: lookbackLeft=5, lookbackRight=5
Robust Variant: Input: L=5 (Pivot Left), R=5 (Pivot Right), adjustable (min=1, max=50)
Aspect: Range Between Pivots
Original RSI: Fixed: rangeUpper=60, rangeLower=5 (via _inRange function)
Robust Variant: Input: rangeUpper=60 (Max Bars), rangeLower=5 (Min Bars), adjustable (min=1–6, max=100–300)
Aspect: Divergence Types
Original RSI: Only Regular Bullish/Bearish: - Bull: Price LL + RSI HL - Bear: Price HH + RSI LH
Robust Variant: Regular + Hidden (optional via showHidden=true): - Regular Bull: Price LL + RSI HL - Regular Bear: Price HH + RSI LH - Hidden Bull: Price HL + RSI LL - Hidden Bear: Price LH + RSI HH
Aspect: Validation
Original RSI: No additional check (only pivot + range check)
Robust Variant: Line-of-Sight Check: RSI line must not cross the connecting line between pivots (line_clear function with slope calculation and loop for each bar in between)
Aspect: Signals (Plots/Shapes)
Original RSI: - Plot of pivot points (if divergence) - Shapes: "Bull"/"Bear" at RSI value, offset=-5
Robust Variant: - No pivot plots, instead shapes at RSI , offset=-R (adjustable) - Shapes: "Bull"/"Bear" (Regular), "HBull"/"HBear" (Hidden) - Colors: Lime/Red (Regular), Teal/Orange (Hidden)
Aspect: Line Drawing
Original RSI: No lines
Robust Variant: Optional (showLines=true): Lines between RSI pivots (thick for regular, dashed/thin for hidden), extend=none
Aspect: Alerts
Original RSI: Only Regular Bullish/Bearish (with pivot lookback reference)
Robust Variant: Regular Bullish/Bearish + Hidden Bullish/Bearish (specific "at latest pivot low/high")
Aspect: Robustness
Original RSI: Simple, prone to false signals (RSI pivots can be volatile)
Robust Variant: Higher: Price pivots are more stable, line-of-sight filters "broken" divergences, hidden support for trend continuations
Aspect: Code Length/Structure
Original RSI: ~100 lines, simple if-blocks for bull/bear
Robust Variant: ~150 lines, extended helper functions (e.g., inRange, line_clear), var group for inputs
How it works (technical)
The indicator first computes the core RSI value based on recent price changes, separating upward and downward movements over the specified length and smoothing them to derive a momentum reading scaled between zero and one hundred. This value is then plotted in a separate pane with fixed upper and lower reference lines at seventy and thirty, along with optional gradient fills to highlight overbought and oversold zones.
For smoothing, a moving average type is applied to the RSI if enabled, with an option to add bands around it based on the variability of recent RSI values scaled by a multiplier. Divergence detection activates on confirmed price pivots: lows for bullish checks and highs for bearish. At each new pivot, the system retrieves the bar index and values (price and RSI) for the current and prior pivot, ensuring they fall within a configurable bar range to avoid unrelated points.
Comparisons then assess whether the price has made a lower low (or higher high) while the RSI at those points moves in the opposite direction—higher for bullish regular, lower for bearish regular. For hidden types, the directions reverse to capture trend strength. The line-of-sight check calculates the straight path between the two RSI points and verifies that the actual RSI values in between stay entirely above (for bullish) or below (for bearish) that path, breaking the signal if any bar violates it. Valid signals trigger shapes at the RSI level of the new pivot and optional lines connecting the points. Initialization uses built-in functions to track prior occurrences, with states persisting across bars for accurate historical comparisons. No higher timeframe data is used, so confirmation occurs after the right pivot bars close, minimizing live-bar repaints.
Parameter Guide
Length — Controls the period for measuring price momentum changes — Default: 14 — Trade-offs/Tips: Shorter values increase responsiveness but add noise and more false signals; longer smooths trends but delays entries in fast markets.
Source — Selects the price input for RSI calculation — Default: Close — Trade-offs/Tips: Use high or low for volatility focus, but close works best for most assets; mismatches can skew overbought/oversold reads.
Calculate Divergence — Enables the enhanced divergence logic — Default: True — Trade-offs/Tips: Disable for pure RSI view to save computation; essential for signal reliability over the standard method.
Type (Smoothing) — Chooses the moving average applied to RSI — Default: SMA — Trade-offs/Tips: None for raw RSI; EMA for quicker adaptation, but SMA reduces whipsaws; Bollinger Bands option adds volatility context at cost of added lines.
Length (Smoothing) — Period for the smoothing average — Default: 14 — Trade-offs/Tips: Match RSI length for consistency; shorter boosts signal speed but amplifies noise in the smoothed line.
BB StdDev — Multiplier for band width around smoothed RSI — Default: 2.0 — Trade-offs/Tips: Lower narrows bands for tighter signals, risking more touches; higher widens for fewer but stronger breakouts.
Pivot Left — Bars to the left for confirming price pivots — Default: 5 — Trade-offs/Tips: Increase for stricter pivots in noisy data, reducing signals; too high delays confirmation excessively.
Pivot Right — Bars to the right for confirming price pivots — Default: 5 — Trade-offs/Tips: Balances with left for symmetry; longer right ensures maturity but shifts signals backward.
Max Bars Between Pivots — Upper limit on distance for valid pivot pairs — Default: 60 — Trade-offs/Tips: Tighten for short-term trades to focus recent action; widen for swing setups but risks unrelated comparisons.
Min Bars Between Pivots — Lower limit to avoid clustered pivots — Default: 5 — Trade-offs/Tips: Raise to filter micro-moves; too low invites overlapping signals like the original RSI.
Detect Hidden — Includes trend-continuation hidden types — Default: True — Trade-offs/Tips: Enable for full trend analysis; disable simplifies to reversals only, akin to basic RSI.
Draw Lines — Shows connecting lines between valid pivots — Default: True — Trade-offs/Tips: Turn off for cleaner charts; helps visually confirm line-of-sight in backtests.
Reading & Interpretation
The main RSI line oscillates between zero and one hundred, crossing above fifty suggesting building momentum and below indicating weakness; touches near seventy or thirty flag potential extremes. The optional smoothed line and bands provide a filtered view—price above the upper band on the RSI pane hints at overextension. Divergence shapes appear as upward labels for bullish (lime for regular, teal for hidden) and downward for bearish (red regular, orange hidden) at the pivot's RSI level, signaling a mismatch only after validation. Connecting lines, if drawn, slope between points without RSI interference, their color matching the shape type; a dashed style denotes hidden. Fewer shapes overall compared to the standard RSI mean higher conviction, but always confirm with price structure.
Practical Workflows & Combinations
- Trend following: Enter longs on regular bullish shapes near support with higher highs in price; filter hidden bullish for pullback buys in uptrends, pairing with a rising smoothed RSI above fifty.
- Exits/Stops: Use bearish regular as reversal warnings to tighten stops; hidden bearish in downtrends confirms continuation—exit if lines show RSI crossing the path.
- Multi-asset/Multi-TF: Defaults suit forex and stocks on one-hour charts; for crypto volatility, widen pivot ranges to ten; scale min/max bars proportionally on daily for swings, avoiding the original's intraday spam.
Behavior, Constraints & Performance
Signals confirm only after the right pivot bars close, so live bars may show tentative pivots that vanish on close, unlike the standard RSI's immediate RSI-pivot triggers—plan for this delay in automation. No higher timeframe calls, so no security-related repaints. Resources include up to two hundred lines and labels for dense charts, with a loop in validation scanning up to three hundred bars between pivots, which is efficient but could slow on very long histories. Known limits: Slight lag at pivot confirmation in trending markets; volatile RSI might rarely miss fine path violations; not ideal for gap-heavy assets where pivots skip.
Sensible Defaults & Quick Tuning
Start with defaults for balanced momentum and divergence on most timeframes. For too many signals (like the original), raise pivot left/right to eight and min bars to ten to filter noise. If sluggish in trends, shorten RSI length to nine and enable EMA smoothing for faster adaptation. In high-volatility assets, widen max bars to one hundred but disable hidden to focus essentials. For clean reversal hunts, set smoothing to none and lines on.
What this indicator is—and isn’t
RSI Remastered serves as a refined momentum and divergence visualization tool, enhancing the standard RSI for better signal quality in technical analysis setups. It is not a standalone trading system, nor does it predict price moves—pair it with volume, structure breaks, and risk rules for decisions. Use alongside position sizing and broader context, not in isolation.
Disclaimer
The content provided, including all code and materials, is strictly for educational and informational purposes only. It is not intended as, and should not be interpreted as, financial advice, a recommendation to buy or sell any financial instrument, or an offer of any financial product or service. All strategies, tools, and examples discussed are provided for illustrative purposes to demonstrate coding techniques and the functionality of Pine Script within a trading context.
Any results from strategies or tools provided are hypothetical, and past performance is not indicative of future results. Trading and investing involve high risk, including the potential loss of principal, and may not be suitable for all individuals. Before making any trading decisions, please consult with a qualified financial professional to understand the risks involved.
By using this script, you acknowledge and agree that any trading decisions are made solely at your discretion and risk.
Do not use this indicator on Heikin-Ashi, Renko, Kagi, Point-and-Figure, or Range charts, as these chart types can produce unrealistic results for signal markers and alerts.
Best regards and happy trading
Chervolino

Enhanced Holt-Winters RSI [BOSWaves]Enhanced Holt-Winters RSI – Next-Level Momentum Smoothing & Signal Precision
Overview
The Enhanced Holt-Winters RSI transforms the classic Relative Strength Index into a robust, lag-minimized momentum oscillator through Holt-Winters triple exponential smoothing. By modeling the level, trend, and cyclical behavior of the RSI series, this indicator delivers smoother, more responsive signals that highlight overbought/oversold conditions, momentum shifts, and high-conviction trading setups without cluttering the chart with noise.
Unlike traditional RSI, which reacts to historical data and produces frequent whipsaws, the Enhanced Holt-Winters RSI filters transient price fluctuations, enabling traders to detect emerging momentum and potential reversal zones earlier.
Theoretical Foundation
The traditional RSI measures relative strength by comparing average gains and losses, but suffers from:
Lag in trend recognition : Signals often arrive after momentum has shifted.
Noise sensitivity : High-frequency price movements generate unreliable crossovers.
Limited insight into structural market shifts : Standard RSI cannot contextualize cyclical or momentum patterns.
The Enhanced Holt-Winters RSI addresses these limitations by applying triple exponential smoothing directly to the RSI series. This decomposes the series into:
Level (Lₜ) : Represents the smoothed central tendency of RSI.
Trend (Tₜ) : Captures rate-of-change in smoothed momentum.
Seasonal Component (Sₜ) : Models short-term cyclical deviations in momentum.
By incorporating these elements, the oscillator produces smoothed RSI values that react faster to emerging trends while suppressing erratic noise. Its internal forecast is mathematical, influencing the smoothed RSI output and signals, rather than being directly plotted.
How It Works
The Enhanced Holt-Winters RSI builds its signal framework through several layers:
1. Base RSI Calculation
Computes standard RSI over the selected period as the primary momentum input.
2. Triple Exponential Smoothing (Holt-Winters)
The RSI is smoothed recursively to extract underlying momentum structure:
Level, trend, and seasonal components are combined to produce a smoothed RSI.
This internal smoothing reduces lag and enhances signal reliability.
3. Momentum Analysis
Short-term momentum shifts are tracked via a moving average of the smoothed RSI, highlighting acceleration or deceleration in directional strength.
4. Volume Confirmation (Optional)
Buy/sell signals can be filtered through a configurable volume threshold, ensuring only high-conviction moves trigger alerts.
5. Visual Output
Colored Candles : Represent overbought (red), oversold (green), or neutral (yellow) conditions.
Oscillator Panel : Plots the smoothed RSI with dynamic color coding for immediate trend context.
Signals : Triangular markers indicate bullish or bearish setups, with stronger signals flagged in extreme zones.
Interpretation
The Enhanced Holt-Winters RSI provides a multi-dimensional perspective on price action:
Trend Strength : Smoothed RSI slope and color coding reflect the direction and momentum intensity.
Momentum Shifts : Rapid changes in the smoothed RSI indicate emerging strength or weakness.
Overbought/Oversold Zones : Highlight areas where price is stretched relative to recent momentum.
High-Conviction Signals : Combined with volume filtering, markers indicate optimal entries/exits.
Cycle Awareness : Smoothing reveals structural patterns, helping traders avoid reacting to noise.
By combining these elements, traders gain early insight into market structure and momentum without relying on raw, lag-prone RSI data.
Strategy Integration
The Enhanced Holt-Winters RSI can be applied across trading styles:
Trend Following
Enter when RSI is aligned with price momentum and color-coded signals confirm trend direction.
Strong slope in the smoothed RSI signals trend continuation.
Reversal Trading
Look for RSI extremes with momentum shifts and strong signal markers.
Compression in oscillator values often precedes reversal setups.
Breakout Detection
Oscillator flattening in neutral zones followed by directional expansion indicates potential breakout conditions.
Multi-Timeframe Confluence
Higher timeframes provide directional bias; lower timeframes refine entry timing using smoothed RSI dynamics.
Technical Implementation Details
Input Source : Close, open, high, low, or price.
Smoothing : Holt-Winters triple exponential smoothing applied to RSI.
Parameters :
Level (α) : Controls smoothing of RSI.
Trend (β) : Adjusts responsiveness to momentum changes.
Seasonal Length : Defines cycles for short-term adjustments.
Delta Smoothing : Reduces choppiness in smoothed RSI difference.
Outputs :
Smoothed RSI
Colored candles and oscillator panel
Buy/Sell signal markers (with optional strength filtering)
Volume Filtering : Optional threshold to confirm signals.
Optimal Application Parameters
Asset-Specific Guidance:
Forex : Use moderate smoothing (α, β) to capture medium-term momentum swings while filtering minor price noise. Works best when combined with volume or volatility filters.
Equities : Balance responsiveness and smoothness to identify sustained sector momentum or rotational shifts; ideal for capturing clean directional transitions.
Cryptocurrency : Increase smoothing parameters slightly to stabilize RSI during extreme volatility; optional volume confirmation can help filter false signals.
Futures/Indices : Lower smoothing sensitivity emphasizes macro momentum and structural trend durability over short-term fluctuations.
Timeframe Optimization:
Scalping (1-5m) : Use higher sensitivity (lower smoothing factors) to react quickly to micro-momentum reversals.
Intraday (15m-1h) : Balance smoothing and responsiveness for detecting short-term acceleration and exhaustion zones.
Swing (4h-Daily) : Apply moderate smoothing to reveal underlying directional persistence and cyclical reversals.
Position (Daily-Weekly) : Use stronger smoothing to isolate dominant momentum trends and filter temporary pullbacks.
Integration Guidelines
Combine with trend filters (EMAs, SuperSmoother MA, ATR-based tools) for confirmation.
Use volume and signal strength markers to filter low-conviction trades.
Slope, color, and signal alignment can guide entry, stop placement, and scaling.
Disclaimer
The Enhanced Holt-Winters RSI is a technical analysis tool, not a guaranteed profit system. Effectiveness depends on proper settings, market structure, and disciplined risk management. Always backtest before live trading.

RSI Bollinger Bands [DCAUT]█ RSI Bollinger Bands
📊 ORIGINALITY & INNOVATION
The RSI Bollinger Bands indicator represents a meaningful advancement in momentum analysis by combining two proven technical tools: the Relative Strength Index (RSI) and Bollinger Bands. This combination addresses a significant limitation in traditional RSI analysis - the use of fixed overbought/oversold thresholds (typically 70/30) that fail to adapt to changing market volatility conditions.
Core Innovation:
Rather than relying on static threshold levels, this indicator applies Bollinger Bands statistical analysis directly to RSI values, creating dynamic zones that automatically adjust based on recent momentum volatility. This approach helps reduce false signals during low volatility periods while remaining sensitive to genuine extremes during high volatility conditions.
Key Enhancements Over Traditional RSI:
Dynamic Thresholds: Overbought/oversold zones adapt to market conditions automatically, eliminating the need for manual threshold adjustments across different instruments and timeframes
Volatility Context: Band width provides immediate visual feedback about momentum volatility, helping traders distinguish between stable trends and erratic movements
Reduced False Signals: During ranging markets, narrower bands filter out minor RSI fluctuations that would trigger traditional fixed-threshold signals
Breakout Preparation: Band squeeze patterns (similar to price-based BB) signal potential momentum regime changes before they occur
Self-Referencing Analysis: By measuring RSI against its own statistical behavior rather than arbitrary levels, the indicator provides more relevant context
📐 MATHEMATICAL FOUNDATION
Two-Stage Calculation Process:
Stage 1: RSI Calculation
RSI = 100 - (100 / (1 + RS))
where RS = Average Gain / Average Loss over specified period
The RSI normalizes price momentum into a bounded 0-100 scale, making it ideal for statistical band analysis.
Stage 2: Bollinger Bands on RSI
Basis = MA(RSI, BB Length)
Upper Band = Basis + (StdDev(RSI, BB Length) × Multiplier)
Lower Band = Basis - (StdDev(RSI, BB Length) × Multiplier)
Band Width = Upper Band - Lower Band
The Bollinger Bands measure RSI's standard deviation from its own moving average, creating statistically-derived dynamic zones.
Statistical Interpretation:
Under normal distribution assumptions with default 2.0 multiplier, approximately 95% of RSI values should fall within the bands
Band touches represent statistically significant momentum extremes relative to recent behavior
Band width expansion indicates increasing momentum volatility (strengthening trend or increasing uncertainty)
Band width contraction signals momentum consolidation and potential regime change preparation
📊 COMPREHENSIVE SIGNAL ANALYSIS
Visual Color Signals:
This indicator features dynamic color fills that highlight extreme momentum conditions:
Green Fill (Above Upper Band):
Appears when RSI breaks above the upper band, indicating exceptionally strong bullish momentum
Represents dynamic overbought zone - not necessarily a reversal signal but a warning of extreme conditions
In strong uptrends, green fills can persist as RSI "rides the band" - this indicates sustained momentum strength
Exit of green zone (RSI falling back below upper band) often signals initial momentum weakening
Red Fill (Below Lower Band):
Appears when RSI breaks below the lower band, indicating exceptionally weak bearish momentum
Represents dynamic oversold zone - potential reversal or continuation signal depending on trend context
In strong downtrends, red fills can persist as RSI "rides the band" - this indicates sustained selling pressure
Exit of red zone (RSI rising back above lower band) often signals initial momentum recovery
Position-Based Signals:
Upper Band Interactions:
RSI Touching Upper Band: Dynamic overbought condition - momentum is extremely strong relative to recent volatility, potential exhaustion or continuation depending on trend context
RSI Riding Upper Band: Sustained strong momentum, often seen in powerful trends, not necessarily an immediate reversal signal but warrants monitoring for exhaustion
RSI Crossing Below Upper Band: Initial momentum weakening signal, particularly significant if accompanied by price divergence
Lower Band Interactions:
RSI Touching Lower Band: Dynamic oversold condition - momentum is extremely weak relative to recent volatility, potential reversal or continuation of downtrend
RSI Riding Lower Band: Sustained weak momentum, common in strong downtrends, monitor for potential exhaustion
RSI Crossing Above Lower Band: Initial momentum strengthening signal, early indication of potential reversal or consolidation
Basis Line Signals:
RSI Above Basis: Bullish momentum regime - upward pressure dominant
RSI Below Basis: Bearish momentum regime - downward pressure dominant
Basis Crossovers: Momentum regime shifts, more significant when accompanied by band width changes
RSI Oscillating Around Basis: Balanced momentum, often indicates ranging market conditions
Volatility-Based Signals:
Band Width Patterns:
Narrow Bands (Squeeze): Momentum volatility compression, often precedes significant directional moves, similar to price coiling patterns
Expanding Bands: Increasing momentum volatility, indicates trend acceleration or growing uncertainty
Narrowest Band in 100 Bars: Extreme compression alert, high probability of upcoming volatility expansion
Advanced Pattern Recognition:
Divergence Analysis:
Bullish Divergence: Price makes lower lows while RSI touches or stays above previous lower band touch, suggests downward momentum weakening
Bearish Divergence: Price makes higher highs while RSI touches or stays below previous upper band touch, suggests upward momentum weakening
Hidden Bullish: Price makes higher lows while RSI makes lower lows at the lower band, indicates strong underlying bullish momentum
Hidden Bearish: Price makes lower highs while RSI makes higher highs at the upper band, indicates strong underlying bearish momentum
Band Walk Patterns:
Upper Band Walk: RSI consistently touching or staying near upper band indicates exceptionally strong trend, wait for clear break below basis before considering reversal
Lower Band Walk: RSI consistently at lower band signals very weak momentum, requires break above basis for reversal confirmation
🎯 STRATEGIC APPLICATIONS
Strategy 1: Mean Reversion Trading
Setup Conditions:
Market Type: Ranging or choppy markets with no clear directional trend
Timeframe: Works best on lower timeframes (5m-1H) or during consolidation phases
Band Characteristic: Normal to narrow band width
Entry Rules:
Long Entry: RSI touches or crosses below lower band, wait for RSI to start rising back toward basis before entry
Short Entry: RSI touches or crosses above upper band, wait for RSI to start falling back toward basis before entry
Confirmation: Use price action confirmation (candlestick reversal patterns) at band touches
Exit Rules:
Target: RSI returns to basis line or opposite band
Stop Loss: Fixed percentage or below recent swing low/high
Time Stop: Exit if position not profitable within expected timeframe
Strategy 2: Trend Continuation Trading
Setup Conditions:
Market Type: Clear trending market with higher highs/lower lows
Timeframe: Medium to higher timeframes (1H-Daily)
Band Characteristic: Expanding or wide bands indicating strong momentum
Entry Rules:
Long Entry in Uptrend: Wait for RSI to pull back to basis line or slightly below, enter when RSI starts rising again
Short Entry in Downtrend: Wait for RSI to rally to basis line or slightly above, enter when RSI starts falling again
Avoid Counter-Trend: Do not fade RSI at bands during strong trends (band walk patterns)
Exit Rules:
Trailing Stop: Move stop to break-even when RSI reaches opposite band
Trend Break: Exit when RSI crosses basis against trend direction with conviction
Band Squeeze: Reduce position size when bands start narrowing significantly
Strategy 3: Breakout Preparation
Setup Conditions:
Market Type: Consolidating market after significant move or at key technical levels
Timeframe: Any timeframe, but longer timeframes provide more reliable breakouts
Band Characteristic: Narrowest band width in recent 100 bars (squeeze alert)
Preparation Phase:
Identify band squeeze condition (bands at multi-period narrowest point)
Monitor price action for consolidation patterns (triangles, rectangles, flags)
Prepare bracket orders for both directions
Wait for band expansion to begin
Entry Execution:
Breakout Confirmation: Enter in direction of RSI band breakout (RSI breaks above upper band or below lower band)
Price Confirmation: Ensure price also breaks corresponding technical level
Volume Confirmation: Look for volume expansion supporting the breakout
Risk Management:
Stop Loss: Place beyond consolidation pattern opposite extreme
Position Sizing: Use smaller size due to false breakout risk
Quick Exit: Exit immediately if RSI returns inside bands within 1-3 bars
Strategy 4: Multi-Timeframe Analysis
Timeframe Selection:
Higher Timeframe: Daily or 4H for trend context
Trading Timeframe: 1H or 15m for entry signals
Confirmation Timeframe: 5m or 1m for precise entry timing
Analysis Process:
Trend Identification: Check higher timeframe RSI position relative to bands, trade only in direction of higher timeframe momentum
Setup Formation: Wait for trading timeframe RSI to show pullback to basis in trending direction
Entry Timing: Use confirmation timeframe RSI band touch or crossover for precise entry
Alignment Confirmation: All timeframes should show RSI moving in same direction for highest probability setups
📋 DETAILED PARAMETER CONFIGURATION
RSI Source:
Close (Default): Standard price point, balances responsiveness and reliability
HL2: Reduces noise from intrabar volatility, provides smoother RSI values
HLC3 or OHLC4: Further smoothing for very choppy markets, slower to respond but more stable
Volume-Weighted: Consider using VWAP or volume-weighted prices for additional liquidity context
RSI Length Parameter:
Shorter Periods (5-10): More responsive but generates more signals, suitable for scalping or very active trading, higher noise level
Standard (14): Default and most widely used setting, proven balance between responsiveness and reliability, recommended starting point
Longer Periods (21-30): Smoother momentum measurement, fewer but potentially more reliable signals, better for swing trading or position trading
Optimization Note: Test across different market regimes, optimal length often varies by instrument volatility characteristics
RSI MA Type Parameter:
RMA (Default): Wilder's original smoothing method, provides traditional RSI behavior with balanced lag, most widely recognized and tested, recommended for standard technical analysis
EMA: Exponential smoothing gives more weight to recent values, faster response to momentum changes, suitable for active trading and trending markets, reduces lag compared to RMA
SMA: Simple average treats all periods equally, smoothest output with highest lag, best for filtering noise in choppy markets, useful for long-term position analysis
WMA: Weighted average emphasizes recent data less aggressively than EMA, middle ground between SMA and EMA characteristics, balanced responsiveness for swing trading
Advanced Options: Full access to 25+ moving average types including HMA (reduced lag), DEMA/TEMA (enhanced responsiveness), KAMA/FRAMA (adaptive behavior), T3 (smoothness), Kalman Filter (optimal estimation)
Selection Guide: RMA for traditional analysis and backtesting consistency, EMA for faster signals in trending markets, SMA for stability in ranging markets, adaptive types (KAMA/FRAMA) for varying volatility regimes
BB Length Parameter:
Short Length (10-15): Tighter bands that react quickly to RSI changes, more frequent band touches, suitable for active trading styles
Standard (20): Balanced approach providing meaningful statistical context without excessive lag
Long Length (30-50): Smoother bands that filter minor RSI fluctuations, captures only significant momentum extremes, fewer but higher quality signals
Relationship to RSI Length: Consider BB Length greater than RSI Length for cleaner signals
BB MA Type Parameter:
SMA (Default): Standard Bollinger Bands calculation using simple moving average for basis line, treats all periods equally, widely recognized and tested approach
EMA: Exponential smoothing for basis line gives more weight to recent RSI values, creates more responsive bands that adapt faster to momentum changes, suitable for trending markets
RMA: Wilder's smoothing provides consistent behavior aligned with traditional RSI when using RMA for both RSI and BB calculations
WMA: Weighted average for basis line balances recent emphasis with historical context, middle ground between SMA and EMA responsiveness
Advanced Options: Full access to 25+ moving average types for basis calculation, including HMA (reduced lag), DEMA/TEMA (enhanced responsiveness), KAMA/FRAMA (adaptive to volatility changes)
Selection Guide: SMA for standard Bollinger Bands behavior and backtesting consistency, EMA for faster band adaptation in dynamic markets, matching RSI MA type creates unified smoothing behavior
BB Multiplier Parameter:
Conservative (1.5-1.8): Tighter bands resulting in more frequent touches, useful in low volatility environments, higher signal frequency but potentially more false signals
Standard (2.0): Default setting representing approximately 95% confidence interval under normal distribution, widely accepted statistical threshold
Aggressive (2.5-3.0): Wider bands capturing only extreme momentum conditions, fewer but potentially more significant signals, reduces false signals in high volatility
Adaptive Approach: Consider adjusting multiplier based on instrument characteristics, lower multiplier for stable instruments, higher for volatile instruments
Parameter Optimization Workflow:
Start with default parameters (RSI:14, BB:20, Mult:2.0)
Test across representative sample period including different market regimes
Adjust RSI length based on desired responsiveness vs stability tradeoff
Tune BB length to match your typical holding period
Modify multiplier to achieve desired signal frequency
Validate on out-of-sample data to avoid overfitting
Document optimal parameters for different instruments and timeframes
Reference Levels Display:
Enabled (Default): Shows traditional 30/50/70 levels for comparison with dynamic bands, helps visualize the adaptive advantage
Disabled: Cleaner chart focusing purely on dynamic zones, reduces visual clutter for experienced users
Educational Value: Keeping reference levels visible helps understand how dynamic bands differ from fixed thresholds across varying market conditions
📈 PERFORMANCE ANALYSIS & COMPETITIVE ADVANTAGES
Comparison with Traditional RSI:
Fixed Threshold RSI Limitations:
In ranging low-volatility markets: RSI rarely reaches 70/30, missing tradable extremes
In trending high-volatility markets: RSI frequently breaks through 70/30, generating excessive false reversal signals
Across different instruments: Same thresholds applied to volatile crypto and stable forex pairs produce inconsistent results
Threshold Adjustment Problem: Manually changing thresholds for different conditions is subjective and lagging
RSI Bollinger Bands Advantages:
Automatic Adaptation: Bands adjust to current volatility regime without manual intervention
Consistent Logic: Same statistical approach works across different instruments and timeframes
Reduced False Signals: Band width filtering helps distinguish meaningful extremes from noise
Additional Information: Band width provides volatility context missing in standard RSI
Objective Extremes: Statistical basis (standard deviations) provides objective extreme definition
Comparison with Price-Based Bollinger Bands:
Price BB Characteristics:
Measures absolute price volatility
Affected by large price gaps and outliers
Band position relative to price not normalized
Difficult to compare across different price scales
RSI BB Advantages:
Normalized Scale: RSI's 0-100 bounds make band interpretation consistent across all instruments
Momentum Focus: Directly measures momentum extremes rather than price extremes
Reduced Gap Impact: RSI calculation smooths price gaps impact on band calculations
Comparable Analysis: Same RSI BB appearance across stocks, forex, crypto enables consistent strategy application
Performance Characteristics:
Signal Quality:
Higher Signal-to-Noise Ratio: Dynamic bands help filter RSI oscillations that don't represent meaningful extremes
Context-Aware Alerts: Band width provides volatility context helping traders adjust position sizing and stop placement
Reduced Whipsaws: During consolidations, narrower bands prevent premature signals from minor RSI movements
Responsiveness:
Adaptive Lag: Band calculation introduces some lag, but this lag is adaptive to current conditions rather than fixed
Faster Than Manual Adjustment: Automatic band adjustment is faster than trader's ability to manually modify thresholds
Balanced Approach: Combines RSI's inherent momentum lag with BB's statistical smoothing for stable yet responsive signals
Versatility:
Multi-Strategy Application: Supports both mean reversion (ranging markets) and trend continuation (trending markets) approaches
Universal Instrument Coverage: Works effectively across equities, forex, commodities, cryptocurrencies without parameter changes
Timeframe Agnostic: Same interpretation applies from 1-minute charts to monthly charts
Limitations and Considerations:
Known Limitations:
Dual Lag Effect: Combines RSI's momentum lag with BB's statistical lag, making it less suitable for very short-term scalping
Requires Volatility History: Needs sufficient bars for BB calculation, less effective immediately after major regime changes
Statistical Assumptions: Assumes RSI values are somewhat normally distributed, extreme trending conditions may violate this
Not a Standalone System: Like all indicators, should be combined with price action analysis and risk management
Optimal Use Cases:
Best for swing trading and position trading timeframes
Most effective in markets with alternating volatility regimes
Ideal for traders who use multiple instruments and timeframes
Suitable for systematic trading approaches requiring consistent logic
Suboptimal Conditions:
Very low timeframes (< 5 minutes) where lag becomes problematic
Instruments with extreme volatility spikes (gap-prone markets)
Markets in strong persistent trends where mean reversion rarely occurs
Periods immediately following major structural changes (new trading regime)
USAGE NOTES
This indicator is designed for technical analysis and educational purposes to help traders understand the interaction between momentum measurement and statistical volatility bands. The RSI Bollinger Bands has limitations and should not be used as the sole basis for trading decisions.
Important Considerations:
No Predictive Guarantee: Past band touches and patterns do not guarantee future price behavior
Market Regime Dependency: Indicator performance varies significantly between trending and ranging market conditions
Complementary Analysis Required: Should be used alongside price action, support/resistance levels, and fundamental analysis
Risk Management Essential: Always use proper position sizing, stop losses, and risk controls regardless of signal quality
Parameter Sensitivity: Different instruments and timeframes may require parameter optimization for optimal results
Continuous Monitoring: Band characteristics change with market conditions, requiring ongoing assessment
Recommended Supporting Analysis:
Price structure analysis (support/resistance, trend lines)
Volume confirmation for breakout signals
Multiple timeframe alignment
Market context awareness (news events, session times)
Correlation analysis with related instruments
The indicator aims to provide adaptive momentum analysis that adjusts to changing market volatility, but traders must apply sound judgment, proper risk management, and comprehensive market analysis in their decision-making process.

(5m) EMA Cross + RSI + Stoch + ATR Strategy Psammodromus1979Indicators
EMA4
EMA9
EMA20
EMA50
RSI
STOCHASTIC
ATR
With buy/sell indicators directly on main chart
It worked for me when waited for retracement on EMA50
Didn't work when on accumulation.
Simple RSIThis script is just a fun little project I decided to do. It serves as a way for me to practice my coding and was not made with the intent of making money.

RSI Donchian Channel [DCAUT]█ RSI Donchian Channel
📊 ORIGINALITY & INNOVATION
The RSI Donchian Channel represents an important synthesis of two complementary analytical frameworks: momentum oscillators and breakout detection systems. This indicator addresses a common limitation in traditional RSI analysis by replacing fixed overbought/oversold thresholds with adaptive zones derived from historical RSI extremes.
Key Enhancement:
Traditional RSI analysis relies on static threshold levels (typically 30/70), which may not adequately reflect changing market volatility regimes. This indicator adapts the reference zones dynamically based on the actual RSI behavior over the lookback period, helping traders identify meaningful momentum extremes relative to recent price action rather than arbitrary fixed levels.
The implementation combines the proven momentum measurement capabilities of RSI with Donchian Channel's breakout detection methodology, creating a framework that identifies both momentum exhaustion points and potential continuation signals through the same analytical lens.
📐 MATHEMATICAL FOUNDATION
Core Calculation Process:
Step 1: RSI Calculation
The Relative Strength Index measures momentum by comparing the magnitude of recent gains to recent losses:
Calculate price changes between consecutive periods
Separate positive changes (gains) from negative changes (losses)
Apply selected smoothing method (RMA standard, also supports SMA, EMA, WMA) to both gain and loss series
Compute Relative Strength (RS) as the ratio of smoothed gains to smoothed losses
Transform RS into bounded 0-100 scale using the formula: RSI = 100 - (100 / (1 + RS))
Step 2: Donchian Channel Application
The Donchian Channel identifies the highest and lowest RSI values within the specified lookback period:
Upper Channel: Highest RSI value over the lookback period, represents the recent momentum peak
Lower Channel: Lowest RSI value over the lookback period, represents the recent momentum trough
Middle Channel (Basis): Average of upper and lower channels, serves as equilibrium reference
Channel Width Dynamics:
The distance between upper and lower channels reflects RSI volatility. Wide channels indicate high momentum variability, while narrow channels suggest momentum consolidation and potential breakout preparation. The indicator monitors channel width over a 100-period window to identify squeeze conditions that often precede significant momentum shifts.
📊 COMPREHENSIVE SIGNAL ANALYSIS
Primary Signal Categories:
Breakout Signals:
Upper Breakout: RSI crosses above the upper channel, indicates momentum reaching new relative highs and potential trend continuation, particularly significant when accompanied by price confirmation
Lower Breakout: RSI crosses below the lower channel, suggests momentum reaching new relative lows and potential trend exhaustion or reversal setup
Breakout strength is enhanced when the channel is narrow prior to the breakout, indicating a transition from consolidation to directional movement
Mean Reversion Signals:
Upper Touch Without Breakout: RSI reaches the upper channel but fails to break through, may indicate momentum exhaustion and potential reversal opportunity
Lower Touch Without Breakout: RSI reaches the lower channel without breakdown, suggests potential bounce as momentum reaches oversold extremes
Return to Basis: RSI moving back toward the middle channel after touching extremes signals momentum normalization
Trend Strength Assessment:
Sustained Upper Channel Riding: RSI consistently remains near or above the upper channel during strong uptrends, indicates persistent bullish momentum
Sustained Lower Channel Riding: RSI stays near or below the lower channel during strong downtrends, reflects persistent bearish pressure
Basis Line Position: RSI position relative to the middle channel helps identify the prevailing momentum bias
Channel Compression Patterns:
Squeeze Detection: Channel width narrowing to 100-period lows indicates momentum consolidation, often precedes significant directional moves
Expansion Phase: Channel widening after a squeeze confirms the initiation of a new momentum regime
Persistent Narrow Channels: Extended periods of tight channels suggest market indecision and accumulation/distribution phases
🎯 STRATEGIC APPLICATIONS
Trend Continuation Strategy:
This approach focuses on identifying and trading momentum breakouts that confirm established trends:
Identify the prevailing price trend using higher timeframe analysis or trend-following indicators
Wait for RSI to break above the upper channel in uptrends (or below the lower channel in downtrends)
Enter positions in the direction of the breakout when price action confirms the momentum shift
Place protective stops below the recent swing low (long positions) or above swing high (short positions)
Target profit levels based on prior swing extremes or use trailing stops to capture extended moves
Exit when RSI crosses back through the basis line in the opposite direction
Mean Reversion Strategy:
This method capitalizes on momentum extremes and subsequent corrections toward equilibrium:
Monitor for RSI reaching the upper or lower channel boundaries
Look for rejection signals (price reversal patterns, volume divergence) when RSI touches the channels
Enter counter-trend positions when RSI begins moving back toward the basis line
Use the basis line as the initial profit target for mean reversion trades
Implement tight stops beyond the channel extremes to limit risk on failed reversals
Scale out of positions as RSI approaches the basis line and closes the position when RSI crosses the basis
Breakout Preparation Strategy:
This approach positions traders ahead of potential volatility expansion from consolidation phases:
Identify squeeze conditions when channel width reaches 100-period lows
Monitor price action for consolidation patterns (triangles, rectangles, flags) during the squeeze
Prepare conditional orders for breakouts in both directions from the consolidation
Enter positions when RSI breaks out of the narrow channel with expanding width
Use the channel width expansion as a confirmation signal for the breakout's validity
Manage risk with stops just inside the opposite channel boundary
Multi-Timeframe Confluence Strategy:
Combining RSI Donchian Channel analysis across multiple timeframes can improve signal reliability:
Identify the primary trend direction using a higher timeframe RSI Donchian Channel (e.g., daily or weekly)
Use a lower timeframe (e.g., 4-hour or hourly) to time precise entry points
Enter long positions when both timeframes show RSI above their respective basis lines
Enter short positions when both timeframes show RSI below their respective basis lines
Avoid trades when timeframes provide conflicting signals (e.g., higher timeframe below basis, lower timeframe above)
Exit when the higher timeframe RSI crosses its basis line in the opposite direction
Risk Management Guidelines:
Effective risk management is essential for all RSI Donchian Channel strategies:
Position Sizing: Calculate position sizes based on the distance between entry point and stop loss, limiting risk to 1-2% of capital per trade
Stop Loss Placement: For breakout trades, place stops just inside the opposite channel boundary; for mean reversion trades, use stops beyond the channel extremes
Profit Targets: Use the basis line as a minimum target for mean reversion trades; for trend trades, target prior swing extremes or use trailing stops
Channel Width Context: Increase position sizes during narrow channels (lower volatility) and reduce sizes during wide channels (higher volatility)
Correlation Awareness: Monitor correlations between traded instruments to avoid over-concentration in similar setups
📋 DETAILED PARAMETER CONFIGURATION
RSI Source:
Defines the price data series used for RSI calculation:
Close (Default): Standard choice providing end-of-period momentum assessment, suitable for most trading styles and timeframes
High-Low Average (HL2): Reduces the impact of closing auction dynamics, useful for markets with significant end-of-day volatility
High-Low-Close Average (HLC3): Provides a more balanced view incorporating the entire period's range
Open-High-Low-Close Average (OHLC4): Offers the most comprehensive price representation, helpful for identifying overall period sentiment
Strategy Consideration: Use Close for end-of-period signals, HL2 or HLC3 for intraday volatility reduction, OHLC4 for capturing full period dynamics
RSI Length:
Controls the number of periods used for RSI calculation:
Short Periods (5-9): Highly responsive to recent price changes, produces more frequent signals with increased false signal risk, suitable for short-term trading and volatile markets
Standard Period (14): Widely accepted default balancing responsiveness with stability, appropriate for swing trading and intermediate-term analysis
Long Periods (21-28): Produces smoother RSI with fewer signals but more reliable trend identification, better for position trading and reducing noise in choppy markets
Optimization Approach: Test different lengths against historical data for your specific market and timeframe, consider using longer periods in ranging markets and shorter periods in trending markets
RSI MA Type:
Determines the smoothing method applied to price changes in RSI calculation:
RMA (Relative Moving Average - Default): Wilder's original smoothing method providing stable momentum measurement with gradual response to changes, maintains consistency with classical RSI interpretation
SMA (Simple Moving Average): Treats all periods equally, responds more quickly to changes than RMA but may produce more whipsaws in volatile conditions
EMA (Exponential Moving Average): Weights recent periods more heavily, increases responsiveness at the cost of potential noise, suitable for traders prioritizing early signal generation
WMA (Weighted Moving Average): Applies linear weighting favoring recent data, offers a middle ground between SMA and EMA responsiveness
Selection Guidance: Maintain RMA for consistency with traditional RSI analysis, use EMA or WMA for more responsive signals in fast-moving markets, apply SMA for maximum simplicity and transparency
DC Length:
Specifies the lookback period for Donchian Channel calculation on RSI values:
Short Periods (10-14): Creates tight channels that adapt quickly to changing momentum conditions, generates more frequent trading signals but increases sensitivity to short-term RSI fluctuations
Standard Period (20): Balances channel responsiveness with stability, aligns with traditional Bollinger Bands and moving average periods, suitable for most trading styles
Long Periods (30-50): Produces wider, more stable channels that better represent sustained momentum extremes, reduces signal frequency while improving reliability, appropriate for position traders and higher timeframes
Calibration Strategy: Match DC length to your trading timeframe (shorter for day trading, longer for swing trading), test channel width behavior during different market regimes, consider using adaptive periods that adjust to volatility conditions
Market Adaptation: Use shorter DC lengths in trending markets to capture momentum shifts earlier, apply longer periods in ranging markets to filter noise and focus on significant extremes
Parameter Combination Recommendations:
Scalping/Day Trading: RSI Length 5-9, DC Length 10-14, EMA or WMA smoothing for maximum responsiveness
Swing Trading: RSI Length 14, DC Length 20, RMA smoothing for balanced analysis (default configuration)
Position Trading: RSI Length 21-28, DC Length 30-50, RMA or SMA smoothing for stable signals
High Volatility Markets: Longer RSI periods (21+) with standard DC length (20) to reduce noise
Low Volatility Markets: Standard RSI length (14) with shorter DC length (10-14) to capture subtle momentum shifts
📈 PERFORMANCE ANALYSIS & COMPETITIVE ADVANTAGES
Adaptive Threshold Mechanism:
Unlike traditional RSI analysis with fixed 30/70 thresholds, this indicator's Donchian Channel approach provides several improvements:
Context-Aware Extremes: Overbought/oversold levels adjust automatically based on recent momentum behavior rather than arbitrary fixed values
Volatility Adaptation: In low volatility periods, channels narrow to reflect tighter momentum ranges; in high volatility, channels widen appropriately
Market Regime Recognition: The indicator implicitly adapts to different market conditions without manual threshold adjustments
False Signal Reduction: Adaptive channels help reduce premature reversal signals that often occur with fixed thresholds during strong trends
Signal Quality Characteristics:
The indicator's dual-purpose design provides distinct advantages for different trading objectives:
Breakout Trading: Channel boundaries offer clear, objective breakout levels that update dynamically, eliminating the ambiguity of when momentum becomes "too high" or "too low"
Mean Reversion: The basis line provides a natural profit target for reversion trades, representing the midpoint of recent momentum extremes
Trend Strength: Persistent channel boundary riding offers an objective measure of trend strength without additional indicators
Consolidation Detection: Channel width analysis provides early warning of potential volatility expansion from compression phases
Comparative Analysis:
When compared to traditional RSI implementations and other momentum frameworks:
vs. Fixed Threshold RSI: Provides market-adaptive reference levels rather than static values, helping to reduce false signals during trending markets where RSI can remain "overbought" or "oversold" for extended periods
vs. RSI Bollinger Bands: Offers clearer breakout signals and more intuitive extreme identification through actual high/low boundaries rather than statistical standard deviations
vs. Stochastic Oscillator: Maintains RSI's momentum measurement advantages (unbounded calculation avoiding scale compression) while adding the breakout detection capabilities of Donchian Channels
vs. Standard Donchian Channels: Applies breakout methodology to momentum space rather than price, providing earlier signals of potential trend changes before price breakouts occur
Performance Characteristics:
The indicator exhibits specific behavioral patterns across different market conditions:
Trending Markets: Excels at identifying momentum continuation through channel breakouts, RSI tends to ride one channel boundary during strong trends, providing trend confirmation
Ranging Markets: Channel width narrows during consolidation, offering early preparation signals for potential breakout trading opportunities
High Volatility: Channels widen to reflect increased momentum variability, automatically adjusting signal sensitivity to match market conditions
Low Volatility: Channels contract, making the indicator more sensitive to subtle momentum shifts that may be significant in calm market environments
Transition Periods: Channel squeezes often precede major trend changes, offering advance warning of potential regime shifts
Limitations and Considerations:
Users should be aware of certain operational characteristics:
Lookback Dependency: Channel boundaries depend entirely on the lookback period, meaning the indicator has no predictive element beyond identifying current momentum relative to recent history
Lag Characteristics: As with all moving average-based indicators, RSI calculation introduces lag, and channel boundaries update only as new extremes occur within the lookback window
Range-Bound Sensitivity: In extremely tight ranges, channels may become very narrow, potentially generating excessive signals from minor momentum fluctuations
Trending Persistence: During very strong trends, RSI may remain at channel extremes for extended periods, requiring patience for mean reversion setups or commitment to trend-following approaches
No Absolute Levels: Unlike traditional RSI, this indicator provides no fixed reference points (like 50), making it less suitable for strategies that depend on absolute momentum readings
USAGE NOTES
This indicator is designed for technical analysis and educational purposes to help traders understand momentum dynamics and identify potential trading opportunities. The RSI Donchian Channel has limitations and should not be used as the sole basis for trading decisions.
Important considerations:
Performance varies significantly across different market conditions, timeframes, and instruments
Historical signal patterns do not guarantee future results, as market behavior continuously evolves
Effective use requires understanding of both RSI momentum principles and Donchian Channel breakout concepts
Risk management practices (stop losses, position sizing, diversification) are essential for any trading application
Consider combining with additional analytical tools such as volume analysis, price action patterns, or trend indicators for confirmation
Backtest thoroughly on your specific instruments and timeframes before live trading implementation
Be aware that optimization on historical data may lead to curve-fitting and poor forward performance
The indicator performs best when used as part of a comprehensive trading methodology that incorporates multiple forms of market analysis, sound risk management, and realistic expectations about win rates and drawdowns.

MILLION MEN - Peaks & Dips MeterWhat it is
The MILLION MEN — Peaks & Dips Meter is a dynamic momentum visualization tool designed to identify extreme strength and exhaustion zones. It uses two selectable engines:
RSI Meter (ZS Core) for classic strength analysis.
OB/OS Multi-Length (ZS Quick Core) for adaptive readings that reflect multi-period sentiment shifts.
How it works
The script computes normalized momentum values (0–100) from price dynamics, builds a smooth gradient representation, and displays it as a fixed right-bottom table. The meter color scales between fuchsia and green, with optional candle coloring and percentage labels.
It can also highlight overbought (peaks) and oversold (dips) moments directly on candles with adjustable ATR offsets and label styles.
How to use
Values near 90–100% → potential short-term exhaustion (watch for reversals).
Values near 0–10% → potential accumulation zones (possible bounces).
Use together with structure, volume, or trend filters for confirmation.
Originality
Unlike standard RSI tools, this script merges multi-length OB/OS detection with a real-time visual meter, optimized for scalpers and visual traders. It does not repaint and maintains a lightweight structure for fast responsiveness.
Limitations
This indicator is for analysis purposes only and should not be considered financial advice. Past readings do not guarantee future performance.

RSI Zones + Swing Divergences + OB/OS zones By HappyRsi with + divergences/ convergences + OB/OS zones
hidden bull/bear
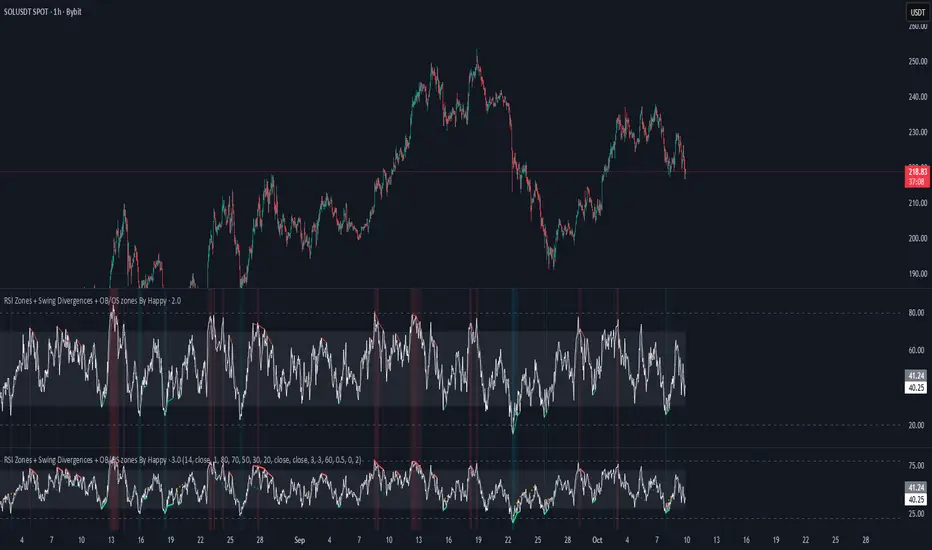
🐬RSI_CandleRSI_Candle
Calculates the RSI based on the open, high, low, and close prices, and displays it in the form of candles.
The overbought and oversold zones are highlighted with background colors, which become darker as the RSI value approaches 100 or 0.
-----
RSI_Candle
RSI를 시가, 고가, 저가, 종가로 계산하여 캔들로 보여줍니다.
과매수/과매도 구간에서 배경색으로 보여주며, 100/0에 가까울수록 배경색이 짙어집니다.
-----

🐬Stochastic_RSIStochastic RSI
The indicator highlights the chart background for two specific signals:
- A bearish deadcross occurring above the upper band.
- A bullish goldencross occurring below the lower band.
-----
스토캐스틱 RSI
두가지 신호를 배경색으로 나타냅니다.
- 어퍼 밴드 위에서의 데드크로스
- 로우어 밴드 아래에서의 골든크로스
-----
