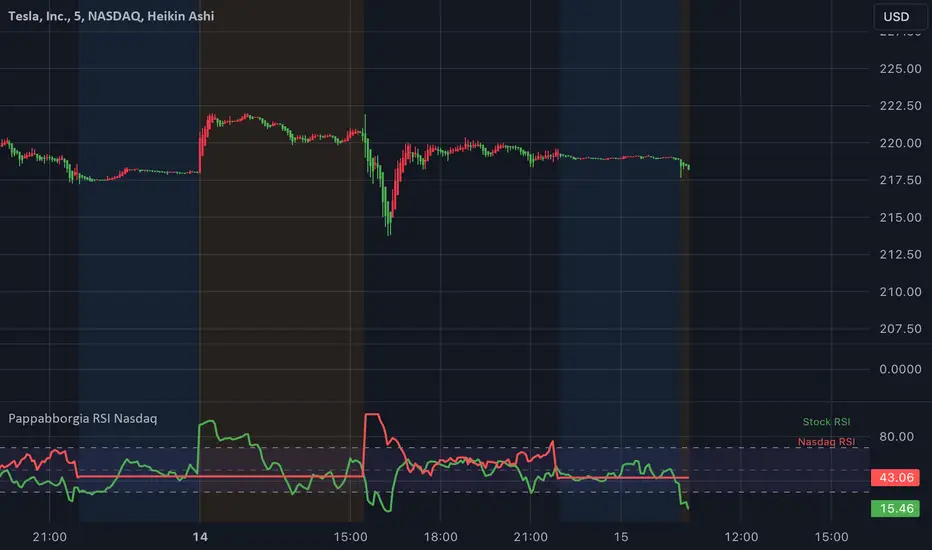
Pappabborgia Nasdaq RSI This script provides a custom Relative Strength Index (RSI) indicator that plots both the RSI of the selected stock and the Nasdaq (IXIC) on the same chart.
It offers a clear, side-by-side view to help traders better understand the stock's momentum relative to the overall market.
Key Features:
RSI Calculation for the Stock:
The script calculates the RSI for the chosen stock, with a default period of 14, adjustable to fit different timeframes.
The stock’s RSI is displayed in green 🟢, providing a direct view of its strength and momentum 📈.
RSI of the Nasdaq:
The script fetches the Nasdaq’s closing prices and calculates its RSI, which is shown in red for clear comparison 🔴.
Legend for Clarity:
A simple legend in the top-right corner identifies the green line as the stock’s RSI and the red line as the Nasdaq’s RSI, making it easy to interpret 📊.
Why Comparing the Stock's RSI to the Nasdaq Matters:
Broader Market Context:
Viewing both RSIs on the same chart helps you see whether the stock is moving in sync with the broader market or behaving independently. This provides valuable context for decision-making 📉.
Relative Strength Insights:
Comparing the stock’s RSI to the Nasdaq’s RSI highlights whether the stock is outperforming or underperforming the overall market, helping identify potential opportunities or risks 🟢🔴.
Improved Risk Management:
Monitoring overbought or oversold conditions in both the stock and Nasdaq RSIs can signal broader market trends and help avoid risky trades ⚠️.
Overall Benefit:
By tracking the RSI of both the stock and the Nasdaq, this script offers a powerful tool for understanding a stock's relative strength, providing essential context for smarter trading decisions 🎯.
相對強弱指標(RSI)
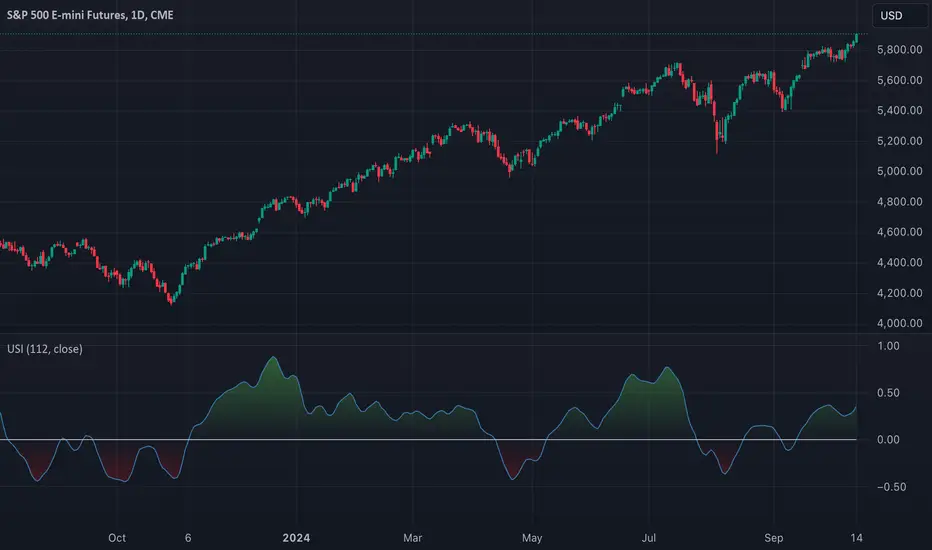
TASC 2024.11 Ultimate Strength Index█ OVERVIEW
This script implements the Ultimate Strength Index (USI) indicator, introduced by John Ehlers in his article titled "Ultimate Strength Index (USI)" from the November 2024 edition of TASC's Traders' Tips . The USI is a modified version of Wilder's original Relative Strength Index (RSI) that incorporates Ehlers' UltimateSmoother lowpass filter to produce an output with significantly reduced lag.
█ CONCEPTS
Many technical indicators, including the RSI, lag due to their heavy reliance on historical data. John Ehlers reformulated the RSI to substantially reduce lag by applying his UltimateSmoother filter to upward movements ( strength up - SU ) and downward movements ( strength down - SD ) in the time series, replacing the standard process of smoothing changes with rolling moving averages (RMAs). Ehlers' recent works, covered in our recent script publications, have shown that the UltimateSmoother is an effective alternative to other classic averages, offering notably less lag in its response.
Ehlers also modified the RSI formula to produce an index that ranges from -1 to +1 instead of 0 to 100. As a result, the USI indicates bullish conditions when its value moves above 0 and bearish conditions when it falls below 0.
The USI retains many of the strengths of the traditional RSI while offering the advantage of reduced lag. It generally uses a larger lookback window than the conventional RSI to achieve similar behavior, making it suitable for trend trading with longer data lengths. When applied with shorter lengths, the USI's peaks and valleys tend to align closely with significant turning points in the time series, making it a potentially helpful tool for timing swing trades.
█ CALCULATIONS
The first step in the USI's calculation is determining each bar's strength up (SU) and strength down (SD) values. If the current bar's close exceeds the previous bar's, the calculation assigns the difference to SU. Otherwise, SU is zero. Likewise, if the current bar's close is below the previous bar's, it assigns the difference to SD. Otherwise, SD is zero.
Next, instead of the RSI's typical smoothing process, the USI's calculation applies the UltimateSmoother to the short-term average SU and SD values, reducing high-frequency chop in the series with low lag.
Finally, this formula determines the USI value:
USI = ( Ult (SU) − Ult (SD)) / ( Ult (SU) + Ult (SD)),
where Ult (SU) and Ult (SD) are the smoothed average strength up and strength down values.
OutperformX VCPSwingDesigned to measure and visualize the relative strength and outperformance of a stock compared to a benchmark. Here’s a feature-by-feature breakdown
Credits to Eeshan for all the help
—————-
Alpha Calculation: What's it About?
The key component of this indicator is the Alpha calculation, which measures a stock's outperformance relative to a base index (e.g., Nifty Midsmall 400) while accounting for risk-free returns. By comparing the stock's performance with the base and risk-free rates, we get the Alpha.
The Alpha logic has been slightly modified, not strictly following the textbook approach
——————
Customizable Inputs: Tailored for You
You can choose whether to display Alpha.
Change the Base Index (e.g., NiftyMidsmall400).
Adjust the Performance Period (Days) for custom Alpha/Outperformance calculations.
Performance options range from 5 to 252 days, helping to fine-tune the outperformance tracking.
—————
Highlighting Performance Peaks: Short-Term & Long-Term
The indicator automatically highlights Short-Term Peak Performance over customizable short-term windows (e.g., 21 days).
It also detects Long-Term Performance Peaks, spanning up to 52 weeks. These peaks are represented as dots on the Alpha line.
——————
Color-Coded Alpha: Clear Visuals
To make the indicator visually intuitive:
Positive Alpha (outperformance) is marked in green.
Negative Alpha (underperformance) is shown in red. These are customizable so you can adjust colors to your preference!
—————
Outperformance Before Price Peaks
One cool feature is tracking whether Alpha outperforms before the price hits new highs. If Alpha breaks out but price lags, a “dot” is drawn, giving a heads-up on potential upcoming price moves.
——————
Background Color Highlighting
Background colors change dynamically based on performance:
Green for positive Alpha (outperformance).
Red for negative Alpha (underperformance). This gives a quick visual reference of the stock’s performance at a glance.
——————-
Filling the Alpha Zone
The indicator fills the area between the Alpha line and zero. This shading helps highlight the magnitude of outperformance (or underperformance) and provides a quick visual cue about trends.
———————
Get Started
With all these features combined, the Outperformance indicator becomes a powerful tool for spotting leading stocks, tracking risk-adjusted performance, and identifying performance peaks before price catches up.

Z-Score Pairs TradingTitle: Z-Score Pairs Trading Indicator
Description:
This indicator implements a Z-score based pairs trading strategy, allowing traders to identify potential statistical arbitrage opportunities between two selected assets.
Key Features:
- Calculates Z-score for the price difference between any two user-selected symbols
- Visualizes Z-score with customizable thresholds for signals
- Generates long and short signals based on extreme Z-score values
- Adaptable to various markets including stocks, ETFs, and commodities
How It Works:
1. The indicator calculates the price difference between two selected symbols.
2. It then computes the Z-score of this difference, showing how far the current spread deviates from its historical average.
3. When the Z-score exceeds set thresholds (default ±2), the indicator generates trading signals.
Settings:
- Symbol A and Symbol B: Select any two tradable symbols to compare
- Lookback Period: Number of periods for calculating the moving average and standard deviation
Interpretation:
- Z-score above 2: Potential short signal (pair is likely overextended)
- Z-score below -2: Potential long signal (pair is likely oversold)
- Z-score between -2 and 2: Normal trading range, no signals
Visual Aids:
- Blue line: Z-score
- Dashed lines: Threshold levels at 0, ±1, and ±2
- Green triangles: Long signals
- Red triangles: Short signals
Disclaimer:
This indicator is for educational and research purposes only. Trading carries a high level of risk. Always conduct your own analysis and manage your risk appropriately before entering any trade.
Made by @marekfleisi

Fear Greed Zones by Relative Strength IndexThis is a visual modification of the relative Strength Index (RSI) to express extreme areas as fear and greed Zones.
// Input
rsiLength = input.int(14, "RSI Length", minval=1)
// RSI calculation
rsi = ta.rsi(close, rsiLength)
FEAR GREED ZONES
The "Fear Greed Zones Script" indicator is designed to help traders identify psychological levels of fear and greed in the market by utilising relative strength index. It primarily utilises the Relative Strength Index of price to gauge market sentiment, with the following key features:
Color-Codes
Dark Red: Indicates a greed zone , suggesting extreme overbought conditions (high risk) and a possible price reversal downward.
Dark Green: Represents a fear zone, indicating extreme oversold conditions (low risk) and potential for price reversal upward.
Yellow: Serves as a neutral zone with medium risk.
Usage
Market Sentiment Analysis: Traders can use the fear and greed zones to assess overall market sentiment, aligning their strategies with prevailing emotional biases. This helps in identifying potential entry and exit points based on market psychology.
Risk Management: Understanding fear or greed influences market behavior and allows traders to manage their risk more effectively with the knowledge of high or low risk areas; as they can anticipate potential reversals or continuations in price trends.
Conclusion
The "Fear Greed Zones" Script is a valuable tool for traders looking to leverage market psychology. By clearly identifying areas where fear or greed may be influencing price movements, it aids in making more informed trading decisions.

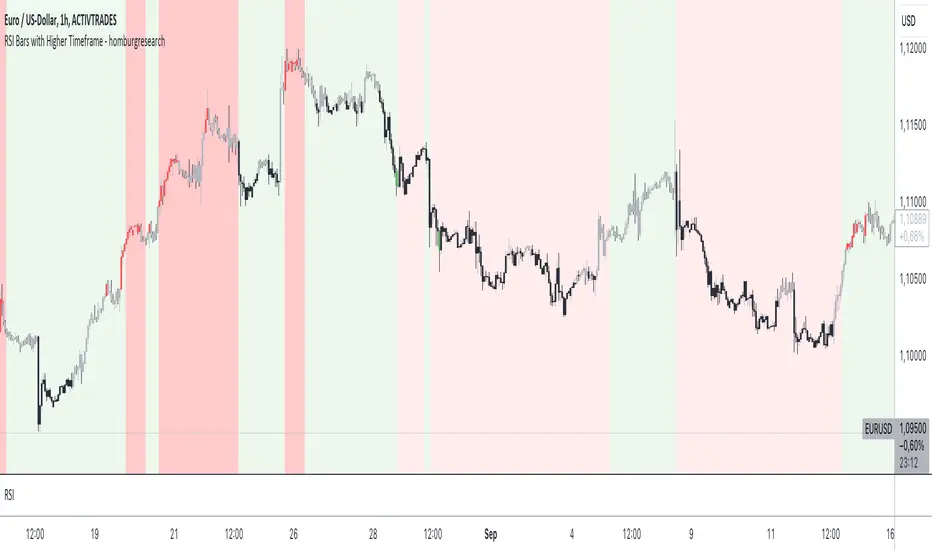
RSI Bars with Higher Timeframe - homburgresearchThe "RSI Bars with Higher Timeframe - homburgresearch" indicator is an advanced tool designed to provide traders with visual cues about overbought, oversold, and trend-related market conditions based on the Relative Strength Index (RSI). This version also includes an analysis of higher timeframes to enhance decision-making and provide a more comprehensive view of market trends.
Indicator Features:
The indicator colors the bars according to the RSI value and considers conditions on both the current and higher timeframes. A bullish trend is represented by gray bars when the RSI is above the 50 level, while a bearish trend is represented by black bars when the RSI is below the 50 level.
The indicator also offers coloring to highlight extreme overbought or oversold conditions. Extremely overbought areas (e.g., RSI > 80) are marked in red and may indicate particularly risky market conditions. Extremely oversold areas (e.g., RSI < 20) are marked in green and indicate potentially very attractive buying opportunities.
In addition to bar coloring, the indicator allows for background coloring based on the RSI values of a higher timeframe chosen by the user. This background helps identify larger trends, with red and green shading representing bearish and bullish conditions, respectively. Additionally, extreme overbought and oversold conditions can also be represented as background, providing traders with even clearer signals for risky or attractive market conditions. This feature allows traders to better align their trading decisions with the broader market trend and adds another layer of analysis.
All parameters are individually adjustable, including the RSI length, thresholds for overbought/oversold conditions, colors for different market states, and the choice of a higher timeframe for background analysis.
The indicator provides alerts that notify you when the RSI reaches certain thresholds, ensuring that you do not miss important trading opportunities. Alerts can be set for entering the overbought zone, the oversold zone, or extreme overbought or oversold conditions.
Using the RSI Bars with Higher Timeframe Indicator:
RSI-based signals can be easily identified through the color-coded bars, helping you recognize when the market might be overbought or oversold. This information can be used for potential counter-movements in the market.
Gray bars indicate that the RSI is above the 50 level, suggesting a bullish trend. Black bars indicate that the RSI is below the 50 level, suggesting a bearish trend. This information helps you better assess the current market direction.
The highlighting of extreme overbought or oversold conditions helps identify overheated markets, which may indicate short-term reversals or a possible continuation. The background color provides context from a higher timeframe and helps traders understand the larger market trend and make more informed decisions.
The alerts keep you updated when the market reaches specific RSI conditions, allowing you to react without constantly monitoring the chart.
Examples of Use:
If the bars are marked in gray, this indicates a bullish trend. It may be advisable to look for long positions or hold existing positions.
If the bars are marked in black, this indicates a bearish trend. It may be advisable to consider short positions or reduce existing long positions.
If the bars are marked in red (overbought), it could be an opportunity to take profits or consider short positions.
If the bars are marked in green (oversold), it could be a good opportunity to look for long positions.
If the background is shaded in green, it indicates a broader bullish trend on the higher timeframe, suggesting that it may be better to align trades in that direction.
If the background is shaded in red, it indicates a broader bearish trend on the higher timeframe, signaling caution for long trades and favoring short trades.
The RSI Bars with Higher Timeframe indicator is particularly useful for traders who base their decisions on RSI signals and want to integrate a multi-timeframe approach into their trading strategy for more comprehensive market analysis.
Note: This indicator is for informational purposes only and does not constitute a buy or sell decision. Any trading decision should be based on your own analysis and consideration of your individual risk profile.
Momentum Nexus Oscillator [UAlgo]The "Momentum Nexus Oscillator " indicator is a comprehensive momentum-based tool designed to provide traders with visual cues on market conditions using multiple oscillators. By combining four popular technical indicators—RSI (Relative Strength Index), VZO (Volume Zone Oscillator), MFI (Money Flow Index), and CCI (Commodity Channel Index)—this heatmap offers a holistic view of the market's momentum.
The indicator plots two lines: one representing the current chart’s combined momentum score and the other representing a higher timeframe’s (HTF) score, if enabled. Through smooth gradient color transitions and easy-to-read signals, the Momentum Nexus Heatmap allows traders to easily identify potential trend reversals or continuation patterns.
Traders can use this tool to detect overbought or oversold conditions, helping them anticipate possible long or short trade opportunities. The option to use a higher timeframe enhances the flexibility of the indicator for longer-term trend analysis.
🔶 Key Features
Multi-Oscillator Approach: Combines four popular momentum oscillators (RSI, VZO, MFI, and CCI) to generate a weighted score, providing a comprehensive picture of market momentum.
Dynamic Color Heatmap: Utilizes a smooth gradient transition between bullish and bearish colors, reflecting market momentum across different thresholds.
Higher Timeframe (HTF) Compatibility: Includes an optional higher timeframe input that displays a separate score line based on the same momentum metrics, allowing for multi-timeframe analysis.
Customizable Parameters: Adjustable RSI, VZO, MFI, and CCI lengths, as well as overbought and oversold levels, to match the trader’s strategy or preference.
Signal Alerts: Built-in alert conditions for both the current chart and higher timeframe scores, notifying traders when long or short entry signals are triggered.
Buy/Sell Signals: Displays visual signals (▲ and ▼) on the chart when combined scores reach overbought or oversold levels, providing clear entry cues.
User-Friendly Visualization: The heatmap is separated into four sections representing each indicator, providing a transparent view of how each contributes to the overall momentum score.
🔶 Interpreting Indicator:
Combined Score
The indicator generates a combined score by weighing the individual contributions of RSI, VZO, MFI, and CCI. This score ranges from 0 to 100 and is plotted as a line on the chart. Lower values suggest potential oversold conditions, while higher values indicate overbought conditions.
Color Heatmap
The indicator divides the combined score into four distinct sections, each representing one of the underlying momentum oscillators (RSI, VZO, MFI, and CCI). Bullish (greenish) colors indicate upward momentum, while bearish (grayish) colors suggest downward momentum.
Long/Short Signals
When the combined score drops below the oversold threshold (default is 26), a long signal (▲) is displayed on the chart, indicating a potential buying opportunity.
When the combined score exceeds the overbought threshold (default is 74), a short signal (▼) is shown, signaling a potential sell or short opportunity.
Higher Timeframe Analysis
If enabled, the indicator also plots a line representing the combined score for a higher timeframe. This can be used to align lower timeframe trades with the broader trend of a higher timeframe, providing added confirmation.
Signals for long and short entries are also plotted for the higher timeframe when its combined score reaches overbought or oversold levels.
🔶Purpose of Using Multiple Technical Indicators
The combination of RSI, VZO, MFI, and CCI in the Momentum Nexus Heatmap provides a comprehensive approach to analyzing market momentum by leveraging the unique strengths of each indicator. This multi-indicator method minimizes the limitations of using just one tool, resulting in more reliable signals and a clearer understanding of market conditions.
RSI (Relative Strength Index)
RSI contributes by measuring the strength and speed of recent price movements. It helps identify overbought or oversold levels, signaling potential trend reversals or corrections. Its simplicity and effectiveness make it one of the most widely used indicators in technical analysis, contributing to momentum assessment in a straightforward manner.
VZO (Volume Zone Oscillator)
VZO adds the critical element of volume to the analysis. By assessing whether price movements are supported by significant volume, VZO distinguishes between price changes that are driven by real market conviction and those that might be short-lived. It helps validate the strength of a trend or alert the trader to potential weakness when price moves are unsupported by volume.
MFI (Money Flow Index)
MFI enhances the analysis by combining price and volume to gauge money flow into and out of an asset. This indicator provides insight into the participation of large players in the market, showing if money is pouring into or exiting the asset. MFI acts as a volume-weighted version of RSI, giving more weight to volume shifts and helping traders understand the sustainability of price trends.
CCI (Commodity Channel Index)
CCI contributes by measuring how far the price deviates from its statistical average. This helps in identifying extreme conditions where the market might be overextended in either direction. CCI is especially useful for spotting trend reversals or continuations, particularly during market extremes, and for identifying divergence signals.
🔶 Disclaimer
Use with Caution: This indicator is provided for educational and informational purposes only and should not be considered as financial advice. Users should exercise caution and perform their own analysis before making trading decisions based on the indicator's signals.
Not Financial Advice: The information provided by this indicator does not constitute financial advice, and the creator (UAlgo) shall not be held responsible for any trading losses incurred as a result of using this indicator.
Backtesting Recommended: Traders are encouraged to backtest the indicator thoroughly on historical data before using it in live trading to assess its performance and suitability for their trading strategies.
Risk Management: Trading involves inherent risks, and users should implement proper risk management strategies, including but not limited to stop-loss orders and position sizing, to mitigate potential losses.
No Guarantees: The accuracy and reliability of the indicator's signals cannot be guaranteed, as they are based on historical price data and past performance may not be indicative of future results.

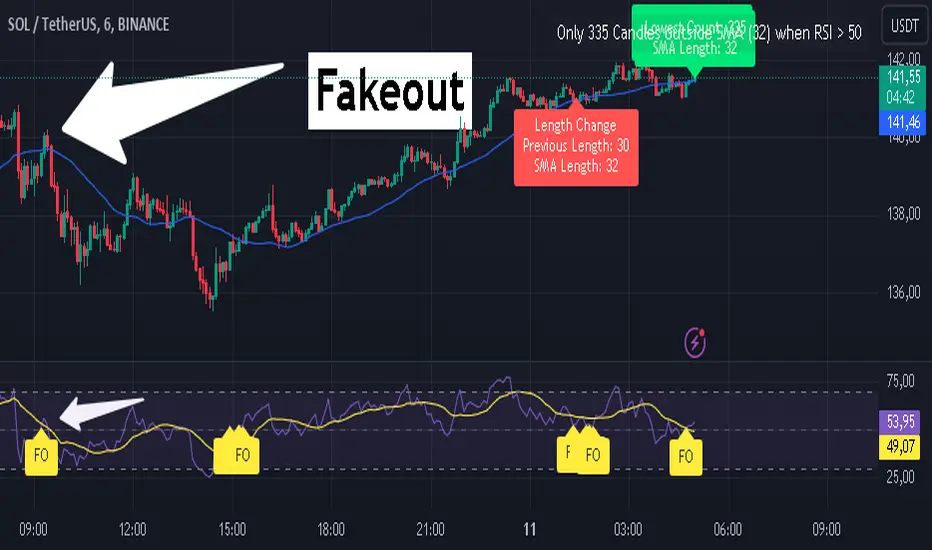
RSI Fakeout Filter with SMA Confirmation [CHE] Introducing: RSI Fakeout Detection
Are you tired of being caught in fakeouts that can lead to frustrating losses? The RSI Fakeout Detection is here to enhance your trading strategy by filtering out false signals and providing you with more reliable entries. This innovative indicator is designed to help traders identify when market momentum, as indicated by the RSI, does not align with price movement – a key indicator of potential fakeouts!
What Does It Do?
The RSI Fakeout Detection focuses on one key goal: avoiding false signals. By monitoring when the RSI exceeds a customizable threshold (indicating strength) but the price remains below a moving average like the SMA, this indicator highlights situations where the market may seem strong, but the price action doesn't support that momentum. In other words, it saves you from those tricky fake breakouts.
Key Benefits:
1. Reduce Risk, Increase Confidence: Get an extra layer of protection against fakeouts by receiving signals only when both RSI and price confirm the market's true direction. Avoid entering false breakouts and trade with more confidence.
2. Dynamic Analysis of SMA Lengths: It doesn’t just rely on one SMA. The indicator automatically analyzes and sorts through different SMA lengths to find the most reliable one for your specific market condition, ensuring that you get the best possible signal.
3. Tailored for You: With customizable RSI thresholds, a choice of multiple moving average types (SMA, EMA, Bollinger Bands, and more), and vibrant color-coded visuals, this tool is built to fit your unique trading style and preferences.
4. Spot Fakeouts with Ease: Visual cues make it easy to see when the market might be tricking you. Labels, plotted lines, and a toggleable disclaimer keep everything transparent and easy to understand.
5. Friendly and Intuitive: Whether you’re new to trading or a seasoned pro, the RSI Fakeout Detection is designed to be simple and effective. The labels and plots are clear, the alerts are timely, and it seamlessly integrates into your chart without cluttering it.
Why Choose RSI Fakeout Detection?
- Accuracy and Precision: By combining RSI and SMA analysis, this indicator minimizes the risk of following false trends and entering trades too early.
- Save Time and Reduce Guesswork: No more spending hours trying to figure out which SMA length works best – the RSI Fakeout Detection does it for you!
- Peace of Mind: Avoiding fakeouts means fewer bad trades, which can lead to more consistent performance and less stress.
Transform the way you trade, and step into a more confident trading future with RSI Fakeout Detection . Whether you’re day trading or swing trading, this tool will give you an edge by helping you filter out the noise and make more informed decisions.
Best regards,
Chervolino
Disclaimer:
The content provided, including all code and materials, is strictly for educational and informational purposes only. It is not intended as, and should not be interpreted as, financial advice, a recommendation to buy or sell any financial instrument, or an offer of any financial product or service. All strategies, tools, and examples discussed are provided for illustrative purposes to demonstrate coding techniques and the functionality of Pine Script within a trading context.
Any results from strategies or tools provided are hypothetical, and past performance is not indicative of future results. Trading and investing involve high risk, including the potential loss of principal, and may not be suitable for all individuals. Before making any trading decisions, please consult with a qualified financial professional to understand the risks involved.
By using this script, you acknowledge and agree that any trading decisions are made solely at your discretion and risk.
Smart Momentum Relative StrengthSmart Momentum Relative Strength
Creator Journey
The Smart Momentum Relative Strength indicator is
created by Vishal R. Janjire , inspired by BharatTrader sir, and parameters guided by mentor stockedge founder Vivek Bajaj sir.
Reason? ...Why choose Smart Momentum Relative Strength.
1.Simple to Trade: This indicator simplifies trading decisions. You just need to follow the background color displayed on the chart. When the background is green, it signals a bullish trend, and when it turns red, it signals a bearish trend. For an even cleaner experience, you can untick the Relative Strength (RS) toggle in the indicator settings and focus purely on trading based on these background colors, making the process straightforward and efficient.
2.Unlock the power to compare any stock, share, commodity, forex or cryptocurrency against major indices like Nasdaq Composite, NYSE Composite, Bitcoin, NG, Gold, Silver, Crude oil, Nasdaq-100, Nifty 50, Hang Seng Index, FTSE 100, and many more! With the Comparative Relative Strength (RS) indicator,
You can easily change the default Nifty 50 comparative symbol to any index or asset of your choice, such as Gold, Silver, Crude Oil, or global benchmarks like the Dow Jones Industrial Average, DAX, Euronext 100, and SSE Composite.
This versatile tool allows traders to measure how well a base symbol (e.g., stock or crypto) performs relative to a chosen benchmark over a specified period. Whether you're analyzing the relative strength of Bitcoin against the Nasdaq-100 or comparing stocks to the S&P 500, this indicator provides valuable insights into market trends and outperforming assets.
The Smart Momentum Relative Strength combines several advanced technical analysis tools into one comprehensive Pine Script indicator designed to provide a nuanced view of market strength and trends. This script integrates Relative Strength (RS), Commodity Channel Index (CCI), and additional trend confirmation mechanisms to deliver actionable insights for traders.
Below are key points to understand before using this indicator:
Important Parameters:
1. Green Line: Represents stocks outperforming the comparative index, which is Nifty 50. However, do not apply this result directly to Nifty 50 itself, as it will not work exclusively on the Nifty 50 index.
2. Red Line: Indicates that the stock is underperforming relative to the Nifty 50 index.
3. Green Background: Signifies that both the current time momentum and higher time momentum are aligned, indicating an upward trend.
4. Red Background: Signifies that both the current time momentum and higher time momentum are aligned, indicating a downward trend.
5. Blank Space: This occurs when the two timeframes are not aligned, indicating market uncertainty and signaling a potential change in market direction, it means short time frame or current time frame changed its direction to opposite side.
Multi-Time Frame (MTF) Settings:
This indicator incorporates a default multi-time frame setup, as follows:
1 and 2 Minute chart = 5 Minute higher time frame
3 Minute chart = 15 Minute higher time frame
5 Minute chart = 15 Minute higher time frame
10 Minute chart = 60 Minute higher time frame
15 Minute chart = 60 Minute higher time frame
20 and 30 Minute chart = 120 Minute higher time frame
1 Hour chart = 4 Hour higher time frame
2 Hour chart = 4 Hour higher time frame
4 Hour chart = 1 Day higher time frame
1 Day chart = 1 Week higher time frame
1 Week chart = 1 Month higher time frame
1 Month chart = 12 Month higher time frame
For any other chart time frame = Day time is default time frame
1. Relative Strength (RS) Analysis:
Calculation: Measures the performance of the base symbol relative to a comparative symbol over a specified period.
Visualization: The RS value is plotted with color-coded lines to indicate bullish (green) or bearish (red) conditions based on crossovers. Users can customize the color based on value or trend direction.
Trend Analysis: A simple moving average (SMA) of RS is displayed to visualize trend strength and direction, with color changes to reflect rising or falling trends.
2. Commodity Channel Index (CCI):
- Current Timeframe CCI: Calculates the CCI for the current timeframe to assess price momentum.
- Higher Timeframe CCI: Computes the CCI for a higher timeframe to provide a broader market perspective.
- Background Color: Highlights the chart background in green or red based on whether both current and higher timeframe CCIs are above or below zero, respectively.
-Blank Space: This occurs when the two timeframes are not aligned, indicating market uncertainty and signaling a potential change in market direction, it means short time frame or current time frame changed its direction to opposite side.

Divergence Indicator Multi [TradingFinder] MACD AO RSI DIV Chart🔵 Introduction
🟣 What is Divergence in Financial Markets?
Divergence in technical analysis happens when the price of a stock moves in a direction opposite to certain indicators. This is a crucial concept in financial markets as it can signal either a trend reversal or a continuation of the current correction in the trend. Understanding divergence helps traders and analysts make more informed decisions.
🟣 Positive Regular Divergence (RD+)
A positive regular divergence occurs at the end of a downtrend, where two price lows form. This divergence appears when the price chart shows a new low, but the indicator does not follow, signaling potential buying opportunities.
Positive divergence indicates increased buying pressure and reduced selling pressure, making it a useful signal for forecasting price increases.
🟣 Negative Regular Divergence (RD-)
A negative regular divergence is seen during an uptrend when two price highs form. The price chart records a new high, but the indicator does not reflect this change, suggesting that a market downturn is likely.
This type of divergence shows strong selling pressure and weaker buying activity, which can help identify selling opportunities.
Both positive and negative divergences are powerful tools for identifying potential trend reversals and key support and resistance levels. For example, when an indicator trends upward while the price moves downward, this creates divergence, warning traders to reconsider their investment strategy.
🟣 Different Types of Divergence in Trading
1. Regular Divergence :
o Positive Regular Divergence (RD+)
o Negative Regular Divergence (RD-)
2. Hidden Divergence :
o Positive Hidden Divergence (HD+)
o Negative Hidden Divergence (HD-)
3.Time Divergence.
Note : This guide focuses specifically on Regular Divergence.
🟣 What is Regular Divergence?
Regular Divergence, often referred to as convergence, occurs when price action and indicators show conflicting patterns, usually signaling the end of a trend. Detecting regular divergence helps traders anticipate potential trend reversals or the formation of reversal patterns.
🔵 How to Use
To optimize the detection of divergence, you can adjust the Fractal Period to specify the length of time for identifying divergence patterns.
Additionally, with the Divergence Detection Method, you can select oscillators like the MACD, RSI, or AO to base divergence detection on.
Divergence in MACD :
MACD divergence occurs when the price chart forms an opposite pattern compared to the MACD line, indicating a potential price reversal.
Divergence in RSI :
In a downtrend, if the price chart forms two consecutive lows with the second lower than the first, but the RSI shows two lows with the second higher, this indicates positive regular divergence, which is a buy signal.
On the other hand, during an uptrend, if the price forms two highs with the second higher than the first, but the RSI shows the second high lower, this points to negative regular divergence, indicating a sell signal.
Divergence in AO (Awesome Oscillator) :
The AO indicator calculates histograms using the difference between 5-period and 34-period simple moving averages. It compares peaks and troughs of these histograms with price movements, detecting divergence and plotting lines and arrows to signal divergence.
🔵 Table
The following table breaks down the main features of the oscillator. It covers four critical categories: Exist, Consecutive, Divergence Quality, and Change Phase Indicator.
Exist : If divergence is detected, a "+" will appear in this row.
Consecutive: Shows the number of consecutive divergences that have formed in a short period.
Divergence Quality : Evaluates the quality of the divergence based on the number of occurrences. One is labeled "Normal," two are "Good," and three or more are considered "Strong."
Change Phase Indicator : If a phase change is detected between two oscillation peaks, this is marked in the table.

Simple RSI stock Strategy [1D] The "Simple RSI Stock Strategy " is designed to long-term traders. Strategy uses a daily time frame to capitalize on signals generated by the Relative Strength Index (RSI) and the Simple Moving Average (SMA). This strategy is suitable for low-leverage trading environments and focuses on identifying potential buy opportunities when the market is oversold, while incorporating strong risk management with both dynamic and static Stop Loss mechanisms.
This strategy is recommended for use with a relatively small amount of capital and is best applied by diversifying across multiple stocks in a strong uptrend, particularly in the S&P 500 stock market. It is specifically designed for equities, and may not perform well in other markets such as commodities, forex, or cryptocurrencies, where different market dynamics and volatility patterns apply.
Indicators Used in the Strategy:
1. RSI (Relative Strength Index):
- The RSI is a momentum oscillator used to identify overbought and oversold conditions in the market.
- This strategy enters long positions when the RSI drops below the oversold level (default: 30), indicating a potential buying opportunity.
- It focuses on oversold conditions but uses a filter (SMA 200) to ensure trades are only made in the context of an overall uptrend.
2. SMA 200 (Simple Moving Average):
- The 200-period SMA serves as a trend filter, ensuring that trades are only executed when the price is above the SMA, signaling a bullish market.
- This filter helps to avoid entering trades in a downtrend, thereby reducing the risk of holding positions in a declining market.
3. ATR (Average True Range):
- The ATR is used to measure market volatility and is instrumental in setting the Stop Loss.
- By multiplying the ATR value by a custom multiplier (default: 1.5), the strategy dynamically adjusts the Stop Loss level based on market volatility, allowing for flexibility in risk management.
How the Strategy Works:
Entry Signals:
The strategy opens long positions when RSI indicates that the market is oversold (below 30), and the price is above the 200-period SMA. This ensures that the strategy buys into potential market bottoms within the context of a long-term uptrend.
Take Profit Levels:
The strategy defines three distinct Take Profit (TP) levels:
TP 1: A 5% from the entry price.
TP 2: A 10% from the entry price.
TP 3: A 15% from the entry price.
As each TP level is reached, the strategy closes portions of the position to secure profits: 33% of the position is closed at TP 1, 66% at TP 2, and 100% at TP 3.
Visualizing Target Points:
The strategy provides visual feedback by plotting plotshapes at each Take Profit level (TP 1, TP 2, TP 3). This allows traders to easily see the target profit levels on the chart, making it easier to monitor and manage positions as they approach key profit-taking areas.
Stop Loss Mechanism:
The strategy uses a dual Stop Loss system to effectively manage risk:
ATR Trailing Stop: This dynamic Stop Loss adjusts based on the ATR value and trails the price as the position moves in the trader’s favor. If a price reversal occurs and the market begins to trend downward, the trailing stop closes the position, locking in gains or minimizing losses.
Basic Stop Loss: Additionally, a fixed Stop Loss is set at 25%, limiting potential losses. This basic Stop Loss serves as a safeguard, automatically closing the position if the price drops 25% from the entry point. This higher Stop Loss is designed specifically for low-leverage trading, allowing more room for market fluctuations without prematurely closing positions.
to determine the level of stop loss and target point I used a piece of code by RafaelZioni, here is the script from which a piece of code was taken
Together, these mechanisms ensure that the strategy dynamically manages risk while offering robust protection against significant losses in case of sharp market downturns.
The position size has been estimated by me at 75% of the total capital. For optimal capital allocation, a recommended value based on the Kelly Criterion, which is calculated to be 59.13% of the total capital per trade, can also be considered.
Enjoy !

Relative Strength Index Custom [BRTLab]RSI Custom — Strategy-Oriented RSI with Multi-Timeframe Precision
The Relative Strength Index Custom is designed with a focus on developing robust trading strategies. This powerful indicator leverages the logic of calculating RSI on higher timeframes (HTFs) while allowing traders to execute trades on lower timeframes (LTFs). Its unique ability to extract accurate RSI data from higher timeframes without waiting for those candles to close provides a real-time advantage, eliminating the "look-ahead" bias that often
distorts backtest results.
Key Features
Multi-Timeframe RSI for Strategy Development
This indicator stands out by allowing you to calculate RSI on higher timeframes, even while operating on lower timeframe charts. This means you can, for example, calculate RSI on the 1-hour or daily chart and execute trades on a 1-minute chart without needing to wait for the higher timeframe candle to close. This feature is crucial for strategy-building as it eliminates backtesting issues where data from the future is inadvertently used, providing more reliable backtest results.
Example: On a 15-minute chart, you can use the 1-hour RSI to open positions based on higher timeframe momentum, but you get this signal in real-time, improving timing and accuracy.
Accurate Data Extraction from Higher Timeframes
The indicator's custom logic ensures that accurate RSI data is retrieved from higher timeframes, providing an edge by delivering timely information for lower timeframe decisions. This prevents delayed signals often encountered when waiting for higher timeframe candles to close, which is crucial for high-frequency and intraday traders looking for precise entries based on multi-timeframe data.
Customizable RSI Settings for Strategy Tuning
The script offers full customization of the RSI, including length and source price (close, open, high, or low), allowing traders to tailor the RSI to fit specific trading strategies. These settings are housed in the "RSI Settings" section, enabling precise adjustments that align with your overall strategy.
No Future-Looking in Backtests
Traditional backtests often suffer from "future-looking" bias, where calculations unintentionally use data from candles that haven’t yet closed. This indicator is specifically designed to prevent such issues by calculating RSI values in real-time. This is particularly important when creating and testing strategies, as it ensures that the conditions under which trades would have been made are accurately represented in historical tests.
RSI-Based Moving Average for Additional Filtering
The built-in moving average (MA) based on RSI values helps filter out noise, making it easier to identify genuine trend shifts. This is particularly useful in strategies where moving average crossovers act as additional confirmation for trade entries and exits.
Overbought and Oversold Zone Detection
Visual gradient fills on the RSI chart help traders identify overbought and oversold zones (above 70 and below 30, respectively). These zones are crucial for timing reversal trades or confirming momentum-based strategies.
How This Indicator Enhances Your Strategy
Increased Accuracy for Intraday Strategies
For traders who operate on lower timeframes, using higher timeframe RSI data gives a broader perspective of market momentum while still maintaining precision for short-term trade entries. The real-time data extraction means you don't need to wait for HTF candles to close, which can dramatically improve your entry timing.
Strategic Edge in Backtesting
One of the greatest challenges in backtesting strategies is avoiding future-looking bias. This indicator is built to overcome this by using real-time multi-timeframe data, ensuring the accuracy and reliability of historical strategy testing, which provides confidence in your strategies when applied to live markets.
Advanced Filtering for Trend Strategies
By combining the RSI values with a customizable moving average (MA) and visualizing key momentum zones with overbought/oversold fills, the indicator allows for more refined trade filters. This ensures that signals generated by your strategy are based on solid momentum data and not short-term price fluctuations.

Cubic Bezier Curve RSI [CBCR]Overview :
Introducing the Cubic Bézier Curve RSI – an innovative approach to smoothing the traditional RSI using cubic Bézier curves. This indicator provides traders with a smoother, adaptive version of the RSI that can help filter out noise and better highlight market trends.
Key Features:
Bézier Curve : the script uses cubic Bézier curves to create a smoothed version of the RSI, offering a more visually appealing and potentially more insightful representation of market momentum.
Customizable Settings: Users can adjust the Bézier Curve Length, Impact Factor, and color modes, allowing full customization of the smoothing effect and visualization.
Color-coded Trend Indicator: The smoothed RSI is displayed with colors that indicate potential bullish or bearish trends, helping traders quickly assess market conditions.
Overbought/Oversold Lines: Option to display overbought and oversold levels for better identification of market extremes.
Parameters:
RSI Length: Set the length for the traditional RSI calculation (default is 14).
Bézier Curve Length: Adjust the length of the Bézier curve used to smooth the RSI (default is 20).
Impact Factor: Control the influence of the Bézier smoothed values versus the original RSI values (default is 0.5, ranging from 0.0 to 1.0).
Overbought/Oversold Lines: Option to show overbought (default: 70) and oversold (default: 30) lines for easier identification of extreme conditions.
Color Mode: Choose between "Trend Following" and "Overbought/Oversold" modes for line color indication.
Display Settings: Color customization for bullish and bearish phases allows better visual differentiation.
How It Works:
The CBCR uses four control points derived from historical RSI values over a user-defined length. It then applies the cubic Bezier formula to generate a sequence of points representing a smoothed version of the RSI over this range.
The Bezier curve is recalculated each time a specific number of bars (as defined by the Bezier Curve Length) have passed, helping reduce noise while retaining key trend information.
The result is a smoothed RSI that combines the adaptability of cubic Bezier curves with the familiar oscillation of the RSI, making it potentially more robust for identifying shifts in market sentiment.
Visuals:
Smoothed RSI Line: Plotted on the indicator pane, the line changes color depending on the chosen color mode:
Trend Following Mode: Color changes based on whether the smoothed RSI is above or below the 50-level.
Overbought/Oversold Mode: Color changes based on whether the smoothed RSI is above the overbought level or below the oversold level.
Bullish Color: Configurable (default: cyan).
Bearish Color: Configurable (default: red).
Overbought/Oversold Lines: Horizontal lines at user-defined levels (default: 70 for overbought, 30 for oversold) for easy identification of market extremes.
Usage:
The CBCR can be used like a traditional RSI but with a smoother output that may help traders avoid false signals generated by sudden price spikes. For instance:
Look for crossovers around the 50 level as a signal for changing momentum.
Use the overbought and oversold levels to identify potential reversal zones.
Observe the color change of the line for an immediate visual cue on current sentiment.
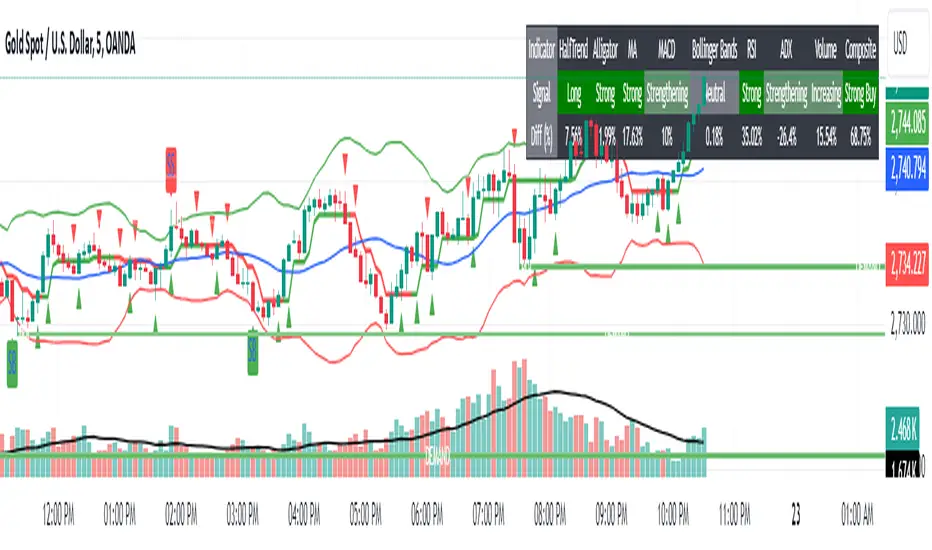
Options Series - Index Analysis [MasterPiece]
Powerful Insights 🚀:
This script utilizes multiple technical indicators to provide a comprehensive view of stock trends, which increases the reliability of trading signals.
This script also designed to perform index and stock analysis by comparing price movements to moving averages (MA20) and volume-weighted average price (VWAP).
By analyzing a set of top-weighted stocks within an index, the script offers a macro-level view while also delivering stock-specific insights. This dual focus enhances its utility for traders who need to understand both individual stock movements and broader market dynamics.
⭐ Originality: The script presents a unique fusion of multiple indicators with a data-driven approach to analyzing top-weighted stocks in major indices like Nifty and BankNifty. The integration of widely-used technical analysis tools, such as exponential and simple moving averages (EMA, SMA), volume-weighted average price (VWAP), and volume-body size comparisons, offers a holistic framework for traders. By focusing on the top five stocks in the indices, it leverages weightage-based performance analysis, adding a strategic dimension to index trading. This approach not only evaluates individual stock performance but also synthesizes broader market trends.
⭐ Usefulness: This script serves traders who seek a multi-dimensional method for analyzing both index and stock performance. Its key features include:
Bullish and Bearish Signals: The relationship between price, moving averages (MA20), and VWAP identifies directional trends, generating buy/sell signals for both individual stocks and the overall index.
Volume and Candle Body Analysis: By comparing candle body size with volume, the script provides deeper insights into trend strength and market conviction. This allows traders to gauge whether price movements are supported by sufficient trading volume.
Customization: Users have the flexibility to input specific index and stock symbols, making the script adaptable for different markets and instruments beyond just Nifty and BankNifty.
Signal Overlay: The ability to overlay bar color and volume signals directly on the price chart ensures better trend visualization, offering clear and immediate visual cues for potential trading setups.
⭐ Justification for Mashup: The combination of multiple indicators is logical and complementary. Each component serves a distinct purpose that enhances the overall system:
Trend Identification: Moving averages and VWAP provide insights into short and long-term trends, giving traders a reliable baseline for price direction.
Conviction: The inclusion of volume and candle body size comparisons gives additional weight to price action, allowing traders to confirm whether a trend is backed by meaningful market activity.
⭐ Color Customization for Enhanced Visualization:
The script defines custom colors for various conditions and candles, improving clarity for bullish and bearish trends.
Green for Bullish: Dark green for regular bullish candles, and fluorescent green for stronger bullish signals.
Red for Bearish: Dark red for regular bearish candles, and fluorescent red for stronger bearish signals.
Neutral Conditions: Fluorescent yellow is used for neutral conditions.
⭐ Index and Top Stocks Analysis:
This section analyzes top-weighted stocks for indices ( NSE:NIFTY and NSE:BANKNIFTY ), with NSE:BANKNIFTY being used as the default.
Top Stocks for NSE:NIFTY : HDFCBANK, ICICIBANK, RELIANCE, INFY, ITC.
Top Stocks for NSE:BANKNIFTY : HDFCBANK, ICICIBANK, KOTAKBANK, AXISBANK, SBIN.
Customizable Input: Users can modify the index and stock symbols via input.symbol.
⭐ Signal Generation Based on MA20 and VWAP:
The conditions for bullish or bearish signals are based on the relationship between the stock's close price, MA20, and VWAP.
Bullish Signal: Close price greater than both MA20 and VWAP.
Bearish Signal: Close price less than both MA20 and VWAP.
⭐ Volume Bar Signal for Market Activity:
The script analyzes candle body size and volume to detect significant market movements.
Body Size and Volume Comparison: It checks if the current candle’s body size or volume is greater than the moving average of body size or volume over the past 74 bars.
Green Candle (GC) and Red Candle (RC): Boolean conditions to track whether the close price is higher or lower than the open price.
⭐ Average Signals for Strong Trends:
The script calculates average bullish or bearish signals based on the majority of candles being green or red and significant body size or volume.
Bullish Average Signal: At least 4 out of 6 stocks exhibit bullish conditions (green candles, large bodies, or high volume).
Bearish Average Signal: Similar logic for bearish signals with red candles.
⭐ Overlay of Volume Bar Signals:
The plotshape function overlays the bullish and bearish volume bar signals on the chart, using color and shape to indicate trend changes.
🚀 Conclusion:
This Pine Script code provides a robust framework for index analysis based on top 5 weighted stocks, using two primary indicators—MA20 (20-period Moving Average) and VWAP (Volume Weighted Average Price).
Market Bias Identification: The script identifies bullish and bearish conditions for each stock based on whether the close price is above or below MA20 and VWAP.
Volume and Body Size Comparison: It checks if the current candle’s body size or volume exceeds the average to determine significant market moves.
Visualization with Color & Signals: It overlays color signals for bullish (fluorescent green) and bearish (fluorescent red) markets and provides triangle markers for strong volume-based signals.
Top Stock Analysis: The script provides analysis of top five weighted stocks in the selected index, enhancing precision for broader index analysis.

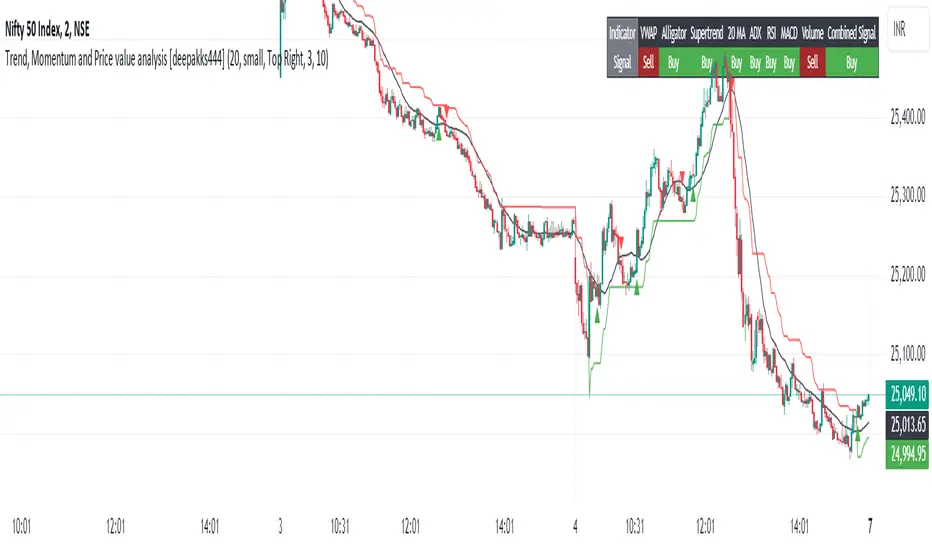
Trend, Momentum and Price value analysis [deepakks444]Trend, Momentum, and Price Value Analysis
This indicator combines several key technical analysis tools to help traders evaluate the market's trend strength, momentum, and overall price behavior. It uses a variety of signals to generate a "Buy," "Sell," or "No Clear Indication" based on multiple indicators and plots them directly on the chart. A customizable table also summarizes these signals, making it easy to interpret the market conditions in real-time.
Key Features:
VWAP (Volume-Weighted Average Price): Indicates whether the price is above or below the VWAP line, helping to identify buying or selling opportunities based on fair value.
Alligator Indicator: Utilizes three simple moving averages (SMAs) to track trend direction, providing a clear "Buy" or "Sell" signal when the averages are aligned.
Supertrend: A widely-used trend-following indicator, this script identifies potential buy or sell zones based on the price's relationship with the Supertrend line.
20-period Moving Average (MA): A simple moving average to track the overall trend direction. The signal is based on the price crossing above or below the MA.
ADX (Average Directional Index): Measures the strength of the trend. A reading above 25 indicates a "Buy" signal, while a reading below suggests a "Sell."
RSI (Relative Strength Index): Generates a buy signal when RSI exceeds 60 and a sell signal when it drops below 40. Values between 40 and 60 indicate a neutral condition.
MACD (Moving Average Convergence Divergence): Provides a signal for buying when the MACD line crosses above the signal line, and selling when it crosses below.
Volume Signal: Compares current volume against the 20-period moving average to identify significant volume spikes. This helps in determining if the market is supported by strong volume.
Customization Options:
Moving Average Length: Customize the 20-period MA length to better fit your trading style or the asset you’re analyzing.
Supertrend Settings: Adjust the Supertrend factor and ATR period for different timeframes or volatility environments.
Table Position: Customize where the signal table is displayed on the chart (Top Right, Top Left, Bottom Right, or Bottom Left).
Table Appearance: Set the table background color and choose between small or tiny text size for better readability.
Signal Summary:
The indicator computes a combined signal based on the number of "Buy" or "Sell" signals from the individual indicators. If 5 or more indicators suggest a "Buy" or "Sell," the table will display a combined signal for easier decision-making. This feature consolidates the signals into one straightforward output, helping you filter noise and act on clear trends.
Table Display:
The customizable table organizes the signals of the key indicators, showing:
Indicator: Lists all the indicators in use, such as VWAP, Alligator, Supertrend, etc.
Signal: Displays "Buy," "Sell," or "Neutral" for each indicator based on the current market conditions.
Intended Use:
This script is designed to help traders monitor multiple technical indicators at once, giving them a clearer view of the market’s trend strength, momentum, and volatility. While it simplifies the process of interpreting various signals, users should use it in combination with their own research and risk management strategies.
Disclaimer: This script is for educational purposes only and should not be considered financial advice. All trading involves risk, and the performance of an indicator in the past does not guarantee future results. Always perform due diligence and use proper risk management techniques.
3 days ago
Release Notes
A "Buy" triangle is plotted below the bar if the signal changes to "Buy".
A "Sell" triangle is plotted above the bar if the signal changes to "Sell".
Script Name: Trend, Momentum, and Price Value Analysis
The Trend, Momentum, and Price Value Analysis script provides a multi-faceted approach to market analysis, combining several technical indicators into a single tool. This script offers an easy-to-interpret table summarizing various indicator signals, along with visual buy/sell signals on the chart.
Key Features:
VWAP (Volume Weighted Average Price):
The VWAP provides insights into whether the current price is above or below the average weighted price, helping traders identify potential buy or sell opportunities.
Alligator Indicator (Simplified):
Using three simple moving averages (SMAs), this tool helps identify the beginning of trends and potential buy/sell zones based on the Alligator jaw, teeth, and lips.
Supertrend:
A trend-following indicator that determines whether the market is in a bullish or bearish phase based on ATR and factor inputs. The Supertrend line is plotted on the chart.
20-period Moving Average (MA):
A basic moving average that assists in gauging price direction and the overall trend.
ADX (Average Directional Index):
Helps identify the strength of a trend. A value above 25 indicates a strong trend.
RSI (Relative Strength Index):
Measures momentum by identifying overbought and oversold conditions. A signal is triggered when RSI is above 60 (buy) or below 40 (sell).
MACD (Moving Average Convergence Divergence):
A momentum indicator that provides signals when the MACD line crosses the signal line.
Volume Signal:
Compares the current volume with a 20-period average to determine if volume supports the current trend direction.
Signal Table:
A table is generated on the chart, displaying real-time signals from each of the above indicators. The table is customizable with background colors and text sizes.
The position of the table can be set to any corner of the chart for convenience.
Combined Signal Logic:
The script calculates a Combined Signal based on the majority of buy or sell signals across all the indicators. If 5 or more indicators give a buy or sell signal, a combined signal is generated.
Buy/Sell Signal Plots:
The script plots buy (green triangle) and sell (red triangle) signals on the chart based on the combined signal when transitioning from a previous opposite signal.
Customizable Inputs:
Users can customize the length of the moving averages, adjust the background and text colors of the table, and choose the position of the table on the chart.
Gabriel's Cyclic Smoothed RSI [Enhanced]Overview
Gabriel's Cyclic Smoothed RSI (short title: cRSI ) is a sophisticated technical indicator developed to provide traders with deeper insights into market rhythms and price momentum. Building upon the traditional Relative Strength Index (RSI), this enhanced version incorporates dynamic cycle analysis, divergence detection, and optional stochastic oscillators to deliver a more nuanced understanding of market conditions.
Key Features
Cyclic Smoothed RSI (cRSI):
Adaptive Momentum: The cRSI adapts to the dominant market cycle, providing a smoothed RSI that reacts dynamically to price changes.
Ultra-Smooth & Zero-Lag: Designed to minimize lag, ensuring timely signals that closely follow price movements.
Accurate Divergence Detection: Identifies both regular and hidden bullish/bearish divergences, enhancing signal reliability.
Dynamic Overbought/Oversold Bands:
Customizable Thresholds: Set dynamic overbought and oversold levels based on market rhythm analysis.
Adaptive Bands: Bands adjust according to the dominant cycle, offering a more accurate representation of market extremes.
Stochastic cRSI & KDJ Oscillator (Optional):
Enhanced Oscillators: Incorporate stochastic and KDJ oscillators for additional momentum analysis.
Ribbon Displays: Visual ribbons provide clarity on oscillator trends and potential reversal points.
Divergence Detection:
Regular & Hidden Divergences: Detects both regular and hidden bullish/bearish divergences to anticipate potential trend reversals.
Customizable Lookback: Adjust pivot lookback periods to fine-tune divergence sensitivity.
Visual Enhancements:
Triangles & Labels: Visual signals in the form of triangles and labels indicate buy/sell opportunities and divergence events.
Bar Coloring: Option to color bars based on signal strength, providing immediate visual cues.
Alert Conditions:
Custom Alerts: Set up alerts for various signal types, including strong buy/sell signals and divergence events, ensuring you never miss critical market movements.
Input Settings
cRSI Settings
Source: Select the data source for calculations (e.g., Close, Open, High, Low, HLC3, OHLC4).
Dominant Cycle Length: Define the dominant market cycle length based on rhythm analysis.
Vibration: Adjusts the sensitivity of the cRSI to price changes.
Leveling %: Determines the percentage level for dynamic band adjustments.
Show cRSI Plot: Toggle the display of the cRSI line.
Show Cyclic Smoothed Bands: Toggle the display of dynamic overbought and oversold bands.
Show Trend Fill: Enable or disable the trend fill cloud between upper and lower bands.
MA Settings
MA Type: Choose the type of Moving Average (SMA, Bollinger Bands, EMA, SMMA (RMA), WMA, VWMA) to smooth the cRSI.
MA Length: Set the length of the Moving Average.
BB StdDev: Define the standard deviation multiplier for Bollinger Bands.
Show cRSI-based MA: Toggle the display of the cRSI-based Moving Average line.
Stochastic Settings
Show Stochastic cRSI: Enable the stochastic oscillator based on cRSI.
Ribbon: Enable ribbon display for the Stochastic oscillator.
Show KDJ: Toggle the display of the KDJ oscillator.
KDJ Ribbon: Enable ribbon display for the KDJ oscillator.
Stochastic Length: Set the length for the Stochastic calculation.
%K Smoothing: Define the smoothing period for %K.
%D Smoothing: Define the smoothing period for %D.
Stoch Scaling %: Adjusts the vertical scaling of the stochastic to prevent distortion.
Overbought/Oversold Settings
Overbought: Set the Overbought threshold for the cRSI.
OB Extreme: Define the Extreme Overbought threshold for the Stochastic cRSI.
Oversold: Set the Oversold threshold for the cRSI.
OS Extreme: Define the Extreme Oversold threshold for the Stochastic cRSI.
Divergence Settings
Pivot Lookback Right: Number of bars to the right of the pivot for divergence detection.
Pivot Lookback Left: Number of bars to the left of the pivot for divergence detection.
Max of Lookback Range: Maximum number of bars to look back for divergence detection.
Min of Lookback Range: Minimum number of bars to look back for divergence detection.
Plot Bullish: Enable plotting of bullish divergence signals.
Plot Hidden Bullish: Enable plotting of hidden bullish divergence signals.
Plot Bearish: Enable plotting of bearish divergence signals.
Plot Hidden Bearish: Enable plotting of hidden bearish divergence signals.
Delay Plot Until Candle is Closed: Prevents repainting by delaying the plotting of divergence signals until the candle is fully closed.

Gaussian RSI For Loop [TrendX_]The Gaussian RSI For Loop indicator is a sophisticated tool designed for trend-following traders seeking to identify strong uptrends in the market. By integrating a Gaussian and Weighted-MA (GWMA) with the Relative Strength Index (RSI), this indicator employs a loop-based scoring system to provide clear signals for potential trading opportunities. The combination of Gaussian smoothing techniques and overbought/oversold filtering enhances the indicator's ability to capture significant price movements while reducing noise, making it an optimal choice for traders aiming to capitalize on robust upward trends.
💎 KEY FEATURES
Gaussian Weighted Moving Average (GWMA): Smooths price data to reduce noise and enhance responsiveness to significant price changes.
Filtered RSI: Applies the RSI to Gaussian-filtered data, allowing for more accurate momentum readings.
Wavetrend Analysis: Calculates the difference between the Filtered RSI and its short-term moving average, providing additional insights into momentum shifts.
Loop-Based Scoring System: Evaluates the strength and direction of uptrends through a systematic analysis of the Filtered RSI against defined thresholds.
⚙️ USAGES
Identifying Strong Uptrends: Traders can use this indicator to pinpoint periods of strong upward momentum, helping them make informed decisions about entering long positions and its exits.
Trend and Signal Confirmation: The Score confirms Long and Exit signals which traders can see through the Dots on the Gaussian RSI.
🔎 BREAKDOWN
Gaussian-Filtered Data:
The first component of the Gaussian RSI For Loop is the application of a GWMA to the sourced price data. This smoothing technique uses weighted averages based on a Gaussian distribution, which emphasizes more recent prices while diminishing the impact of older prices. This GWMA effectively reduces market noise, allowing traders to focus on significant price movements. By adjusting weights using sigma parameters, traders can fine-tune the sensitivity of the indicator, making it more responsive to genuine market trends while filtering out minor fluctuations that could lead to misleading signals.
Filtered RSI:
Next, the RSI is applied to the Gaussian-filtered data. The RSI measures the speed and change of price movements, providing insights into overbought or oversold conditions. By applying the RSI to smoothed price data, traders obtain a clearer view of momentum without the distortion caused by sudden price spikes or drops. This results in more reliable readings that help identify potential trend reversals or continuations.
Wavetrend Analysis:
The Wavetrend component calculates the difference between the Filtered RSI and its short-term moving average (MA). This difference serves as an additional momentum indicator. When the Filtered RSI is above its short-term MA, it suggests that upward momentum is strengthening; conversely, when it falls below, it indicates weakening momentum. This analysis helps traders confirm whether an uptrend is gaining strength or losing traction.
Loop-Based Scoring System:
Range Analysis: The system evaluates the Filtered RSI by comparing its current value against overbought (OB) and oversold (OS) thresholds over a defined range. This systematic approach ensures that each value within this range contributes to understanding overall trend strength.
Score Calculation: As the loop iterates through values within the defined range, it adjusts a score based on whether the current Filtered RSI and its previous values are higher or lower than established OB and OS levels. This scoring mechanism quantifies trend strength and direction.
Strong Uptrend Trigger: A strong uptrend signal is generated when the score exceeds a predefined Score Threshold (Long). This indicates that bullish momentum is robust enough to warrant entry into long positions.
None Trend: Conversely, if the score falls below the Score Threshold (Short), it suggests that upward momentum has weakened significantly, signaling potential exit points and it can be consolidated or downtrend.
DISCLAIMER
This indicator is not financial advice, it can only help traders make better decisions. There are many factors and uncertainties that can affect the outcome of any endeavor, and no one can guarantee or predict with certainty what will occur. Therefore, one should always exercise caution and judgment when making decisions based on past performance.

Buy/Sell IndicatorBuy/Sell Indicator
Overview
The Buy/Sell Indicator is designed to help traders identify potential entry and exit points in the market using a combination of Simple Moving Averages (SMA) and the Relative Strength Index (RSI). This indicator plots buy and sell signals directly on the chart, making it easier to make informed trading decisions.
Inputs
Fast MA Length: The period for the fast-moving average. Default is 9.
Slow MA Length: The period for the slow-moving average. Default is 21.
RSI Length: The period for the RSI calculation. Default is 14.
RSI Overbought Level: The RSI level considered overbought. Default is 70.
RSI Oversold Level: The RSI level considered oversold. Default is 30.
How It Works
Moving Averages:
The indicator calculates two SMAs: a fast-moving average (fastMA) and a slow-moving average (slowMA).
The fast MA reacts more quickly to price changes, while the slow MA reacts more slowly.
RSI:
The RSI is calculated to measure the momentum of price movements.
It helps identify overbought and oversold conditions in the market.
Buy and Sell Conditions:
Buy Signal: A buy signal is generated when the fast MA crosses above the slow MA and the RSI is below the overbought level.
Sell Signal: A sell signal is generated when the fast MA crosses below the slow MA and the RSI is above the oversold level.
Plotting
Buy Signals: Displayed as green labels below the bars where the buy condition is met.
Sell Signals: Displayed as red labels above the bars where the sell condition is met.
Moving Averages: The fast MA is plotted in blue, and the slow MA is plotted in orange.

Trend, Momentum and Price value analysis Extended [deepakks444]Trend, Momentum, and Price Value Analysis Extended
This Pine Script™ indicator is designed to offer traders a comprehensive overview of price trends, momentum, and market strength through the use of several widely-recognized technical analysis tools. The indicator integrates multiple signals and plots directly on the chart, as well as a customizable table to help visually organize and interpret the data. Here’s an overview of the key features included:
Key Features:
VWAP (Volume-Weighted Average Price): Calculates the average price weighted by volume to give insight into whether the price is above or below the market's fair value.
Alligator Indicator: Uses a combination of three moving averages (jaw, teeth, and lips) to help identify trending conditions.
Supertrend: A trend-following indicator that signals potential buy or sell opportunities based on price movements relative to a dynamically calculated support/resistance line.
20-period Moving Average (MA): A basic moving average to smooth out price data and highlight the underlying trend.
MACD (Moving Average Convergence Divergence): Helps identify changes in the strength, direction, and momentum of a trend.
Volume with Moving Average: Compares current volume against its moving average to identify potential volume spikes.
RSI (Relative Strength Index): Measures the speed and change of price movements, signaling overbought or oversold conditions.
ADX (Average Directional Index): An indicator used to quantify trend strength, helping traders determine whether the market is trending or in a range.
Pivot Points: Calculates daily pivot points and identifies support and resistance levels based on price movements.
Bollinger Bands: A volatility indicator that uses standard deviation to highlight potential overbought or oversold conditions.
Customization Options:
Modify the length of the price and volume moving averages.
Adjust RSI thresholds for buy and sell signals.
Set the thresholds for ADX to differentiate between weak, average, and strong trends.
Toggle the visibility of the 20-period MA and Supertrend on the chart.
Choose to display the percentage difference between the current price and indicator values in the table.
Table Display:
The indicator includes a table that summarizes the status of all signals, showing:
Signal (Buy/Sell/Neutral): Based on each indicator's interpretation of price action.
Percentage Difference: Optional display of how far the price is from the reference level (e.g., the difference between the price and VWAP, Supertrend line, or Moving Average).
The table allows traders to quickly assess the current market conditions across several indicators in one place, making it easier to gauge overall market sentiment.
Signal Logic:
This indicator uses a scoring system to calculate the percentage of indicators signaling a buy or sell. If the buy or sell score reaches 70% or higher, the indicator will plot buy or sell signals on the chart. The combined signal logic is displayed in the table as "Buy," "Sell," or "No Signal," based on the majority of the contributing indicators.
Intended Use:
This tool is designed to assist traders in their technical analysis by consolidating multiple popular indicators into one script. It provides a clear visual representation of various market signals, helping traders to make informed decisions about potential trade entries and exits. However, this indicator is for educational purposes and should not be used as financial advice. Traders should always use proper risk management and conduct their own research before making any trading decisions.
Disclaimer: This script is for educational purposes only and does not constitute financial advice. Trading involves risk, and past performance of an indicator does not guarantee future results. Please use it alongside proper risk management practices.
RSI Pulsar [QuantraSystems]RSI Pulsar
Introduction
The RSI Pulsar is an advanced and multifaceted tool designed to cater to the varying needs of traders, from long-term swing traders to higher-frequency day traders. This indicator takes the Relative Strength Index (RSI) to new heights by combining several unique methodologies to provide clear, actionable signals across different market conditions. With its ability to analyze impulsive trend strength, volatility, and binary market direction, the RSI Pulsar offers a holistic view of the market that assists traders in identifying robust signals and rotational opportunities within a volatile market.
The integration of dynamic color coding further aids in quick visual assessments, allowing traders to adapt swiftly to changing market conditions, making the RSI Pulsar an essential component in the arsenal of modern traders aiming for precision and adaptability in their trading endeavors.
Legend
The RSI Pulsar encapsulates various modes tailored to diverse trading strategies. The different modes are the:
Impulse Mode:
Focuses on strong outperformance, ideal for capturing movements in highly dynamic tokens.
Trend Following Mode:
A classical perpetual trend-following approach and provides binary long and short signal classifications ideal for medium term swing trading.
Ribbon Mode:
Offers quicker signals that are also binary in nature. Perfect for a confirmation signal when building higher frequency day trading systems.
Volatility Spectrum:
This feature projects a visual 'cloud' representing volatility, which helps traders spot emerging trends and potential breakouts or reversals.
Compressed Mode:
A condensed view that displays all signals in a clean and space-efficient manner. It provides a clear summary of market conditions, ideal for traders who prefer a simplified overview.
Methodology
The RSI Pulsar is built on a foundation of dynamic RSI analysis, where the traditional RSI is enhanced with advanced moving averages and standard deviation calculations. Each mode within the RSI Pulsar is designed to cater to specific aspects of the market's behavior, making it a versatile tool allowing traders to select different modes based on their trading style and market conditions.
Impulse Mode:
This mode identifies strong outperformance in assets, making it ideal for asset rotation systems. It uses a combination of RSI thresholds and dynamic moving averages to pinpoint when an asset is not just trending positively, but doing so with significant strength.
This is in contrast to typical usage of a base RSI, where elevated levels usually signal overbought and oversold periods. The RSI Pulsar flips this logic, where more extreme values are actually interpreted as a strong trend.
Trend Following Mode:
Here, the RSI is compared to the midline (the default is level 50, but a dynamic midline can also be set), to determine the prevailing trend. This mode simplifies the trend-following process, providing clear bullish or bearish signals based on whether the RSI is above or below the midline - whether a fixed or dynamic level.
Ribbon Mode:
This mode employs a series of calculated values derived from modified Heikin-Ashi smoothing to create a "ribbon" that smooths out price action and highlights underlying trends. The Ribbon Mode is particularly useful for traders who need quick confirmations of trend reversals or continuations.
Volatility Spectrum:
The Volatility Spectrum takes a unique approach to measuring market volatility by analyzing the size and direction of Heikin-Ashi candles. This data is used to create a volatility cloud that helps traders identify when volatility is rising, falling, or neutral - allowing them to adjust their strategies accordingly.
When the signal line breaks above the cloud, it signals increasing upwards volatility. When it breaks below it signifies increasing downwards volatility.
This can be used to help identify strengthening and weakening trends, as well as imminent volatile periods, allowing traders to position themselves and adapt their strategies accordingly. This mode also works as a great volatility filter for shorter term day trading strategies. It is incredibly sensitive to volatility divergences, and can give additional insights to larger market turning points.
Compressed Mode:
In Compressed Mode, all the signals from the various modes are displayed in a simplified format, making it easy for traders to quickly assess the market's overall condition without needing to delve into the details of each mode individually. Perfect for only viewing the exact data you need when live trading, or back testing.
Case Study I:
Utilizing ALMA Impulse Mode in High-Volatility Environments
Here, the RSI Pulsar is configured with an RSI length of 9 and an ALMA length of 2 in Impulse Mode. The chart example shows how this setup can identify significant price movements, allowing traders to enter positions early and capture substantial price moves. Despite the fast settings resulting in occasional false signals, the indicator's ability to catch and ride out major trends more than compensates, making it highly effective in volatile environments.
This configuration is suitable for traders seeking to trade quick, aggressive movements without enduring prolonged drawdowns. In Impulse Mode, the RSI Pulsar seeks strong trending zones, providing actionable signals that allow for timely entries and exits.
Case Study II:
SMMA Trend Following Mode for Ratio Analysis
The RSI Pulsar in Trend Following mode, configured with the SMMA with default length settings. This setup is ideal for analyzing longer-term trends, particularly useful in cryptocurrency pairs or ratio charts, where it’s crucial to identify robust directional moves. The chart showcases strong trends in the Solana/Ethereum pair. The RSI Pulsar’s ability to smooth out price action while remaining responsive to trend changes makes it an excellent tool for capturing extended price moves.
The image highlights how the RSI Pulsar efficiently tracks the strength of two tokens against each other, providing clear signals when one asset begins to outperform the other. Even in volatile markets, the SMMA ensures that the signals are reliable, filtering out noise and allowing traders to stay in the trend longer without being shaken out by minor corrections. This approach is particularly effective in ratio trading in order to inform a longer term swing trader of the strongest asset out of a customized pair.
Case Study III:
Monthly Analysis with RSI Pulsar in Ribbon Mode
This case study demonstrates the versatility and reliability of the RSI Pulsar in Ribbon mode, applied to a monthly chart of Bitcoin with an RSI length of 8 and a TEMA length of 14. This setup highlights the indicator’s robustness across multiple timeframes, extending even to long-term analysis. The RSI Pulsar effectively smooths out noise while capturing significant trends, as seen during Bitcoin bull markets. The Ribbon mode provides a clear visual representation of momentum shifts, making it easier for traders to identify trend continuations and reversals with confidence.
Case Study IV:
Divergences and Continuations with the Volatility Spectrum
Identifying harmony/divergences can be hit-or-miss at times, but this unique analysis method definitely has its merits at times. The RSI Pulsar, with its Volatility Spectrum feature, is used here to identify critical moments where price action either aligns with or diverges from the underlying volatility. As seen in the Bitcoin chart (using default settings), the indicator highlights areas where price trends either continue in harmony with volatility or diverge, signaling potential reversals. This method, while not always perfect, provides significant insight during key turning points in the market.
The Volatility Spectrum's visual representation of rising and falling volatility, combined with divergence and harmony analysis, enables traders to anticipate significant shifts in market dynamics. In this case, multiple divergences correctly identified early trend reversals, while periods of harmony indicated strong trend continuations. While this method requires careful interpretation, especially during complex market conditions, it offers valuable signals that can be pivotal in making informed trading decisions, especially if combined with other forms of analysis it can form a critical component of an investing system.
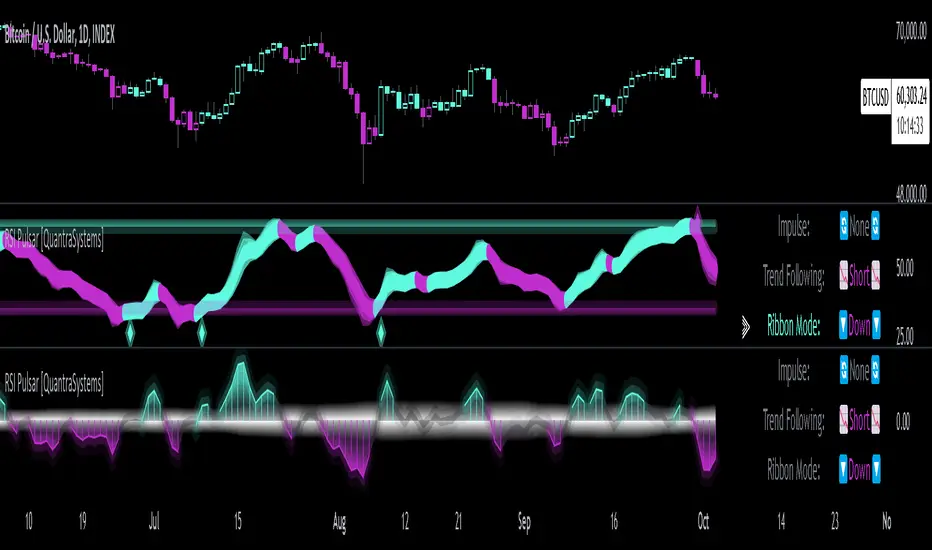
Multi-Chart Relative Strength Oscillator[ChartGalaxy]The Multi-Chart Relative Strength Oscillator is a powerful tool designed to compare the relative strength of up to 10 different market symbols (such as indices, stocks, or commodities). By normalizing each symbol's performance, this oscillator highlights which symbols are showing strength or weakness relative to each other over a selected time period.
Key Features:
Multiple Symbols Comparison: Compare up to 10 different symbols simultaneously.
Oscillator Calculation: Each symbol's price is normalized and converted into an oscillator, allowing for easy comparison of relative strength
Custom Timeframes: Choose any resolution (e.g., daily, weekly) for analyzing the symbols.
Dynamic Labeling: Each symbol is labeled on the chart for easy identification with color-coded labels that match the plotted lines.
Strength Classification: Symbols are classified as "Strong", "Neutral", or "Weak" based on their performance relative to others.
Optional Symbol Table: A table of the symbols and their strength is displayed on the chart, giving a quick overview of the current market conditions.
How it Works:
Symbol Input: The user can input up to 10 market symbols (such as indices or stocks) they wish to compare.
Oscillator Calculation: The indicator calculates the normalized value of each symbol over the selected time period, adjusting for standard deviation to create a relative strength oscillator.
Visual Comparison: The symbols are plotted as oscillating lines on the chart, color-coded for easy differentiation. Additionally, labels appear on the right side of each plot to indicate the symbol.
Strength Assessment: Each symbol is classified as Strong/Weal/Neutral
Use Cases:
Sector Rotation Analysis: Compare different sectors (e.g., Energy, Technology, Healthcare) to see which sectors are gaining or losing relative strength.
Asset Comparison: Analyze a group of stocks, commodities, or other assets to determine which are outperforming or underperforming.
Market Overview: Get a broad overview of the market by comparing key indices and sectors to gauge the overall market sentiment.
Customization Options:
Resolution Selection: Users can select their preferred timeframe for analysis (e.g., daily, weekly).
Custom Symbol Selection: Input any symbol supported by TradingView to compare performance.
Visual Clarity: Each symbol is plotted with distinct colors, and a label with the symbol’s name appears alongside the chart, making it easy to identify each line.
This indicator is ideal for traders looking to conduct sector analysis, asset comparison, or relative strength studies across multiple symbols, providing them with an intuitive and easy-to-read visual tool.
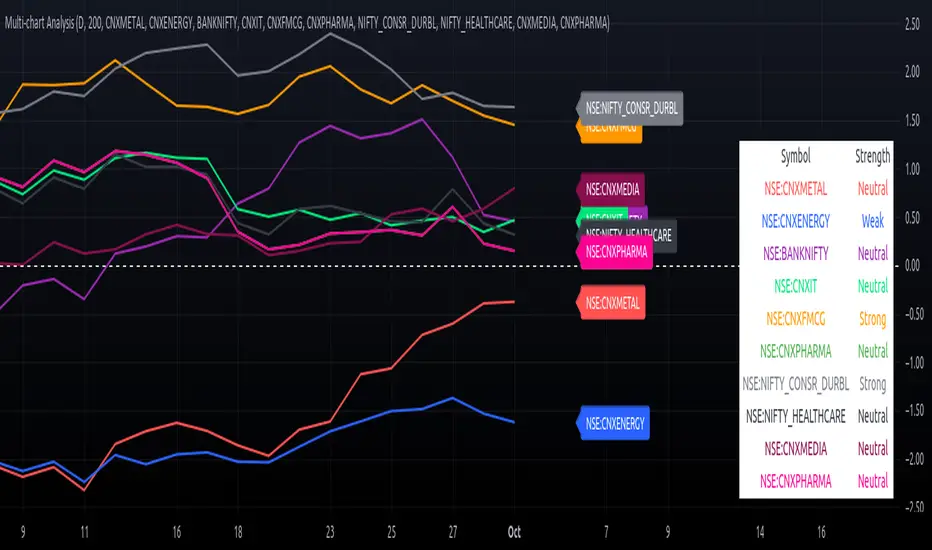
Options Series - NonOverlay_Technical
⭐ 1. Purpose:
The script is designed to show technical indicators in a non-overlay form using candlestick representations. It combines multiple popular technical analysis tools to gauge the market's bullish or bearish conditions.
⭐ 2. Indicators:
The script uses several indicators across different timeframes: Exponential Moving Averages (EMA) for 5, 20, 50 periods. Simple Moving Average (SMA) for 200 periods. RSI (Relative Strength Index) for momentum. VWAP (Volume Weighted Average Price) for average price evaluation. PSAR (Parabolic SAR) for trend direction. Daily and multi-day (2-day and 3-day) data for broader market context.
⭐ 3. Candlestick Representation:
The script uses color-coded candlesticks to visually represent various indicators and their bullish/bearish states: Green candlesticks for bullish conditions. Red candlesticks for bearish conditions. Neutral/transparent for non-significant conditions.
⭐ 4. Important Conditions:
It calculates bullish and bearish conditions for each indicator: MA20: When the price is above or below the 20-period EMA. RSI: When RSI is above or below 50. VWAP: When the price is above or below the VWAP. PSAR: When the price is above or below the PSAR. 2-day and 3-day Moving Averages: Evaluating the broader trend.
⭐ 5. Bullish vs. Bearish Calculation:
The script sums up bullish and bearish signals to determine the overall market condition: Current_logical_bull: Counts the number of bullish indicators. Current_logical_bear: Counts the number of bearish indicators. The script compares these values to conclude whether the market is more bullish or bearish.
⭐ 6. Visual Plotting:
The script uses plotcandle to display the non-overlay signals at different levels for each condition, stacked vertically from MA20 to PSAR. Additionally, a master candle combines all indicators to show an overall market trend.
⭐ 7. Neon Effect on MA20:
It adds a neon-like effect to the MA20 line, making it visually prominent: A standard plot line with the base color. Two additional neon layers with increasing transparency to enhance the effect.
⭐ 8. Daily Timeframes and Lookahead:
The script fetches daily data using the lookahead feature to get a broader view of the market trend. It tracks the previous day’s and two days' data for comparison.
⭐ 9. Labels and Customization:
The script dynamically adds labels to the chart for the different plotted indicators at the last bar, making it easier to identify which indicator is being represented.
🚀 Conclusion:
The script combines multiple technical indicators, such as EMA, RSI, VWAP, PSAR, and multi-day moving averages, to visually assess bullish and bearish market conditions. It uses color-coded candlesticks to represent each indicator and sums up the signals to determine the overall trend.

Signals for Trending or Ranging market using RSI and WMAThis trading indicator is based on several key components, including the Average Directional Index (ADX), and a combination of RSI and Weighted Moving Average (WMA) to signal trading opportunities in both trending and ranging markets. Here's a breakdown:
ADX Calculation: The script calculates the ADX to identify market trends. A threshold value of ADX is used to distinguish between trending and ranging market conditions.
RSI and WMA for Different Market Conditions: The script calculates two sets of RSI and WMA, one for trending markets and another for ranging markets. This allows the strategy to adjust based on market conditions determined by the ADX value.
Trade Signals: The script generates long and short signals based on the alignment of RSI and WMA.
Long Signals: Triggered when RSI and WMA indicate upward momentum.
Short Signals: Triggered when both RSI and WMA suggest downward movement.
The signals are confirmed by pivot points, with the stop loss placed at the most recent high or low.
Stop Loss and Trade Management: The script includes dynamic stop-loss management. It moves the stop loss in halfway original stop loss after achieving 2R and to break-even after achieving a 4R gain.
Performance Tracking: It tracks the number of winning and losing trades and calculates the total "R" (risk/reward) for the active trades. Debugging labels are added on the chart to display statistics for wins, losses, and total R performance.
Plotting: The script plots the stop loss and entry price on the chart for visual clarity. Additionally, it colors the background green or red based on whether a long or short position is active.
Overall, this indicator combines ADX, RSI, and WMA indicators with a robust trade management system to execute and track trading signals in both trending and ranging markets.
