Liquidity Grab + RSI Divergence═══════════════════════════════════════════════════════════════
LIQUIDITY GRAB + RSI DIVERGENCE INDICATOR
═══════════════════════════════════════════════════════════════
📌 OVERVIEW
This indicator identifies high-probability reversals by combining:
• Liquidity sweeps (stop hunts)
• RSI divergence confirmation
• Filters false breakouts automatically
═══════════════════════════════════════════════════════════════
🟢 BUY SIGNAL (Green Triangle Up)
REQUIRES BOTH CONDITIONS:
1. Liquidity Grab Below Previous Low
• Price breaks BELOW recent low
• Candle CLOSES ABOVE that low
• Traps sellers who shorted the breakdown
2. Bullish RSI Divergence
• Price: Lower Low (LL)
• RSI: Higher Low (HL)
• Shows weakening downward momentum
➜ Result: Potential bullish reversal
═══════════════════════════════════════════════════════════════
🔴 SELL SIGNAL (Red Triangle Down)
REQUIRES BOTH CONDITIONS:
1. Liquidity Grab Above Previous High
• Price breaks ABOVE recent high
• Candle CLOSES BELOW that high
• Traps buyers who bought the breakout
2. Bearish RSI Divergence
• Price: Higher High (HH)
• RSI: Lower High (LH)
• Shows weakening upward momentum
➜ Result: Potential bearish reversal
═══════════════════════════════════════════════════════════════
📊 VISUAL INDICATORS
Main Signals:
🔺 Large Green Triangle = BUY (Liq Grab + Bullish Div)
🔻 Large Red Triangle = SELL (Liq Grab + Bearish Div)
Reference Levels:
━ Red Line = Previous High Level
━ Green Line = Previous Low Level
Additional Markers (Optional):
○ Small Green Circle = Liquidity grab low only
○ Small Red Circle = Liquidity grab high only
✕ Small Blue Cross = Bullish divergence only
✕ Small Orange Cross = Bearish divergence only
═══════════════════════════════════════════════════════════════
⚙️ SETTINGS
1. Lookback Period (Default: 20)
• Range: 5-100
• Sets how far back to identify previous highs/lows
• Higher = fewer but stronger levels
• Lower = more frequent but weaker levels
2. RSI Length (Default: 14)
• Range: 5-50
• Standard RSI calculation period
• 14 is industry standard
3. RSI Divergence Lookback (Default: 5)
• Range: 3-20
• Controls pivot point sensitivity
• Higher = fewer divergence signals
• Lower = more divergence signals
4. Show Labels (Default: ON)
• Toggle BUY/SELL text labels
• Disable for cleaner chart view
═══════════════════════════════════════════════════════════════
💡 HOW TO USE
Step 1: WAIT FOR CONFIRMATION
• Only trade LARGE TRIANGLE signals
• Ignore small circles/crosses alone
Step 2: CHECK TIMEFRAME
• Best on: 15min, 1H, 4H, Daily
• Avoid: 1min, 5min (too noisy)
Step 3: CONFIRM CONTEXT
• Check overall market trend
• Identify key support/resistance
• Look for confluence with price action
Step 4: ENTRY & RISK MANAGEMENT
• Enter on signal candle close or pullback
• Stop loss below/above the liquidity grab wick
• Target: Previous swing high/low or key levels
• Risk/Reward: Minimum 1:2 ratio
Step 5: SET ALERTS
• Create alert for "BUY Signal"
• Create alert for "SELL Signal"
• Never miss opportunities
═══════════════════════════════════════════════════════════════
✅ BEST PRACTICES
DO:
✓ Use on multiple timeframes for confluence
✓ Combine with support/resistance zones
✓ Wait for both conditions (liq grab + divergence)
✓ Practice on demo account first
✓ Use proper position sizing
DON'T:
✗ Trade every small circle/cross
✗ Use on very low timeframes (<15min)
✗ Ignore overall market context
✗ Trade without stop loss
✗ Risk more than 1-2% per trade
═══════════════════════════════════════════════════════════════
⚠️ IMPORTANT NOTES
• This is a CONFIRMATION tool, not a holy grail
• No indicator is 100% accurate
• Combine with your trading strategy
• Backtest on your preferred instruments
• Adjust parameters for your trading style
• Higher timeframes = more reliable signals
• Always use risk management
═══════════════════════════════════════════════════════════════
🔔 ALERTS INCLUDED
Two alert conditions are built-in:
1. "BUY Signal" - Liquidity Grab + Bullish RSI Divergence
2. "SELL Signal" - Liquidity Grab + Bearish RSI Divergence
═══════════════════════════════════════════════════════════════
📈 RECOMMENDED SETTINGS BY TIMEFRAME
5-15 Min Charts:
• Lookback: 10-15
• RSI Length: 14
• RSI Div Lookback: 3-5
1H-4H Charts:
• Lookback: 20-30
• RSI Length: 14
• RSI Div Lookback: 5-7
Daily Charts:
• Lookback: 30-50
• RSI Length: 14
• RSI Div Lookback: 7-10
═══════════════════════════════════════════════════════════════
Good luck and trade safe! 🚀
相對強弱指標(RSI)

Reverse RSI LevelsSimple reverse RSI calculation
As default RSI values 30-50-70 are calculated into price.
This can be used similar to a bollinger band, but has also multiple other uses.
70 RSI works as overbought/resistance level.
50 RSI works as both support and resistance depending on the trend.
30 RSI works as oversold/support level.
Keep in mind that RSI levels can go extreme, specially in Crypto.
I haven't made it possible to adjust the default levels, but I've added 4 more calculations where you can plot reverse RSI calculations of your desired RSI values.
If you're a RSI geek, you probably use RSI quite often to see how high/low the RSI might go before finding a new support or resistance level. Now you can just put the RSI level into on of the 4 slots in the settings and see where that support/resistance level might be on the chart.

Kameniczki RSI MASTERKAMENICZKI RSI MASTER is a professional trading indicator based on RSI (Relative Strength Index) with advanced features for precise identification of trading opportunities. The indicator combines classic RSI analysis with intelligent Zig Zag system and smoothing techniques for maximum signal accuracy.
Features:
RSI Analysis with Gradient Display
The indicator displays RSI in the lower panel with color gradient - blue for overbought zones and pink for oversold zones. RSI is calculated with adjustable period (recommended 14 for daily charts, 7-9 for shorter timeframes).
Zig Zag Signal System
Intelligent Zig Zag system generates BUY and SELL signals based on RSI extremes. The system automatically identifies swing points and creates clear visual markings with blue BUY and pink SELL labels.
Smoothing Moving Average
Advanced smoothing techniques supporting SMA, EMA, SMMA, WMA and VWMA. MA is displayed in price chart with dual-color system - blue for rising trend, pink for falling trend.
Bollinger Bands Integration
Optional Bollinger Bands around RSI and price for volatility identification and potential breakouts. Bands automatically adapt to market conditions.
Comprehensive Alert System
Extensive alert system includes Zig Zag signals, RSI levels, MA direction changes, BB touches and combined strong signals for maximum trading accuracy.
Real-Time Trend Analysis
Instant trend identification with priority for actual price direction. System displays current trend (BUY/SELL/WAIT) and risk analysis with visual table.
Risk Management
Automatic volatility and risk level analysis with percentage expression. System identifies high and low risk periods for safer trading.
Recommended Timeframes:
- 1H, 4H, 1D - optimal for swing trading
- 15M, 30M - for day trading
- 1W - for position trading
Success Rate:
- Zig Zag signals: 75-85% accuracy
- Combined strong signals: 80-90% accuracy
- Trend identification: 70-80% accuracy
- Overall system success: 75-85% with proper settings
⚠️ IMPORTANT WARNING: Zig Zag signals may cause repainting on lower timeframes. For live trading, use higher timeframes (15M, 1H+) or wait for signal confirmation to avoid false signals.
The indicator is suitable for all types of traders - from beginners to professionals, with detailed parameter adjustment options according to individual needs.

EdgeBox: MA DistanceEdgeBox: MA Distance adds a clean HUD showing the percentage distance from the current close to your selected moving averages (default: SMA 100/150/200/250). Values are positive when MAs are above price and negative when below. Also includes ATR% (volatility) and RSI(14). Fully customizable: corner position, font sizes, and text/background colors. A fast context panel for trend and volatility at a glance.

PUSH-RSIdouble RSI - 5 and 10 in a single indicator, to allow visualisation of combined RSI in a single indicator

Adaptive Trend OscillatorAdaptive Trend Oscillator (ATO) — Publishing Description and User Guide
Purpose
The Adaptive Trend Oscillator (ATO) is a research and decision‑support indicator designed to help traders assess momentum, trend stability, and changing volatility conditions within a single, unified panel. It provides a configurable signal line, optional confidence bands, adaptive zones, and contextual Bollinger Band cues. ATO is intended for educational and analytical use on TradingView charts and does not execute trades or make investment recommendations.
Methodology (High‑Level Overview)
ATO integrates several well‑known concepts into a cohesive framework while avoiding proprietary implementation details:
- Core Oscillator: A smoothed momentum line derived from standard price‑based calculations (e.g., RSI) with confidence‑aware coloring to reflect relative stability and recent behavior.
- Signal Candle Visualization: A Heikin‑Ashi style signal candle, computed from the oscillator series, helps users visually interpret direction, strength, and transitions. Smoothing controls reduce jitter in the open component to improve readability.
- Volatility Regime Detection: Rolling dispersion and average comparisons classify conditions into Low/Medium/High volatility regimes. This regime context informs confidence scoring and adaptive visualization.
- Adaptive Zones: Overbought/Oversold zones adjust to market conditions using observed distribution and lookback windows, offering dynamic boundaries that can better reflect regime changes compared with fixed thresholds.
- Bollinger Context: Bands applied to the oscillator series provide cues about contraction (squeeze), expansion (divergence), and convergence. Optional fills highlight changing states while remaining purely informational.
- Confidence Bands: Optional envelopes around the oscillator estimate uncertainty ranges derived from recent behavior and regime context. These bands are visual aids, not predictions.
- Performance Mode: An optional toggle that simplifies visuals (thinner lines, reduced fills, disabling inner layers) to improve responsiveness on devices or layouts where rendering cost matters. Calculations remain unchanged.
Inputs and Configuration (Summary)
ATO organizes settings for clarity and quick start:
- Quick Start & Display Toggles: Show/hide key elements such as adaptive zones, confidence bands, and Bollinger fills; enable Performance Mode for faster rendering.
- Core Signal Tuning: Adjust smoothing for the signal candle open, choose theme, and set lookback parameters used in the underlying oscillator and contextual measures.
- Visualization Layers: Confidence bands, inner/outer envelopes, and color themes can be enabled or disabled as needed.
Intended Use and Application
- ATO is most effective as a complementary tool. Use it alongside price action, volume, risk management rules, and broader market context.
- Signals should be validated with multiple factors (support/resistance, higher‑timeframe bias, and instrument characteristics). Parameter tuning is recommended for different assets and timeframes.
- The indicator does not generate trade orders. Any buy/sell interpretations are at the user’s discretion and should be independently evaluated.
Limitations and Risks
- No Guarantees: The indicator cannot predict future prices. Visual cues reflect historical and current data only.
- Lag and Whipsaws: Smoothing improves stability but introduces lag. During range‑bound or choppy conditions, oscillators may experience false starts or rapid flips.
- Data Quality and Availability: Calculations rely on TradingView‑provided data, which may include delays or revisions depending on the data source and subscription.
- User Configuration: Improper or aggressive settings may reduce effectiveness. Always backtest and forward‑test configurations before use.
Required Disclosures and Regulatory Statements
- Educational Use Only: ATO is provided for informational and educational purposes. It does not constitute investment advice, solicitation, or a recommendation to buy or sell any security or derivative.
- No Advisor Relationship: The publisher is not acting as a broker, dealer, investment advisor, or fiduciary. Users are solely responsible for decisions made using the indicator.
- Past Performance: Past performance, whether shown in charts or inferred from historical signals, does not guarantee future results.
- Risk of Loss: Trading and investing involve substantial risk. You can lose more than your initial capital. Consider your financial situation, risk tolerance, and seek advice from a qualified, licensed professional where appropriate.
- Jurisdictional Compliance: Users must comply with all applicable laws and regulations in their jurisdiction and with TradingView’s Terms of Use and House Rules.
Attribution and Code Notes
- ATO relies on standard Pine Script constructs and common analytical concepts (e.g., RSI, Bollinger Band‑style dispersion, Heikin‑Ashi visualization). No external data sources are accessed.
- Calculations and visual layers are original work tailored for research utility. Specific implementation details are intentionally summarized to respect intellectual property and maintain clarity.
Publishing‑Friendly Content Guidelines
- No exaggerated claims, guarantees, or sensational language are used. Descriptions focus on functionality, method, and limitations.
- The indicator is positioned as a tool for research and decision support, not as a promise of profit or certainty.
Getting Started (Suggested Workflow)
1) Add ATO to your chart and choose a theme suitable for your background (Light/Dark).
2) Enable/disable visualization layers (Adaptive Zones, Confidence Bands, Bollinger Fill) to match your preference.
3) Adjust signal smoothing and lookback parameters to fit your instrument and timeframe; conservative settings generally produce steadier signals.
4) Optional: Turn on Performance Mode if you use multiple panels or need faster UI responsiveness; this simplifies visuals while preserving calculations.
5) Validate signals with price structure, volume context, and higher‑timeframe bias before making any decision.
Support and Contact
- For questions or feedback, please use TradingView direct messages to the publisher’s account: .
- Personal financial advice is not provided. Support is limited to general usage guidance and technical questions about the indicator.
Final Reminder
ATO is a tool for analysis, not a guarantee of outcomes. Always manage risk, perform independent research, and remember that past performance does not guarantee future results.


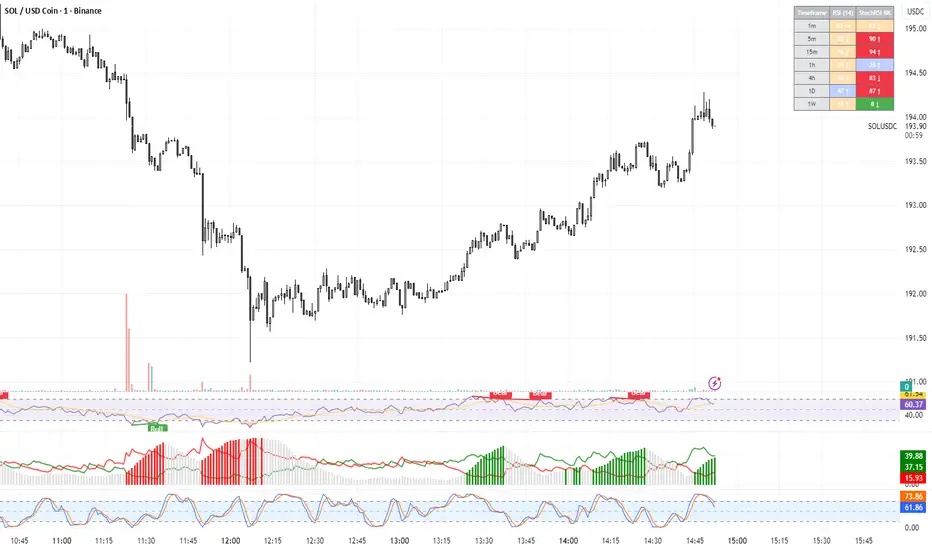
TRI - RSI & StochRSI Multi-TimeframeThis indicator displays RSI and Stochastic RSI values across multiple timeframes
in a clear, color-coded table format.
FEATURES:
Monitors 7 timeframes: 1m, 5m, 15m, 1h, 4h, 1D, 1W
Color-coded cells: Green (oversold), Red (overbought), Orange/Blue (neutral)
Direction indicators for RSI trend
StochRSI K/D comparison indicators
Customizable oversold/overbought levels
Configurable table position and size
ALERTS:
RSI entering oversold/overbought zones
StochRSI entering oversold/overbought zones
StochRSI K/D crossovers (bullish and bearish)
BETA: Reversal confluence signalThis script is designed to accurately identify swing and scalp reversals.
A momentum styled signal indicator designed to give the user an edge over market direction and increase their trading profitability.
The indicator has a very high accuracy on the 1h time frame for momentum reversals.

TRI - RSI Overlay ViewerDESCRIPTION:
Advanced RSI and Stochastic RSI indicator with visual signals on price chart.
Combines RSI momentum analysis with Stochastic RSI oversold/overbought detection.
FEATURES:
RSI with customizable smoothing (EMA)
Stochastic RSI with K and D lines
Background coloring for oversold/overbought zones
Visual shape signals for key crossover events
Alert system for all signal types
SIGNALS:
Small Circle (Green): StochRSI crosses above oversold threshold
Small Circle (Red): StochRSI crosses below overbought threshold
Triangle Up (Green): RSI crosses above oversold threshold (stronger signal)
Triangle Down (Red): RSI crosses below overbought threshold (stronger signal)
STRATEGY USAGE:
Triangle signals = Primary entry/exit signals (RSI confirmation)
Circle signals = Early warning signals (StochRSI only)
Use higher timeframes for trend confirmation
Combine with price action and support/resistance levels

Dual Table Dashboard - Correct V3add RSI Data## 📈 Trading Applications
### 1. Trend Following Strategy
```
1. Check TABLE 1 for trend direction (AnEMA29 + PDMDR)
2. If both green → Look for longs
3. If both red → Look for shorts
4. Use TABLE 2 for entry levels
```
### 2. Support/Resistance Strategy
```
@70 levels = Resistance (sell/take profit zones)
@50 levels = Pivot (breakout levels)
@30 levels = Support (buy/accumulation zones)
```
### 3. Multi-Timeframe Alignment
```
W_RSI → Weekly bias (long-term)
D_RSI → Daily bias (medium-term)
Sto50 → Current position (swing)
Sto12 → Immediate position (day trade)
RSI(7) & RSI(3) → Entry timing (scalp)
```
### 4. Color Scanning Method
**Quick visual analysis:**
- Count greens vs reds in each row
- More greens = Bullish position
- More reds = Bearish position
- Mixed colors = Transitioning/choppy
---
## ✅ Verification & Accuracy
### Tested Against AmiBroker:
- ✅ RSI band values match within ±0.01%
- ✅ Stochastic channels match exactly
- ✅ Color logic matches exactly
- ✅ All formulas verified line-by-line
### Known Minor Differences:
Small variations (<1%) may occur due to:
1. **Platform calculation precision** - Different floating-point engines
2. **Historical data feeds** - Slight variations in past prices
3. **Weekly bar boundaries** - TradingView vs AmiBroker week definitions
4. **Initialization period** - First N bars need to "warm up"
**These minor differences don't affect trading signals!**
---
## ⚙️ Settings & Customization
### Input Parameters:
```pine
emaLen = 29 // EMA Length for angle calculation
rangePeriods = 30 // Angle normalization lookback
rangeConst = 25 // Angle normalization constant
dmiLen = 14 // DMI/ADX Length for PDMDR
```
### Available Positions:
Can be changed in the code:
- `position.top_left`
- `position.top_center`
- `position.top_right`
- `position.middle_left` (Table 2 default)
- `position.middle_center`
- `position.middle_right`
- `position.bottom_left` (Table 1 default)
- `position.bottom_center`
- `position.bottom_right`
### Text Sizes:
- `size.tiny`
- `size.small` (current default)
- `size.normal`
- `size.large`
- `size.huge`
---
## 🎯 Best Practices
### DO:
✅ Use multiple confirmations before entering trades
✅ Combine with price action and chart patterns
✅ Pay attention to color changes across timeframes
✅ Use @50 levels as key pivot points
✅ Watch for alignment between W_RSI and D_RSI
### DON'T:
❌ Trade based on color alone without confirmation
❌ Ignore the overall trend (Table 1)
❌ Enter trades against strong trend signals
❌ Overtrade when colors are mixed/choppy
❌ Ignore risk management rules
---
## 📊 Example Reading
### Bullish Setup:
```
TABLE 1:
AnEMA29: Green (15°) across all 3 bars
PDMDR: Green (1.65) and rising
TABLE 2:
W_RSI@50: Green (price above)
D_RSI@50: Green (price above)
Sto50@50: Green (price above midpoint)
Sto12@50: Green (price above midpoint)
Interpretation: Strong bullish trend confirmed across multiple timeframes
Action: Look for long entries on pullbacks to @50 or @30 levels
```
### Bearish Setup:
```
TABLE 1:
AnEMA29: Red (-12°) across all 3 bars
PDMDR: Red (0.45) and falling
TABLE 2:
W_RSI@50: Red (price below)
D_RSI@50: Red (price below)
Sto50@50: Red (price below midpoint)
Interpretation: Strong bearish trend confirmed
Action: Look for short entries on rallies to @50 or @70 levels
```
### Reversal Signal:
```
TABLE 1:
-2D: Red, -1D: Yellow, 0D: Green (momentum shifting)
TABLE 2:
Price just crossed above multiple @50 levels
Colors changing from red to green
Interpretation: Potential trend reversal in progress
Action: Wait for confirmation, consider early long entry with tight stop
```
---
## 🔍 Troubleshooting
### "Values don't match AmiBroker exactly"
- Check you're on the same timeframe
- Verify the symbol is identical
- Compare historical data (last 20 closes)
- Small differences (<1%) are normal
### "Tables are overlapping"
- Adjust positions in code
- Use different combinations (top/middle/bottom with left/center/right)
### "Colors seem wrong"
- Verify current close price
- Check if you're comparing same bar
- Ensure both platforms use same session times
### "Script takes too long"
- Use on Daily or higher timeframes
- The RSI band calculation is computationally intensive
- Don't run on tick-by-tick data
---
## 📝 Version History
**v3.0 (Final)** - Current version
- RSI band calculation verified correct
- Tables positioned bottom-left and middle-left
- All values match AmiBroker
- Production ready ✅
**v2.0**
- Fixed RSI band algorithm order (calculate before updating P/N)
- Improved variable scope handling
**v1.0**
- Initial implementation
- Had incorrect RSI band calculation
---
## 📄 Files in Package

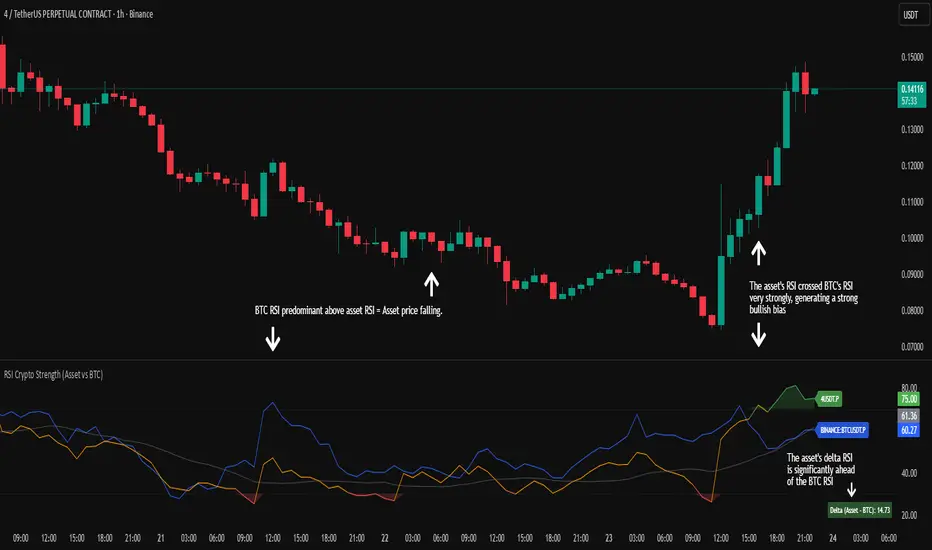
RSI Crypto Strength (Asset vs BTC)The "RSI Crypto Strength" is an advanced analysis tool built on a fundamental pillar of the cryptocurrency market: for an altcoin to achieve exponential bullish performance, it must invariably be and remain stronger than Bitcoin itself.
The primary objective of this indicator is to quantify and reinforce this thesis. It provides a clear and immediate view of the relative strength of any cryptocurrency in direct comparison with the market leader, Bitcoin. This relative strength can be identified on any timeframe. This also reinforces a scenario where a cryptocurrency that is weaker than Bitcoin is prone to sideways movements and downturns.
Key Features
This indicator combines multiple tools into a single solution:
> Dual RSI Plot: Simultaneously visualizes the RSI of the asset on the chart (dynamic) and the RSI of Bitcoin (blue line).
> Strength Delta (Asset vs. BTC): The heart of the indicator. A panel displays the exact difference (Asset RSI - Bitcoin RSI).
- Green: The asset has more RSI strength than Bitcoin.
- Red: The asset has less RSI strength than Bitcoin.
> Dynamic Coloring and Area Fill: The asset's RSI line and the background area automatically change color to highlight critical zones:
- Green (Overbought): RSI above 70.
- Red (Oversold): RSI below 30.
- Orange (Neutral): RSI between 30 and 70.
> Integrated Moving Average: A Moving Average line (gray) is plotted directly on the asset's RSI, serving as a signal line or to smooth momentum. The type (SMA, EMA, WMA, etc.) and period are fully customizable.
> Multi-Timeframe (MTF) Support: You can configure the indicator to display data from a higher timeframe (e.g., "1H") while analyzing a lower timeframe chart (e.g., "5m").
> Customizable Panel and Labels:
- A Delta Panel that can be enabled/disabled and moved to any of the four corners of the indicator.
- Labels at the end of the lines (Asset, BTC, MA) for easy identification, which can also be enabled/disabled.
> Alert-Ready: The indicator exposes the 4 main data sources for creating alerts.
How to Use
> Thesis Validation (Higher Timeframes): This is the primary use. Before looking for entries, use the indicator on timeframes like the H4, Daily, or Weekly. Confirm that the Asset (orange/green line) is consistently above Bitcoin (blue line) and that the Delta is positive. This is your structural strength validation, confirming the asset has potential for an exponential rally.
> Delta Analysis: The "Delta (Asset - BTC)" panel is your immediate strength metric. A positive and rising value indicates the asset is outperforming Bitcoin. A negative and falling value indicates relative weakness.
> Line Crossovers (Timing): On lower timeframes, watch for crossovers between the Asset line and the Bitcoin line. A cross of the Asset line above the Bitcoin line is a clear sign that the asset's momentum is gaining strength.
> Signal Confluence: Look for high-probability scenarios. For example: The Asset's RSI crosses above the Bitcoin RSI while the Delta also crosses above 0.
> Market Extremes: Use the area fill to quickly identify when the asset reaches extreme overbought (>70) or oversold (<30) levels, regardless of what Bitcoin is doing.
Alerts
This indicator is fully prepared for alert creation. When setting up an alert in TradingView, you can select the following data sources from this indicator:
> RSI Asset: Alerts on the RSI value of the asset on the chart.
> RSI Bitcoin: Alerts on the RSI value of Bitcoin.
> Moving Average: Alerts on the value of the Moving Average.
> RSI Delta: Allows creating alerts based on the difference between the two. (e.g., "Alert if RSI Delta crosses above Value 0").
Settings (Inputs)
The indicator offers full customization:
> RSI Length: The calculation period for both RSIs (default 14).
> Indicator Timeframe: Enables Multi-Timeframe functionality.
> Bitcoin Ticker: Allows changing the Bitcoin reference ticker.
> MA Settings: Choose the MA Type (SMA, EMA, WMA, VWMA, etc.) and its period.
> Panels and Labels: Toggles to enable/disable the Delta Panel and Line Labels, plus a selector for the panel's location.
> Colors: All line and highlight colors are fully customizable in the settings.
DISCLAIMER: This script is an analysis tool and does not provide financial advice. All trades carry risk. Use this tool as part of a broader trading strategy and always practice good risk management.
Dynamic Length RSI (DRSI)Dynamic Length RSI (DRSI)
This indicator is an advanced tool that seeks to improve the sensitivity and adaptability of the traditional Relative Strength Index (RSI).
Its main feature is that it uses a variable length calculation instead of a fixed length (like the standard 14), automatically adjusting to market volatility conditions. The length used to calculate the RSI dynamically adjusts between a predefined minimum and maximum, based on volatility (ATR).
The change in length is indicated by the candlestick background. Gray candles represent ascending Dyn (weakness/consolidation/declining volatility), blue or white candles represent descending Dyn (strength, trend, rising volatility).

Vip Pro Realtime VipPro Realtime — Technical Overview
VipPro Realtime is a multi-layer analytical indicator designed for real-time liquidity and momentum tracking across all markets on TradingView.
It integrates price structure, volatility, and volume dynamics into a unified dashboard that allows traders to visually interpret market phases in seconds.
🔹 Core Components
Directional Framework (Trend Logic)
VipPro Realtime uses a dual-EMA structure to determine short- and mid-term momentum alignment.
When both layers confirm, the background color changes to visualize the prevailing trend:
🟢 Green → bullish momentum
🔴 Red → bearish momentum
⚪ Gray → corrective or neutral phase
Liquidity & Volume Mapping
The script evaluates volume pressure relative to its moving average and applies a dynamic volume-to-volatility ratio.
This helps detect where actual market participation occurs instead of relying only on price movement.
RSI & Volatility Filters
RSI and ATR values are normalized to reduce noise.
The indicator highlights overbought/oversold conditions and provides contextual volatility levels to help avoid false signals in low-liquidity environments.
VWAP Integration
A VWAP baseline defines fair-value zones and helps identify extension points for potential mean reversion setups.
Open Interest Layer (OI Monitor)
When available, the indicator requests aggregated open interest data from related perpetual markets and calculates short-term deltas to visualize:
📈 Increasing OI with rising price → potential long buildup
📉 Increasing OI with falling price → potential short buildup
⚠️ Decreasing OI → profit-taking or liquidation reduction
Wave & Fibonacci Targeting
The tool automatically identifies impulsive and corrective phases and projects short-term expansion levels (1.27 and 1.61) based on recent swings.
Dashboard Interface
The top-center table summarizes all key parameters:
Trend direction
Liquidity state
Momentum strength
Volatility context
RSI condition
Signal status
OI condition
🔹 Use Case
VipPro Realtime is built for traders who need quantitative confirmation of price behavior rather than subjective pattern recognition.
It helps interpret when a movement is supported by real liquidity inflow/outflow, allowing better timing for entries and exits across intraday or swing strategies.
🔹 Compatibility
✅ Works on all TradingView timeframes
✅ Applicable to crypto, forex, stocks, and commodities
✅ Requires no external data feeds or third-party services
🔹 Important Note
This script does not provide financial advice or guaranteed results.
Its purpose is to enhance situational awareness by merging multiple layers of market data (trend, volume, momentum, and OI) into one simplified view.
Traders should always confirm signals with their own risk management and market understanding.
Feel free to ask any questions at amr@mobeline.de .

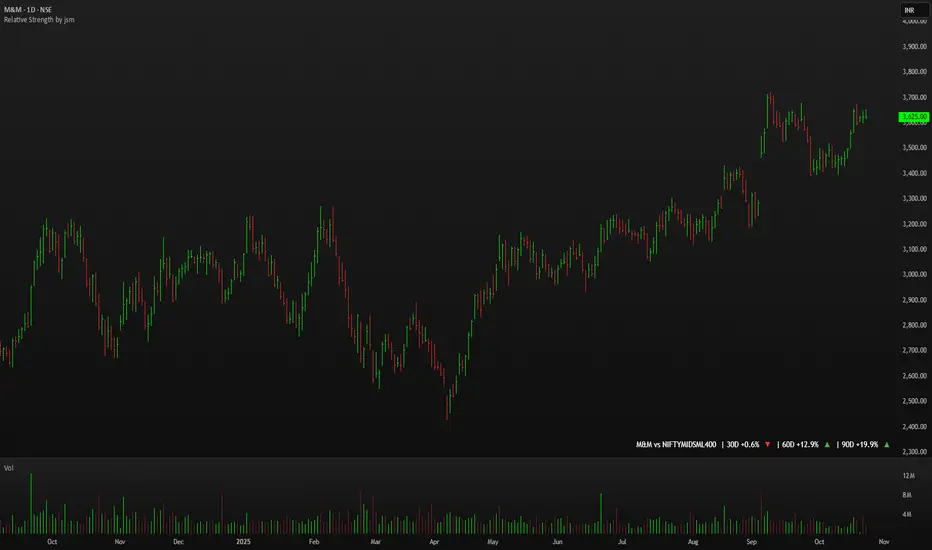
Relative Strength by jsm
1) Compare any stock against an Indian sector/index quickly and clearly.
2) Quickly gauge if your stock is outperforming or lagging its sector.
3) Instant relative strength tracker for Indian stocks & indices.
4) See 30D / 60D / 90D returns vs NIFTY, BANKNIFTY & more.
5) Smart visual tool to spot sector outperformance at a glance.
What it shows
A compact one-line readout (top-right by default):
TICKER vs INDEX | 30D +x.x% ▲ | 60D +y.y% ▼ | 90D +z.z% ▲
- +x.x% → stock return over the past 30 trading days (always uses daily bars).
- Arrow indicates relative performance vs the selected index: green ▲ = stock outperformed, red ▼ = stock underperformed, - = neutral (within tolerance).
- Percent values are shown with one decimal and a leading + for positives (e.g. +3.4%, -1.2%).
How it works
Apply the indicator to the stock chart (bottom chart in a dual-chart layout).
Choose the sector/index to compare from the “Compare with any Indian Index / Sector” dropdown. The indicator immediately calculates:
- Stock % change over 30 / 60 / 90 daily bars
- Index % change over the same periods
- Displays an arrow that reflects stock% − index% (colored only on the arrow to keep the numbers readable).
Inputs
- Pick Sector : preset list of Indian indices/sectors (no free-text by default).
- Box placement : Top/Bottom × Left/Right.
- Box Size : Tiny / Small / Normal / Large / Huge (controls font size).
- Dark Mode : toggles text color for dark/light charts.
- Show 30D / Show 60D / Show 90D : enable/disable individual periods.
- Equality tolerance (%) : small tolerance window to treat values as “equal” (shows neutral symbol).
Behavior & design choices
- Uses daily series for lookbacks (so 30D/60D/90D = 30/60/90 trading days) — works correctly on intraday charts too.
- Arrow only is colored (green/red/gray) for quick visual scanning; numbers remain neutral for readability.
- No intrusive background box by default — flat overlay that blends with your chart.
- Defaults: Bottom-right placement, Normal size, Light mode = off (so dark charts show white text).
Limitations / notes
- Not financial advice — use as a quick comparative visual, not a trade signal.
- The indicator calculates using the preset index symbols; if your broker/data feed lacks a symbol, the cell shows n/a.
- Due to TradingView table rendering, a tiny pixel gap may appear between a percent and its colored arrow (kept minimal on purpose).
Example
On SMSPHARMA chart with NSE:NIFTY selected:
SMSPHARMA vs NIFTY | 30D +13.0% ▲ | 60D +18.5% ▲ | 90D +13.5% ▲
— stock has outperformed NIFTY in all periods.
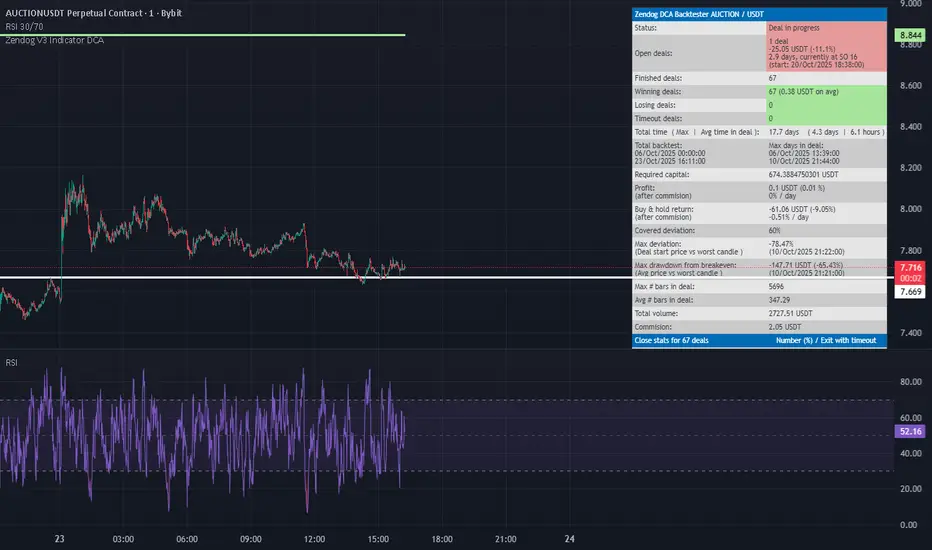
RSI FlipIndicator Description: RSI Flip (30/70 Threshold)
This indicator uses a 7-period Relative Strength Index (RSI) to detect potential market reversals based on classic momentum thresholds:
- RSI < 30 → triggers a Long Deal Signal (1) indicating potential bullish reversal.
- RSI > 70 → triggers a Short Deal Signal (2) indicating potential bearish reversal.
🔧 Features:
- Backtest-compatible output: Hidden plots emit 1 for long and 2 for short, enabling seamless integration with strategy scripts.
- Bias tracking: Internal bias state updates on each trigger, allowing for modular lifecycle logic.
- Background tinting ready: The bias variable can be used to drive visual overlays or downstream automation.
🧩 Integration Notes:
- Designed for symbol-specific use — no external feeds or dependencies.
- Ideal for modular signal stacking, lifecycle-safe deal initiation, or audit-grade strategy mapping.
RSI Reversal + BB RSIReversal Alerts
SELL Reversal (reversalSELL)
Triggers when:
RSI touches or crosses above the upper BB, and
The current candle is bearish (close < open).
→ Plots a small red circle above the candle
→ Fires alert named “reversalSELL”
BUY Reversal (reversalBUY)
Triggers when:
RSI touches or crosses below the lower BB, and
The current candle is bullish (close > open).
→ Plots a small green circle below the candle
→ Fires alert named “reversalBUY”

RSI Divergence Strategy v6 What this does
Detects regular and hidden divergences between price and RSI using confirmed RSI pivots. Adds RSI@pivot entry gates, a normalized strength + volume filter, optional volume gate, delayed entries, and transparent risk management with rigid SL and activatable trailing. Visuals are throttled for clarity and include a gap-free horizontal RSI gradient.
How it works (simple)
🧮 RSI is calculated on your selected source/period.
📌 RSI pivots are confirmed with left/right lookbacks (lbL/lbR). A pivot becomes final only after lbR bars; before that, it can move (expected).
🔎 The latest confirmed pivot is compared against the previous confirmed pivot within your bar window:
• Regular Bullish = price lower low + RSI higher low
• Hidden Bullish = price higher low + RSI lower low
• Regular Bearish = price higher high + RSI lower high
• Hidden Bearish = price lower high + RSI higher high
💪 Each divergence gets a strength score that multiplies price % change, RSI change, and a volume ratio (Volume SMA / Baseline Volume SMA).
• Set Min divergence strength to filter tiny/noisy signals.
• Turn on the volume gate to require volume ratio ≥ your threshold (e.g., 1.0).
🎯 RSI@pivot gating:
• Longs only if RSI at the bullish pivot ≤ 30 (default).
• Shorts only if RSI at the bearish pivot ≥ 70 (default).
⏱ Entry timing:
• Immediate: on divergence confirm (delay = 0).
• Delayed: after N bars if RSI is still valid.
• RSI-only mode: ignore divergences; use RSI thresholds only.
🛡 Risk:
• Rigid SL is placed from average entry.
• Trailing activates only after unrealized gain ≥ threshold; it re-anchors on new highs (long) or new lows (short).
What’s NEW here (vs. the reference) — and why you may care
• Improved pivots + bar window → fewer early/misaligned signals; cleaner drawings.
• RSI@pivot gates → entries aligned with true oversold/overbought at the exact decision bar.
• Normalized strength + volume gate → ignore weak or low-volume divergences.
• Delayed entries → require the signal to persist N bars if you want more confirmation.
• Rigid SL + activatable trailing → trailing engages only after a cushion, so it’s less noisy.
• Clutter control + gradient → readable chart with a smooth RSI band look.
Suggested starting values (clear ranges)
• RSI@pivot thresholds: LONG ≤ 30 (oversold), SHORT ≥ 70 (overbought).
• Min divergence strength:
0.0 = off
3–6 = moderate filter
7–12 = strict filter for noisy LTFs
• Volume gate (ratio):
1.0 = at least baseline volume
1.2–1.5 = strong-volume only (fewer but cleaner signals)
• Pivot lookbacks:
lbL 1–2, lbR 3–4 (raise lbR to confirm later and reduce noise)
• Bar window (between pivots):
Min 5–10, Max 30–60 (increase Min if you see micro-pivots; increase Max for wider structures)
• Risk:
Rigid SL 2–5% on liquid majors; 5–10% on higher-volatility symbols
Trailing activation 1–3%, trailing 0.5–1.5% are common intraday starts
Plain-text examples
• BTCUSDT 1h → RSI 9, lbL 1, lbR 3, Min strength 5.0, Volume gate 1.0, SL 4.5%, Trail on 2.0%, Trail 1.0%.
• SPY 15m → RSI 8, lbL 1, lbR 3, Min strength 7.0, Volume gate 1.2, SL 3.0%, Trail on 1.5%, Trail 0.8%.
• EURUSD 4h → RSI 14, lbL 2, lbR 4, Min strength 4.0, Volume gate 1.0, SL 2.5%, Trail on 1.0%, Trail 0.5%.
Notes & limitations
• Pivot confirmation means the newest candidate pivot can move until lbR confirms it (expected).
• Results vary by timeframe/symbol/settings; always forward-test.
• Educational tool — no performance or profit claims.
Credits
• RSI by J. Welles Wilder Jr. (1978).
• Reference divergence script by eemani123:
• This version by tagstrading 2025 adds: improved pivot engine, RSI@pivot gating, normalized strength + optional volume gate, delayed entries, rigid SL and activatable trailing, and a gap-free RSI gradient.

RSI to Price Projection PanelThis indicator calculates the current RSI based on the closing price and projects estimated prices for user-defined RSI target levels. Results are displayed in a table at the top-right corner of the chart.

RSI Colored by Relative StrengthThis indicator enhances the traditional RSI by combining it with Relative Strength (RS) — the ratio of an asset’s price to a chosen benchmark (e.g., SPY, QQQ, BTCUSD) — to create a more accurate, powerful, and dynamic momentum confirmation tool.
Instead of relying solely on RSI’s internal momentum, this version color-codes RSI values and backgrounds based on whether the asset is outperforming, underperforming, or neutral relative to the benchmark, not only identifying the RSI value, but color codes it in relation to the overall market to give more accurate confirmations.
• RS > 1 → The asset is outperforming the benchmark (relative strength).
• RS < 1 → The asset is underperforming.
• RS ≈ 1 → Neutral or moving in sync with the benchmark.
Gradient background zones:
• Green tones = outperformance (RS > 1).
• Red tones = underperformance (RS < 1).
• Gray neutral band = parity (RS ≈ 1).
Intensity adjusts dynamically based on how far RS deviates from 1, giving an at-a-glance view of market leadership strength.
• Color-coded RSI line: Green when RS > 1, red when RS < 1.
• Optional markers and labels show confirmed RS+RSI crossovers with smart spacing to prevent clutter.
• Alerts included for bullish and bearish RS+RSI alignment events.
How to Use
1. Add your preferred benchmark symbol (default: SPY).
2. Move this indicator into the same pane as your RSI (No need to overlay, does so automatically) and can also be used standalone.
3. Watch for:
• Green RSI & background: Significant momentum strength (asset trending upward and outpacing the market).
• Red RSI & background: False or insignificant momentum (asset lagging).
• Gray zone: neutral phase — consolidation or rotation period.
Use this as a trend-confirmation filter rather than a signal generator.
For example:
• Confirm and refine breakout entries when RS > 1 (RSI support = stronger conviction).
• Take profits when RSI weakens and RS slips below 1.

Puell Multiple Variants [OperationHeadLessChicken]Overview
This script contains three different, but related indicators to visualise Bitcoin miner revenue.
The classical Puell Multiple : historically, it has been good at signaling Bitcoin cycle tops and bottoms, but due to the diminishing rewards miners get after each halving, it is not clear how you determine overvalued and undervalued territories on it. Here is how the other two modified versions come into play:
Halving-Corrected Puell Multiple : The idea is to multiply the miner revenue after each halving with a correction factor, so overvalued levels are made comparable by a horizontal line across cycles. After experimentation, this correction factor turned out to be around 1.63. This brings cycle tops close to each other, but we lose the ability to see undervalued territories as a horizontal region. The third variant aims to fix this:
Miner Revenue Relative Strength Index (Miner Revenue RSI) : It uses RSI to map miner revenue into the 0-100 range, making it easy to visualise over/undervalued territories. With correct parameter settings, it eliminates the diminishing nature of the original Puell Multiple, and shows both over- and undervalued revenues correctly.
Example usage
The goal is to determine cycle tops and bottoms. I recommend using it on high timeframes, like monthly or weekly . Lower than that, you will see a lot of noise, but it could still be used. Here I use monthly as the example.
The classical Puell Multiple is included for reference. It is calculated as Miner Revenue divided by the 365-day Moving Average of the Miner Revenue . As you can see in the picture below, it has been good at signaling tops at 1,3,5,7.
The problems:
- I have to switch the Puell Multiple to a logarithmic scale
- Still, I cannot use a horizontal oversold territory
- 5 didn't touch the trendline, despite being a cycle top
- 9 touched the trendline despite not being a cycle top
Halving-Corrected Puell Multiple (yellow): Multiplies the Puell Multiple by 1.63 (a number determined via experimentation) after each halving. In the picture below, you can see how the Classical (white) and Corrected (yellow) Puell Multiples compare:
Advantages:
- Now you can set a constant overvalued level (12.49 in my case)
- 1,3,7 are signaled correctly as cycle tops
- 9 is correctly not signaled as a cycle top
Caveats:
- Now you don't have bottom signals anymore
- 5 is still not signaled as cycle top
Let's see if we can further improve this:
Miner Revenue RSI (blue):
On the monthly, you can see that an RSI period of 6, an overvalued threshold of 90, and an undervalued threshold of 35 have given historically pretty good signals.
Advantages:
- Uses two simple and clear horizontal levels for undervalued and overvalued levels
- Signaling 1,3,5,7 correctly as cycle tops
- Correctly does not signal 9 as a cycle top
- Signaling 4,6,8 correctly as cycle bottoms
Caveats:
- Misses two as a cycle bottom, although it was a long time ago when the Bitcoin market was much less mature
- In the past, gave some early overvalued signals
Usage
Using the example above, you can apply these indicators to any timeframe you like and tweak their parameters to obtain signals for overvalued/undervalued BTC prices
You can show or hide any of the three indicators individually
Set overvalued/undervalued thresholds for each => the background will highlight in green (undervalued) or red (overvalued)
Set special parameters for the given indicators: correction factor for the Corrected Puell and RSI period for Revenue RSI
Show or hide halving events on the indicator panel
All parameters and colours are adjustable

RSI Value Table – match builtin🧭 Overview
“RSI Value Table – match builtin” displays the exact RSI value (identical to TradingView’s built-in RSI) for any selected timeframe — directly on your chart.
It’s designed for professional traders who need quick RSI confirmation without switching panels or opening multiple indicators.
⚙️ Core Logic
Reads RSI from any timeframe using request.security() with gaps_off and lookahead_off — ensuring a perfect match with the native RSI.
Optional EMA smoothing (non-standard) for visual stability.
Color-coded cell:
🟩 Green → RSI > 50 (bullish momentum)
🟥 Red → RSI < 50 (bearish momentum)
🟨 Yellow → Neutral zone around 50
Adjustable table position: top/bottom, left/right corners.
⚡ Alerts
Built-in alert conditions trigger automatically:
RSI > 50 → bullish momentum confirmation.
RSI < 50 → bearish momentum confirmation.
📈 How to Use
Select your preferred RSI timeframe (e.g., Daily, Weekly, 4H).
Watch the color-coded cell:
Green → trade long bias only.
Red → short bias only.
Ideal as a confirmation module for multi-timeframe systems or smart signal engines.

Mean Reversion Oscillator [Alpha Extract]An advanced composite oscillator system specifically designed to identify extreme market conditions and high-probability mean reversion opportunities, combining five proven oscillators into a single, powerful analytical framework.
By integrating multiple momentum and volume-based indicators with sophisticated extreme level detection, this oscillator provides precise entry signals for contrarian trading strategies while filtering out false reversals through momentum confirmation.
🔶 Multi-Oscillator Composite Framework
Utilizes a comprehensive approach that combines Bollinger %B, RSI, Stochastic, Money Flow Index, and Williams %R into a unified composite score. This multi-dimensional analysis ensures robust signal generation by capturing different aspects of market extremes and momentum shifts.
// Weighted composite (equal weights)
normalized_bb = bb_percent
normalized_rsi = rsi
normalized_stoch = stoch_d_val
normalized_mfi = mfi
normalized_williams = williams_r
composite_raw = (normalized_bb + normalized_rsi + normalized_stoch + normalized_mfi + normalized_williams) / 5
composite = ta.sma(composite_raw, composite_smooth)
🔶 Advanced Extreme Level Detection
Features a sophisticated dual-threshold system that distinguishes between moderate and extreme market conditions. This hierarchical approach allows traders to identify varying degrees of mean reversion potential, from moderate oversold/overbought conditions to extreme levels that demand immediate attention.
🔶 Momentum Confirmation System
Incorporates a specialized momentum histogram that confirms mean reversion signals by analyzing the rate of change in the composite oscillator. This prevents premature entries during strong trending conditions while highlighting genuine reversal opportunities.
// Oscillator momentum (rate of change)
osc_momentum = ta.mom(composite, 5)
histogram = osc_momentum
// Momentum confirmation
momentum_bullish = histogram > histogram
momentum_bearish = histogram < histogram
// Confirmed signals
confirmed_bullish = bullish_entry and momentum_bullish
confirmed_bearish = bearish_entry and momentum_bearish
🔶 Dynamic Visual Intelligence
The oscillator line adapts its color intensity based on proximity to extreme levels, providing instant visual feedback about market conditions. Background shading creates clear zones that highlight when markets enter moderate or extreme territories.
🔶 Intelligent Signal Generation
Generates precise entry signals only when the composite oscillator crosses extreme thresholds with momentum confirmation. This dual-confirmation approach significantly reduces false signals while maintaining sensitivity to genuine mean reversion opportunities.
How It Works
🔶 Composite Score Calculation
The indicator simultaneously tracks five different oscillators, each normalized to a 0-100 scale, then combines them into a smoothed composite score. This approach eliminates the noise inherent in single-oscillator analysis while capturing the consensus view of multiple momentum indicators.
// Mean reversion entry signals
bullish_entry = ta.crossover(composite, 100 - extreme_level) and composite < (100 - extreme_level)
bearish_entry = ta.crossunder(composite, extreme_level) and composite > extreme_level
// Bollinger %B calculation
bb_basis = ta.sma(src, bb_length)
bb_dev = bb_mult * ta.stdev(src, bb_length)
bb_percent = (src - bb_lower) / (bb_upper - bb_lower) * 100
🔶 Extreme Zone Identification
The system automatically identifies when markets reach statistically significant extreme levels, both moderate (65/35) and extreme (80/20). These zones represent areas where mean reversion has the highest probability of success based on historical market behavior.
🔶 Momentum Histogram Analysis
A specialized momentum histogram tracks the velocity of oscillator changes, helping traders distinguish between healthy corrections and potential trend reversals. The histogram's color-coded display makes momentum shifts immediately apparent.
🔶 Divergence Detection Framework
Built-in divergence analysis identifies situations where price and oscillator movements diverge, often signaling impending reversals. Diamond-shaped markers highlight these critical divergence patterns for enhanced pattern recognition.
🔶 Real-Time Information Dashboard
An integrated information table provides instant access to current oscillator readings, market status, and individual component values. This dashboard eliminates the need to manually check multiple indicators while trading.
🔶 Individual Component Display
Optional display of individual oscillator components allows traders to understand which specific indicators are driving the composite signal. This transparency enables more informed decision-making and deeper market analysis.
🔶 Adaptive Background Coloring
Intelligent background shading automatically adjusts based on market conditions, creating visual zones that correspond to different levels of mean reversion potential. The subtle color gradations make pattern recognition effortless.
1D
3D
🔶 Comprehensive Alert System
Multi-tier alert system covers confirmed entry signals, divergence patterns, and extreme level breaches. Each alert type provides specific context about the detected condition, enabling traders to respond appropriately to different signal strengths.
🔶 Customizable Threshold Management
Fully adjustable extreme and moderate levels allow traders to fine-tune the indicator's sensitivity to match different market volatilities and trading timeframes. This flexibility ensures optimal performance across various market conditions.
🔶 Why Choose AE - Mean Reversion Oscillator?
This indicator provides the most comprehensive approach to mean reversion trading by combining multiple proven oscillators with advanced confirmation mechanisms. By offering clear visual hierarchies for different extreme levels and requiring momentum confirmation for signals, it empowers traders to identify high-probability contrarian opportunities while avoiding false reversals. The sophisticated composite methodology ensures that signals are both statistically significant and practically actionable, making it an essential tool for traders focused on mean reversion strategies across all market conditions.
