BTX27-MAXIndicator Description: BTX27-MAX
The BTX27-MAX is a comprehensive trading indicator designed to provide traders with customizable signals and alerts based on RSI and ATR calculations. It offers both automatic and manual configurations, making it adaptable to various currency pairs and trading styles. The indicator integrates with Telegram for real-time alerts and includes features for trade management and performance tracking.
Key Features:
Customizable Color Themes: Choose between Dark and Light color styles to match your chart preferences.
Automatic or Manual Configuration: Automatically sets optimal parameters for selected currency pairs or allows manual input for personalized settings.
RSI and ATR-Based Signals: Utilizes RSI smoothing and ATR calculations to identify potential trading opportunities.
Automatic SL and TP Levels: Projects customizable Stop-Loss and Take-Profit levels directly on the chart.
Telegram Integration: Sends customized buy or sell alerts with trade details to your Telegram channel.
Day and Time Filters: Allows selection of trading days and specific trading hours for signal generation.
Trade Summary Table: Displays the results of the last three trades (Win/Loss) directly on the chart.
Customizable Alert Messages: Personalize the messages sent to Telegram for both buy and sell signals.
Visual Enhancements: Colors candles based on trend direction and highlights the trading session on the chart.
How Does the Indicator Work?
Color Style Selection:
- Choose between "Dark" or "Light" themes to match your chart setup.
Currency Pair Selection:
- Select from predefined currency pairs: "EURUSD M5", "USDCAD M3", "GBPUSD M9", "XAUUSD M9".
Automatic vs. Manual Configuration:
- Automatic Configuration: When enabled, the indicator automatically sets parameters optimized for the selected currency pair.
- Manual Configuration: Allows you to input your own parameters for RSI period, smoothing factor, liquidity factors, and SL/TP ticks.
Telegram Integration:
- Input your Telegram chat ID to receive real-time alerts when signals are generated.
Trading Days and Hours:
- Customize which days of the week you want to receive signals.
- Set specific trading start and end hours to focus on preferred trading sessions.
Indicator Calculations:
- Calculates RSI and applies smoothing to identify the trend.
- Uses ATR for volatility measurement and to set dynamic liquidity bands.
Signal Generation:
- A Buy Signal is generated when specific RSI and ATR conditions are met.
- A Sell Signal is generated under the opposite conditions.
- Signals are only generated during the specified trading days and hours.
Trade Execution Visuals:
- Automatically draws SL and TP boxes on the chart for each signal.
- Colors candles based on trend direction: bullish, bearish, or neutral.
Telegram Alerts:
- Sends customized messages to your Telegram channel, including trade details like entry price, SL, TP, volatility, and trend direction.
Trade Summary Table:
- Displays the results of the last three trades ("✅ TP" for Take Profit hit, "❌ SL" for Stop Loss hit) on the chart.
How to Use the Indicator?
Setup:
- Add the indicator to your TradingView chart.
- Choose your preferred Color Style (Dark or Light).
- Select the Currency Pair you are trading.
- Decide whether to use Automatic Configuration or input your own settings.
Configure Telegram Alerts:
- Input your Telegram Chat ID to receive alerts.
- Customize the Buy and Sell alert messages if desired.
Set Trading Days and Hours:
- Enable or disable trading on specific days of the week.
- Set your preferred trading session hours.
Monitor Signals:
- Watch for buy or sell labels appearing on the chart.
- Use the SL and TP boxes to plan your trade entries and exits.
Review Trade Performance:
- Check the trade summary table to see the outcomes of recent trades.
What Makes This Indicator Original?
Adaptable Configuration: Offers both automatic and manual settings, making it suitable for traders of all levels and various trading instruments.
Comprehensive Alerts: Provides detailed alerts via Telegram, including custom messages and comprehensive trade information.
Trade Management Tools: Automatically calculates and visualizes SL and TP levels, aiding in effective risk management.
Performance Tracking: Includes an on-chart summary of recent trade results, helping traders assess the indicator's effectiveness over time.
Visual Customization: Enhances chart visuals with color themes, candle coloring, and trading session highlights.
Additional Considerations
Testing and Optimization: Before using the indicator in live trading, test it in a demo account and adjust settings as needed.
Complementary Analysis: Use in conjunction with other technical or fundamental analysis tools to confirm signals.
Risk Management: Ensure that the automatically calculated SL and TP levels align with your risk tolerance and trading strategy.
Market Awareness: Stay informed about economic events that may impact the instruments you are trading.
Example Configuration
Assuming you are trading "EURUSD M5" with Automatic Configuration enabled:
RSI Period: 15
RSI Smoothing Factor: 14
Rapid Liquidity Factor: 2.238
Liquidity Threshold: 15
SL Ticks: 100
TP Ticks: 300
Trading Days: Tuesday, Wednesday, Thursday
Trading Hours: Start at 8:00, End at 10:00
Telegram Chat ID: Your unique Telegram chat ID
Conclusion
The BTX27-MAX indicator is a versatile tool that combines technical analysis with automated trade management and alerting features. Its adaptability through automatic and manual configurations makes it suitable for a wide range of trading styles and instruments. By integrating real-time Telegram alerts and providing on-chart visual aids, it enhances decision-making processes and helps traders manage their trades more effectively.
Ready for immediate use in TradingView, this indicator can be a valuable addition to your trading toolkit.
相對強弱指標(RSI)

Dynamic RSI Mean Reversion StrategyDynamic RSI Mean Reversion Strategy
Overview:
This strategy uses an RSI with ATR-Adjusted OB/OS levels in order to enhance the quality of it's mean reversion trades. It also incorporates a form of trend filtering in an effort to minimize downside and maximize upside. The backtest has fewer trades, as it uses substantial filtering to enhance trade quality. As you can see, I didn't cherry pick the results, so the results aren't the most beautiful thing you'll see in your life. I did this to ensure nobody gets misled. If you need a higher frequency of trades, consider removing the trend filter or increasing the length of the EMAs used for trend detection.
Features:
Dynamic OB/OS Levels: Uses ATR to adjust overbought and oversold thresholds dynamically, making the RSI more responsive in varying volatility conditions. This approach enhances signal strength by expanding the RSI range in high volatility and tightening it in low volatility.
Mean Reversion Focus: Designed for mean reversion but incorporates a trend-following filter to reduce countertrend trades. When the RSI is high, it often indicates an uptrend, so a trend filter prevents shorting in these cases and the same goes for downtrends and longing.
Trend Filtering: A moving average cross trend filter checks for the trend direction, with the RSI signal line color-coded to reflect trend shifts. Entries occur when the RSI crosses above or below the dynamic thresholds and is not a countertrend trade.
Stop Losses: Stop losses are set based on ATR distance from the entry price, providing volatility-adjusted protection.
Note:
If you're using this strategy on assets with a higher price, remember to increase the initial capital in the strategy settings. Otherwise, the strategy won't generate any (or many) trades and you'll end up with some inaccurate results.
Recommended Use:
Test it on different assets and timeframes. I’ve found the best results with standard RSI inputs, a relatively slow ATR, and a slower MA cross for trend filtering. Thus, the defaults are set that way. If the trend metrics are too slow, you’ll filter out too many good trades while allowing crummy ones; if too fast, most trades may be filtered out. As always, this has a lot of configurability so experiment to find the balance that works for your trading style.

Trend IdentifierThe “Trend Identifier” indicator is designed to help traders quickly identify trending and sideways market conditions, allowing them to adapt their strategies based on the prevailing market sentiment. By combining several technical analysis tools—ATR (Average True Range), ADX (Average Directional Index), EMA (Exponential Moving Average), and RSI (Relative Strength Index)—this script provides insights into the market’s strength, direction, and volatility to improve trade decision-making.
How It Works
1. ATR (Average True Range):
• ATR measures market volatility. In this script, ATR is used in combination with a moving average to identify periods of rising or falling volatility, which helps differentiate between trending and non-trending conditions.
2. ADX (Average Directional Index):
• ADX is a key component in identifying the strength of a trend. The script uses a threshold system to classify market conditions:
• If ADX is low (below a specified threshold plus a buffer) and ATR indicates low volatility, the market is likely in a sideways condition.
• If ADX is high (above a threshold minus a buffer) with increasing ATR, the market is likely in a trending condition.
3. EMA (Exponential Moving Average):
• A 20-period EMA is used instead of a simple moving average to enhance trend detection speed. The close price’s position relative to the EMA helps identify bullish or bearish trends when combined with ADX and ATR data.
4. RSI (Relative Strength Index):
• RSI acts as a confirmation tool for trend strength. A bullish trend is confirmed if RSI is above 50 and the price is above the EMA, whereas a bearish trend is confirmed if RSI is below 50 and the price is below the EMA.
Market Condition Signals
• Sideways Signal:
• When ADX and ATR indicate a low-volatility, sideways market, the indicator changes the background color to gray, signaling potential low-trend movement or consolidation. A “S” symbol appears above the bars, making it easier to spot this condition.
• Bullish Trend:
• When conditions favor a strong upward trend, the background changes to green. A “B” symbol is displayed below the bar, indicating the onset of a bullish market condition.
• Bearish Trend:
• Conversely, if conditions indicate a downward trend, the background color changes to red. A “S” symbol is displayed below the bar, showing a bearish trend condition.
Using the Indicator
This indicator helps traders understand the current market structure in a glance:
• Sideways (Gray): Low-volatility consolidation period, ideal for range-bound strategies or waiting for a breakout.
• Bullish (Green): Confirmed uptrend, potentially suitable for buying or long entries.
• Bearish (Red): Confirmed downtrend, ideal for short selling or exiting long positions.
The “Trend Identifier” is a powerful tool for traders who seek a clear view of the market structure, using a balanced approach of volatility, trend strength, and momentum. By combining the power of ATR, ADX, EMA, and RSI, this indicator provides a nuanced picture of the market’s behavior, assisting traders in making more informed decisions.

Stoch RSI and RSI Buy/Sell Signals with MACD Trend FilterDescription of the Indicator
This Pine Script is designed to provide traders with buy and sell signals based on the combination of Stochastic RSI, RSI, and MACD indicators, enhanced by the confirmation of candle colors. The primary goal is to facilitate informed trading decisions in various market conditions by utilizing different indicators and their interactions. The script allows customization of various parameters, providing flexibility for traders to adapt it to their specific trading styles.
Usefulness
This indicator is not just a mashup of existing indicators; it integrates the functionality of multiple momentum and trend-detection methods into a cohesive trading tool. The combination of Stochastic RSI, RSI, and MACD offers a well-rounded approach to analyzing market conditions, allowing traders to identify entry and exit points effectively. The inclusion of color-coded signals (strong vs. weak) further enhances its utility by providing visual cues about the strength of the signals.
How to Use This Indicator
Input Settings: Adjust the parameters for the Stochastic RSI, RSI, and MACD to fit your trading style. Set the overbought/oversold levels according to your risk tolerance.
Signal Colors:
Strong Buy Signal: Indicated by a green label and confirmed by a green candle (close > open).
Weak Buy Signal: Indicated by a blue label and confirmed by a green candle (close > open).
Strong Sell Signal: Indicated by a red label and confirmed by a red candle (close < open).
Weak Sell Signal: Indicated by an orange label and confirmed by a red candle (close < open).
Example Trading Strategy Using This Indicator
To effectively use this indicator as part of your trading strategy, follow these detailed steps:
Setup:
Timeframe : Select a timeframe that aligns with your trading style (e.g., 15-minute for intraday, 1-hour for swing trading, or daily for longer-term positions).
Indicator Settings : Customize the Stochastic RSI, RSI, and MACD parameters to suit your trading approach. Adjust overbought/oversold levels to match your risk tolerance.
Strategy:
1. Strong Buy Entry Criteria :
Wait for a strong buy signal (green label) when the RSI is at or below the oversold level (e.g., ≤ 35), indicating a deeply oversold market. Confirm that the MACD shows a decreasing trend (bearish momentum weakening) to validate a potential reversal. Ensure the current candle is green (close > open) if candle color confirmation is enabled.
Example Use : On a 1-hour chart, if the RSI drops below 35, MACD shows three consecutive bars of decreasing negative momentum, and a green candle forms, enter a buy position. This setup signals a robust entry with strong momentum backing it.
2. Weak Buy Entry Criteria :
Monitor for weak buy signals (blue label) when RSI is above the oversold level but still below the neutral (e.g., between 36 and 50). This indicates a market recovering from an oversold state but not fully reversing yet. These signals can be used for early entries with additional confirmations, such as support levels or higher timeframe trends.
Example Use : On the same 1-hour chart, if RSI is at 45, the MACD shows momentum stabilizing (not necessarily negative), and a green candle appears, consider a partial or cautious entry. Use this as an early warning for a potential bullish move, especially when higher timeframe indicators align.
3. Strong Sell Entry Criteria :
Look for a strong sell signal (red label) when RSI is at or above the overbought level (e.g., ≥ 65), signaling a strong overbought condition. The MACD should show three consecutive bars of increasing positive momentum to indicate that the bullish trend is weakening. Ensure the current candle is red (close < open) if candle color confirmation is enabled.
Example Use : If RSI reaches 70, MACD shows increasing momentum that starts to level off, and a red candle forms on a 1-hour chart, initiate a short position with a stop loss set above recent resistance. This is a high-confidence signal for potential price reversal or pullback.
4. Weak Sell Entry Criteria :
Use weak sell signals (orange label) when RSI is between the neutral and overbought levels (e.g., between 50 and 64). These can indicate potential short opportunities that might not yet be fully mature but are worth monitoring. Look for other confirmations like resistance levels or trendline touches to strengthen the signal.
Example Use : If RSI reads 60 on a 1-hour chart, and the MACD shows slight positive momentum with signs of slowing down, place a cautious sell position or scale out of existing long positions. This setup allows you to prepare for a possible downtrend.
Trade Management:
Stop Loss : For buy trades, place stop losses below recent swing lows. For sell trades, set stops above recent swing highs to manage risk effectively.
Take Profit : Target nearby resistance or support levels, apply risk-to-reward ratios (e.g., 1:2), or use trailing stops to lock in profits as price moves in your favor.
Confirmation : Align these signals with broader trends on higher timeframes. For example, if you receive a weak buy signal on a 15-minute chart, check the 1-hour or daily chart to ensure the overall trend is not bearish.
Real-World Example: Imagine trading on a 15-minute chart :
For a buy:
A strong buy signal (green) appears when the RSI dips to 32, MACD shows declining bearish momentum, and a green candle forms. Enter a buy position with a stop loss below the most recent support level.
Alternatively, a weak buy signal (blue) appears when RSI is at 47. Use this as a signal to start monitoring the market closely or enter a smaller position if other indicators (like support and volume analysis) align.
For a sell:
A strong sell signal (red) with RSI at 72 and a red candle signals to short with conviction. Place your stop loss just above the last peak.
A weak sell signal (orange) with RSI at 62 might prompt caution but can still be acted on if confirmed by declining volume or touching a resistance level.
These strategies show how to blend both strong and weak signals into your trading for more nuanced decision-making.
Technical Analysis of the Code
1. Stochastic RSI Calculation:
The script calculates the Stochastic RSI (stochRsiK) using the RSI as input and smooths it with a moving average (stochRsiD).
Code Explanation : ta.stoch(rsi, rsi, rsi, stochLength) computes the Stochastic RSI, and ta.sma(stochRsiK, stochSmoothing) applies smoothing.
2. RSI Calculation :
The RSI is computed over a user-defined period and checks for overbought or oversold conditions.
Code Explanation : rsi = ta.rsi(close, rsiLength) calculates RSI values.
3. MACD Trend Filter :
MACD is calculated with fast, slow, and signal lengths, identifying trends via three consecutive bars moving in the same direction.
Code Explanation : = ta.macd(close, macdLengthFast, macdLengthSlow, macdSignalLength) sets MACD values. Conditions like macdLine < macdLine confirm trends.
4. Buy and Sell Conditions :
The script checks Stochastic RSI, RSI, and MACD values to set buy/sell flags. Candle color filters further confirm valid entries.
Code Explanation : buyConditionMet and sellConditionMet logically check all conditions and toggles (enableStochCondition, enableRSICondition, etc.).
5. Signal Flags and Confirmation :
Flags track when conditions are met and ensure signals only appear on appropriate candle colors.
Code Explanation : Conditional blocks (if statements) update buyFlag and sellFlag.
6. Labels and Alerts :
The indicator plots "BUY" or "SELL" labels with the RSI value when signals trigger and sets alerts through alertcondition().
Code Explanation : label.new() displays the signal, color-coded for strength based on RSI.
NOTE : All strategies can be enabled or disabled in the settings, allowing traders to customize the indicator to their preferences and trading styles.

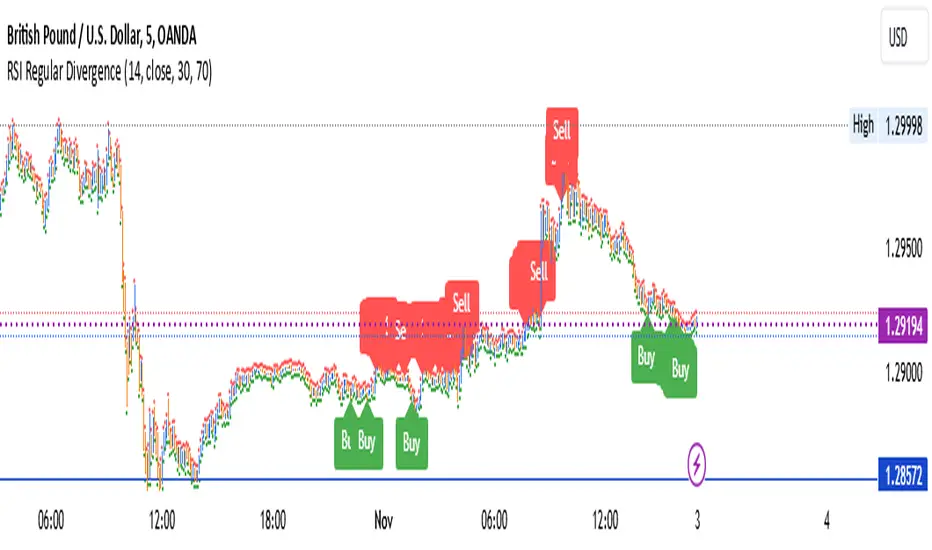
Trade 1 + StatergyThe Relative Strength Index (RSI) is a momentum oscillator used in technical analysis that measures the speed and change of price movements of a security within a range of 0 to 100. It is most commonly set to a 14-period timeframe and helps traders identify overbought or oversold conditions, suggesting potential reversal points in the market. Divergence occurs when the price trend and the RSI trend move in opposite directions. A bullish divergence signals potential upward movement when prices are making new lows while the RSI makes higher lows. Conversely, a bearish divergence suggests a possible downward trend when prices are making new highs but the RSI is making lower highs. These signals are crucial for traders looking to capture shifts in momentum and adjust their trading strategies accordingly.
use full to
5 min
10 min
15 min decition
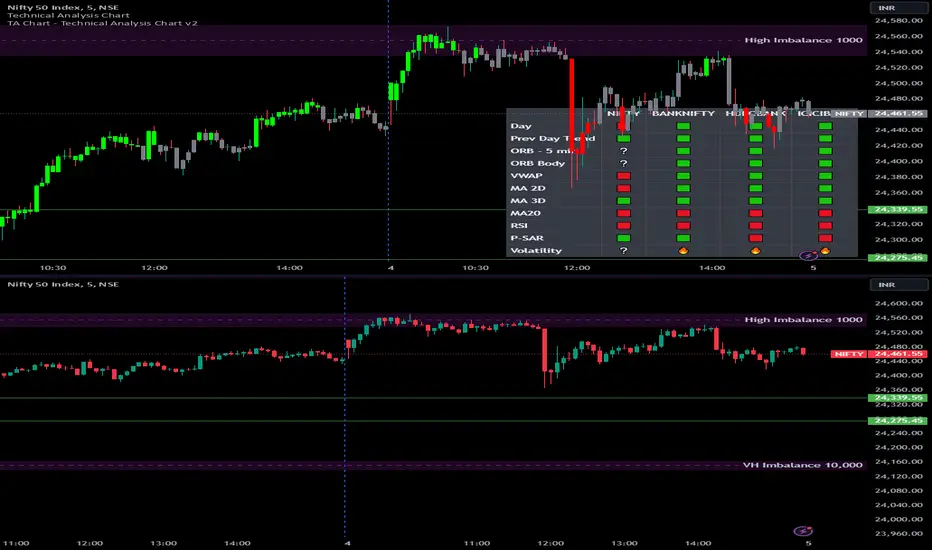
Options Series - Technical Analysis Chart➤ Simple Technical Chart Only:
➤ With MA-20 Overlay and Volatility background bars:
➤ With RSI Candles:
⭐ Overview and How It Works:
This script provides a multi-asset analysis tool to assess various market conditions across four symbols simultaneously. It combines several indicators such as daily price change, Moving Averages (MA), Bollinger Bands (BB), Parabolic SAR, RSI, and VWAP to generate buy/sell signals and trend indicators. Its strength lies in the layered use of indicators to enhance signal reliability, making it valuable for traders needing cross-validation in decision-making.
⭐ Key Features and Functionality:
The script evaluates each symbol's price against various indicators and conditions:
Daily Price Conditions: It checks if each symbol’s close price is above or below the previous day’s open, close, and intra-day ranges, forming a foundational bullish/bearish condition.
Range Breakout 1st 5min Candle (ORB): Opening Range Breakout levels are calculated and compared with current close prices, detecting breakout/breakdown conditions.
ORB Body: This basically calculates the previous day Daily candle body size, if todays Daily candle body size is greater than previous day, then we can say that we are having good momentum else its likely to be in-sidebar trading.
Moving Averages (MA): It leverages EMA-20, 2-day, and 3-day exponential moving averages to gauge short to medium-term trends.
RSI and VWAP: Relative Strength Index (RSI) determines overbought or oversold conditions, while VWAP compares prices to volume-weighted levels.
Bollinger Bands and Trend Analysis: Detects volatility and potential breakout conditions.
Concept of ORB Body:
Current_PrevDay_Body = (math.max(var_Current_PrevD_Open, var_Current_PrevD_Close) - math.min(var_Current_PrevD_Open, var_Current_PrevD_Close))
Current_Upper_ORB = var_Current_D_Open + Current_PrevDay_Body
Current_Lower_ORB = var_Current_D_Open - Current_PrevDay_Body
Current_TodayDay_Body = math.max(var_Current_D_Open, var_Current_Close) - math.min(var_Current_D_Open, var_Current_Close)
Current_ORBBody = Current_TodayDay_Body > Current_PrevDay_Body
Current_Upper_ORB_bull = (var_Current_Close > Current_Upper_ORB)
Current_Lower_ORB_bear = (var_Current_Close < Current_Lower_ORB)
🎨 Visualizations and User Experience:
The script can dynamically display colored backgrounds indicating trends when conditions are met. For example, the bgcolor function changes the background when certain trend-based criteria are satisfied, offering visual cues to users. Additionally, the checkbox input toggles trend bar visualizations, enhancing user experience by providing a quick visual reference without needing to interpret individual data points manually.
RSI-Based Candle Coloring:
➤ The script customizes candle colors based on RSI thresholds, specifically defining upper (60) and lower (40) RSI levels. When the RSI value exceeds the upper threshold, candles are colored as bullish (green), and if it falls below the lower threshold, candles are colored as bearish (red). Neutral RSI values result in a default color (gray).
➤ This setup offers a visually intuitive way to identify potential trend directions based on RSI levels, making it ideal for traders looking to gauge momentum visually.
⭐ Settings and Customization:
With multiple user-configurable inputs, the script allows for tailored analysis. Customizable parameters, such as enabling/disabling trend bars and setting various look-back periods for indicators like Bollinger Bands and Moving Averages, make it adaptable to various trading styles and preferences. It also allows users to modify visual elements like colors and styles, improving flexibility.
⭐ Uniqueness of the Concept:
The unique aspect of this script is its multi-symbol approach combined with complex conditions. By comparing not only one but four symbols simultaneously, it provides a broader market view and allows traders to correlate signals across different assets, offering a potential edge for diversified or comparative strategies. Additionally, the incorporation of ORB and multi-timeframe MAs gives it a robustness often lacking in simpler single-symbol scripts.
🚀 Conclusion:
This script is a powerful multi-indicator tool suited for traders looking for a comparative, multi-symbol analysis. With features like ORB, Bollinger Band-based trend detection, and MA cross-verification, it can assist traders in identifying and validating trend signals across assets. The user-friendly visualizations and customizable settings further enhance its usability, making it versatile for various trading strategies and preferences.
Z-Score RSI StrategyOverview
The Z-Score RSI Indicator is an experimental take on momentum analysis. By applying the Relative Strength Index (RSI) to a Z-score of price data, it measures how far prices deviate from their mean, scaled by standard deviation. This isn’t your traditional use of RSI, which is typically based on price data alone. Nevertheless, this unconventional approach can yield unique insights into market trends and potential reversals.
Theory and Interpretation
The RSI calculates the balance between average gains and losses over a set period, outputting values from 0 to 100. Typically, people look at the overbought or oversold levels to identify momentum extremes that might be likely to lead to a reversal. However, I’ve often found that RSI can be effective for trend-following when observing the crossover of its moving average with the midline or the crossover of the RSI with its own moving average. These crossovers can provide useful trend signals in various market conditions.
By combining RSI with a Z-score of price, this indicator estimates the relative strength of the price’s distance from its mean. Positive Z-score trends may signal a potential for higher-than-average prices in the near future (scaled by the standard deviation), while negative trends suggest the opposite. Essentially, when the Z-Score RSI indicates a trend, it reflects that the Z-score (the distance between the average and current price) is likely to continue moving in the trend’s direction. Generally, this signals a potential price movement, though it’s important to note that this could also occur if there’s a shift in the mean or standard deviation, rather than a meaningful change in price itself.
While the Z-Score RSI could be an insightful addition to a comprehensive trading system, it should be interpreted carefully. Mean shifts may validate the indicator’s predictions without necessarily indicating any notable price change, meaning it’s best used in tandem with other indicators or strategies.
Recommendations
Before putting this indicator to use, conduct thorough backtesting and avoid overfitting. The added parameters allow fine-tuning to fit various assets, but be careful not to optimize purely for the highest historical returns. Doing so may create an overly tailored strategy that performs well in backtests but fails in live markets. Keep it balanced and look for robust performance across multiple scenarios, as overfitting is likely to lead to disappointing real-world results.

XAUUSD 10-Minute StrategyThis XAUUSD 10-Minute Strategy is designed for trading Gold vs. USD on a 10-minute timeframe. By combining multiple technical indicators (MACD, RSI, Bollinger Bands, and ATR), the strategy effectively captures both trend-following and reversal opportunities, with adaptive risk management for varying market volatility. This approach balances high-probability entries with robust volatility management, making it suitable for traders seeking to optimise entries during significant price movements and reversals.
Key Components and Logic:
MACD (12, 26, 9):
Generates buy signals on MACD Line crossovers above the Signal Line and sell signals on crossovers below the Signal Line, helping to capture momentum shifts.
RSI (14):
Utilizes oversold (below 35) and overbought (above 65) levels as a secondary filter to validate entries and avoid overextended price zones.
Bollinger Bands (20, 2):
Uses upper and lower Bollinger Bands to identify potential overbought and oversold conditions, aiming to enter long trades near the lower band and short trades near the upper band.
ATR-Based Stop Loss and Take Profit:
Stop Loss and Take Profit levels are dynamically set as multiples of ATR (3x for stop loss, 5x for take profit), ensuring flexibility with market volatility to optimise exit points.
Entry & Exit Conditions:
Buy Entry: T riggered when any of the following conditions are met:
MACD Line crosses above the Signal Line
RSI is oversold
Price drops below the lower Bollinger Band
Sell Entry: Triggered when any of the following conditions are met:
MACD Line crosses below the Signal Line
RSI is overbought
Price moves above the upper Bollinger Band
Exit Strategy: Trades are closed based on opposing entry signals, with adaptive spread adjustments for realistic exit points.
Backtesting Configuration & Results:
Backtesting Period: July 21, 2024, to October 30, 2024
Symbol Info: XAUUSD, 10-minute timeframe, OANDA data source
Backtesting Capital: Initial capital of $700, with each trade set to 10 contracts (equivalent to approximately 0.1 lots based on the broker’s contract size for gold).
Users should confirm their broker's contract size for gold, as this may differ. This script uses 10 contracts for backtesting purposes, aligned with 0.1 lots on brokers offering a 100-contract specification.
Key Backtesting Performance Metrics:
Net Profit: $4,733.90 USD (676.27% increase)
Total Closed Trades: 526
Win Rate: 53.99%
Profit Factor: 1.44 (1.96 for Long trades, 1.14 for Short trades)
Max Drawdown: $819.75 USD (56.33% of equity)
Sharpe Ratio: 1.726
Average Trade: $9.00 USD (0.04% of equity per trade)
This backtest reflects realistic conditions, with a spread adjustment of 38 points and no slippage or commission applied. The settings aim to simulate typical retail trading conditions. However, please adjust the initial capital, contract size, and other settings based on your account specifics for best results.
Usage:
This strategy is tuned specifically for XAUUSD on a 10-minute timeframe, ideal for both trend-following and reversal trades. The ATR-based stop loss and take profit levels adapt dynamically to market volatility, optimising entries and exits in varied conditions. To backtest this script accurately, ensure your broker’s contract specifications for gold align with the parameters used in this strategy.

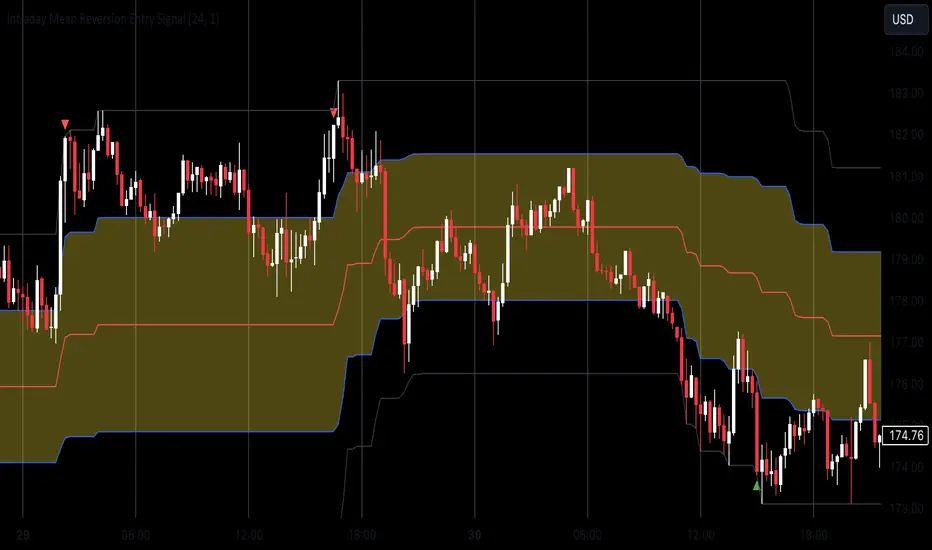
Mean Reversion Entry Signal
Mean Reversion Entry Signal Indicator
The Mean Reversion Entry Signal indicator is a trading tool designed for traders looking to capitalize on market corrections. This script leverages mean reversion principles, utilizing price levels and the Relative Strength Index (RSI) to generate potential entry signals for both long and short positions.
Key Features:
1. **Dynamic Price Levels**:
- The indicator calculates critical price levels over a user-defined lookback period, including:
- High (H)**: The highest price point over the lookback period.
- Low (L)**: The lowest price point over the lookback period.
- Midpoint (M)**: The average of the high and low.
- Midpoint High (Mh)** and **Midpoint Low (Ml)**: Additional reference levels derived from M for more nuanced trading signals.
2. User-Configurable Inputs:
- Lookback Period: Traders can specify the number of hours to look back for the calculations, allowing for tailored analysis that fits various trading strategies. By default the lookback is set for 24 hours, as i consider it the most adequate for day trading.
- Aggression Level: This input lets users choose their trading strategy's intensity, affecting the sensitivity of entry signals based on the percentage difference from the midpoint.
3. Entry Signal Generation:
The script evaluates market conditions to signal potential trades:
- Long Entries: Indicated when the price is below the Ml level and the price demonstrates a significant distance from the midpoint (M), coupled with RSI being near the oversold territory.
- Short Entries: Triggered when the price exceeds the Mh level, also indicating a significant distance from M, while the RSI indicates near overbought conditions.
4. Visual Indicators:
Clear visual signals are plotted directly on the chart:
- Long Signals are represented as upward triangles in green.
- Short Signals appear as downward triangles in red.
- Important price levels (M, H, L, Mh, and Ml) are displayed to provide traders with immediate context for potential trades.
5. No Entry Zone:
The area between Mh and Ml is shaded to indicate a "No Entry Zone," helping traders identify regions where conditions may not be favorable for taking new positions.
This can also be used as potencial profit taking area.
Conclusion
1. This indicator was built mainly for day trading, using timeframes between 1 minute and 1 hour. If you want to use it in 1D time frame, for instance, you should adjust the lookback period to 120 hours or so.
2. To use this as a strategy, you should not be afraid to "add to your losers" as the trade goes against you and the signals continue to appear.
Enjoy
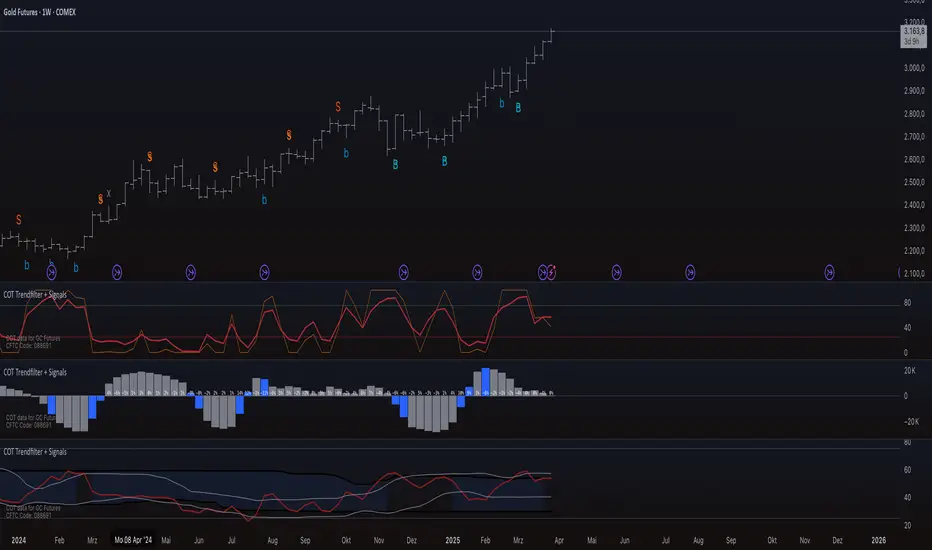
COT Trendfilter + SignalsCOT Trendfilter + Signals Indicator
Data Processing and Usage: The COT indicator processes Commitments of Traders (COT) data provided by the CFTC. Users can select from various participant groups, including Commercials, Large Speculators, and Small Speculators. However, it is important to note that the signal logic of the indicator is exclusively applicable to the net positions of Commercials. This is because Commercials tend to trade contrarily, meaning their trading decisions often run against the prevailing market trend.
Functionality of the Indicators
1. Cycle COT
The cCOT is an enhanced version of the classic RSI. It incorporates additional smoothing based on market vibrations, along with adaptive upper and lower bands based on cyclical memory. The cCOT uses the current dominant cycle length as input and highlights trading signals when the signal line crosses above or below the adaptive bands. Compared to the standard RSI, the cCOT responds more quickly to market movements.
For detailed information on the cCOT, please refer to Chapter 4 "Fine tuning technical indicators" in the book "Decoding the Hidden Market Rhythm, Part 1" by Lars von Thienen.
2. Adaptive Ultra-Smooth Momentum Indicator
The Adaptive Ultra-Smooth Momentum Indicator (CSI) provides an optimized momentum oscillator based on the current dominant cycle. It addresses three common issues with standard indicators: excessive false signals, signal delay, and the need for length adjustments. The CSI offers adaptive smoothing, zero delay, and accurate detection of turning points.
For further information about the CSI, please refer to Chapter 10 "Cycle Swing Indicator: Trading the swing of the dominant cycle" in the book "Decoding the Hidden Market Rhythm, Part 1" by Lars von Thienen.
Signals and Validation
The indicator generates various trading signals:
cCOT:
A buy signal is indicated by an airplane emoji (🛫), while a sell signal is marked by another airplane emoji (🛬).
COT Momentum:
A buy signal is shown by the symbol “∿” in green, while a sell signal is represented by the same symbol in red.
Standard COT Index (Willco):
A buy signal is depicted by a “B” (in green), while a sell signal is shown by an “S” (in red).
Additionally, the validity of the signals is checked. If a previous signal becomes invalid in the following week, it is marked with a gray “x,” indicating that these signals may not be reliable. Users can also switch between net positions, long, and short to analyze the most relevant data for them.
Background Color
The color in the channel can indicate the strength of the Commercials' long-term trend. A channel background color signals an active long-, short-term trend, while no color suggests that there is no clear long-term trend present.
Strange behavior
When only a sharp spike is displayed and the rest is flat, the length settings of the Cycle Length Index should be increased. This can occur when the length is too short, resulting in an unusual spike to properly generate the channel.
Disclaimer
The use of this indicator and the generated signals is at your own risk. The author assumes no responsibility for trading decisions made based on these signals. Please be aware that trading financial instruments involves risks.
Weekly RSI Buy/Sell SignalsWeekly RSI Buy/Sell Signal Indicator
This indicator is designed to help traders identify high-probability buy and sell opportunities on the weekly chart by using the Relative Strength Index (RSI). By utilizing weekly RSI values, this indicator ensures signals align with broader market trends, providing a clearer view of potential price reversals and continuation.
How It Works:
Weekly RSI Calculation: This script calculates the RSI using a 14-period setting, focusing on the weekly timeframe regardless of the user’s current chart view. The weekly RSI is derived using request.security, allowing for consistent signals even on intraday charts.
Signal Conditions:
Buy Signal: A buy signal appears when the RSI crosses above the oversold threshold of 30, suggesting that price may be gaining momentum after a potential bottom.
Sell Signal: A sell signal triggers when the RSI crosses below the overbought threshold of 70, indicating a possible momentum shift downwards.
Visual Cues:
Buy/Sell Markers: Clear green "BUY" and red "SELL" markers are displayed on the chart when buy or sell conditions are met, making it easy to identify entry and exit points.
RSI Line and Thresholds: The weekly RSI value is plotted in real time with color-coded horizontal lines at 30 (oversold) and 70 (overbought), providing a visual reference for key levels.
This indicator is ideal for traders looking for reliable, trend-based signals on higher timeframes and can be a helpful tool for filtering out shorter-term market noise.

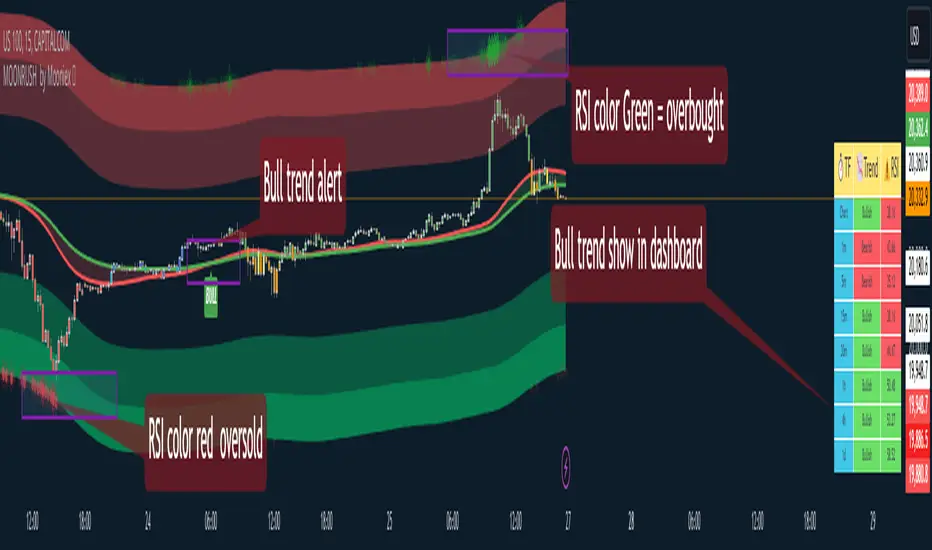
MoonrushCAPITALCOM:US100
Moonrush Indicator - Multi-Timeframe Trend Analysis Tool
Moonrush is a trend analysis tool that helps traders see market trends and identify potential entry or exit points using a combination of Exponential Moving Averages (EMAs) and overbought/oversold signals. The tool has the ability to display data in an easy-to-read dashboard, eliminating the need for users to frequently change charts to get an overview of trends across multiple timeframes.
Key Features and Methods
Multi-Timeframe Trend Analysis:
Moonrush analyzes trends on 1-minute, 5-minute, 15-minute, 30-minute, 1-hour, 4-hour, and 1-day timeframes. It calculates the trend by comparing two user-defined EMA values (EMAfast and EMAslow). If the EMAfast crosses above the EMAslow, it indicates an uptrend (shown in green), while if it crosses below, it indicates a downtrend (shown in red). This allows traders to see the consistency of trends across multiple timeframes.
Customizable Dashboard:
Moonrush provides a dashboard that shows the trend and RSI index for each timeframe, with a table that allows traders to quickly assess market conditions. By displaying the RSI level, it can indicate overbought or oversold conditions. Green is used to indicate overbought conditions, while red is used for oversold conditions.
Overbought/Oversold Color Display:
The dashboard highlights overbought and oversold zones on the support EMA and resistance EMA lines, making it easier for users to identify reversal opportunities.
Key Parameters for Flexibility
EMA Adjustment and Toggle Switch:
Users can adjust the EMAfast and EMAslow parameters to suit their preferences, including turning the EMA display on or off as needed.
Dashboard Customization:
Traders can adjust the size and position of the dashboard to enhance usability, ensuring a clear display without cluttering the chart.
Focus on Risk Management:
Although Moonrush helps in trend detection, users should use this analysis in conjunction with appropriate risk management techniques. It is important to understand how Moonrush works, as the intersection of the EMA and RSI can help identify reversal and continuation patterns. However, users should consider the limitations of this indicator and examine the signals within a broader trading strategy.
How to Use Moonrush
Trend Confirmation:
Check the dashboard to see if trends across multiple timeframes are consistent, to create opportunities to follow or counter the trend.
Identifying Reversals:
Use the overbought and oversold color representations on the EMA support/resistance lines as reversal signals.
Customization:
Adjust the EMA values to your trading style and turn the display on or off as needed.
Moonrush, which combines EMA crossovers and RSI indicators, offers a versatile approach to trend analysis across multiple timeframes. However, traders should note that no single indicator can guarantee success. Users should conduct thorough backtesting and use it in accordance with their personal trading goals and risk tolerance.
##Please note that the tool (Moonrush) is not a guarantee of future market performance and should be used in conjunction with appropriate risk management. Users should ensure that they fully understand the methodology and limitations of the indicator before making any investment decisions. In addition, past performance is not an indication of future results.
Supertrend StrategyThe Supertrend Strategy was created based on the Supertrend and Relative Strength Index (RSI) indicators, widely respected tools in technical analysis. This strategy combines these two indicators to capture market trends with precision and reliability, looking for optimizing exit levels at oversold or overbought price levels.
The Supertrend indicator identifies trend direction based on price and volatility by using the Average True Range (ATR). The ATR measures market volatility by calculating the average range between an asset’s high and low prices over a set period. It provides insight into price fluctuations, with higher ATR values indicating increased volatility and lower values suggesting stability. The Supertrend Indicator plots a line above or below the price, signaling potential buy or sell opportunities: when the price closes above the Supertrend line, an uptrend is indicated, while a close below the line suggests a downtrend. This line shifts as price movements and volatility levels change, acting as both a trailing stop loss and trend confirmation.
To enhance the Supertrend strategy, the Relative Strength Index (RSI) has been added as an exit criterion. As a momentum oscillator, the RSI indicates overbought (usually above 70) or oversold (usually below 30) conditions. This integration allows trades to close when the asset is overbought or oversold, capturing gains before a possible reversal, even if the percentage take profit level has not been reached. This mechanism aims to prevent losses due to market reversals before the Supertrend signal changes.
### Key Features
1. **Entry criteria**:
- The strategy uses the Supertrend indicator calculated by adding or subtracting a multiple of the ATR from the closing price, depending on the trend direction.
- When the price crosses above the Supertrend line, the strategy signals a long (buy) entry. Conversely, when the price crosses below, it signals a short (sell) entry.
- The strategy performs a reversal if there is an open position and a change in the direction of the supertrend occurs
2. **Exit criteria**:
- Take profit of 30% (default) on the average position price.
- Oversold (≤ 5) or overbought (≥ 95) RSI
- Reversal when there is a change in direction of the Supertrend
3. **No Repainting**:
- This strategy is not subject to repainting, as long as the timeframe configured on your chart is the same as the supertrend timeframe .
4. **Position Sizing by Equity and risk management**:
- This strategy has a default configuration to operate with 35% of the equity. At the time of opening the position, the supertrend line is typically positioned at about 12 to 16% of the entry price. This way, the strategy is putting at risk about 16% of 35% of equity, that is, around 5.6% of equity for each trade. The percentage of equity can be adjusted by the user according to their risk management.
5. **Backtest results**:
- This strategy was subjected to deep backtesting and operations in replay mode, including transaction fees of 0.12%, and slippage of 5 ticks.
- The past results in deep backtest and replay mode were compatible and profitable (Variable results depending on the take profit used, supertrend and RSI parameters). However, it should be noted that few operations were evaluated, since the currency in question has been created for a short time and the frequency of operations is relatively small.
- Past results are no guarantee of future results. The strategy's backtest results may even be due to overfitting with past data.
Default Settings
Chart timeframe: 2h
Supertrend Factor: 3.42
ATR period: 14
Supertrend timeframe: 2 h
RSI timeframe: 15 min
RSI Lenght: 5 min
RSI Upper limit: 95
RSI Lower Limit: 5
Take Profit: 30%
BYBIT:1000000MOGUSDT.P

Machine Learning RSI Bands"Machine Learning RSI Bands" Indicator
The "Machine Learning RSI Bands" (MLRSIB) indicator leverages advanced algorithmic analysis to enhance traditional RSI strategies:
RSI Customization: Users can customize the RSI settings including source, length, and thresholds for overbought/oversold conditions.
Innovative Machine Learning Application: The script uses a proprietary function FOUNDATION_400x10x2 from the 'FOUNDATION' library, which analyzes the last 400 occurrences of data points, considering various market dynamics like volume changes or RSI movements based on the selected sampling method. Outputs four optimal outcomes for both upper and lower band conditions, representing the most statistically significant patterns or predictions.
Dynamic Band Visualization: Plots the average of these four outcomes as colored lines (red for the upper band, green for the lower band) on the chart, serving as dynamic support and resistance or overbought/oversold levels.
Signal Plotting: Displays triangles above or below the bars to signal potential short or long entries when the RSI crosses these machine learning-adjusted bands under certain confidence conditions.
Market Volatility Indicator: Adjusts the chart's background color based on volatility, using an average deviation analysis to gauge market calmness or agitation.
Alert System: Provides alert conditions for when these sophisticated signals are triggered, allowing for timely trading actions.
This indicator is designed for traders interested in combining traditional technical analysis with machine learning to refine their market entry and exit strategies, focusing on patterns identified from recent market behavior.
Atr Target TP & Protecion Zone [Pinescriptlabs]This indicator provides an adaptive trailing stop system with dynamic price targets and protection zones, ideal for position management.
Main Features:
🚦 ADAPTIVE TRAILING STOP:
Automatically adjusts based on volatility (ATR) and volume
Two modes: "Modified" and "UnModified" for true range calculation
Displayed as a line with colored background (green for longs, red for shorts)
🎯 TARGET ZONES (T1 & T2):
Calculates two target zones (T1 and T2) based on:
Market strength (combination of RSI, volume, MFI, ADX, MACD)
Current volatility (ATR)
Distance from current price
Visualized with blue boxes (T1) and purple boxes (T2)
🛡️ PROTECTION ZONE:
Automatically activates in sideways markets
Provides an additional buffer to the trailing stop
Helps avoid premature exits in volatile markets
📊 INFORMATION PANELS:
Top Right Panel displays:
Current trend direction
Target status (T1 & T2)
Market strength
Current ATR
RSI level
Bottom Right Panel displays:
Trailing status (WIDE/NORMAL)
Volume impact
Directional strength
Protection zone status
Español:
Este indicador proporciona un sistema de trailing stop adaptativo con objetivos de precio dinámicos y zonas de protección, ideal para la gestión de posiciones.
**Características Principales**:
🚦 **TRAILING STOP ADAPTATIVO**:
- Se ajusta automáticamente según la volatilidad (ATR) y el volumen
- Dos modos: "Modified" y "UnModified" para el cálculo del rango verdadero
- Se visualiza como una línea con fondo coloreado (verde para largos, rojo para cortos)
🎯 **ZONAS OBJETIVO (T1 y T2)**:
- Calcula dos zonas objetivo (T1 y T2) basadas en:
- Fuerza del mercado (combinación de RSI, volumen, MFI, ADX, MACD)
- Volatilidad actual (ATR)
- Distancia al precio actual
- Visualización mediante cajas azules (T1) y moradas (T2)
🛡️ **ZONA DE PROTECCIÓN**:
- Se activa automáticamente en mercados laterales
- Proporciona un buffer adicional al trailing stop
- Ayuda a evitar salidas prematuras en mercados volátiles
📊 **PANELES INFORMATIVOS**:
*Panel Superior Derecho* muestra:
- Dirección de la tendencia actual
- Estado de los objetivos (T1 y T2)
- Fuerza del mercado
- ATR actual
- Nivel de RSI
*Panel Inferior Derecho* muestra:
- Estado del trailing (WIDE/NORMAL)
- Impacto del volumen
- Fuerza direccional
- Estado de la zona de protección

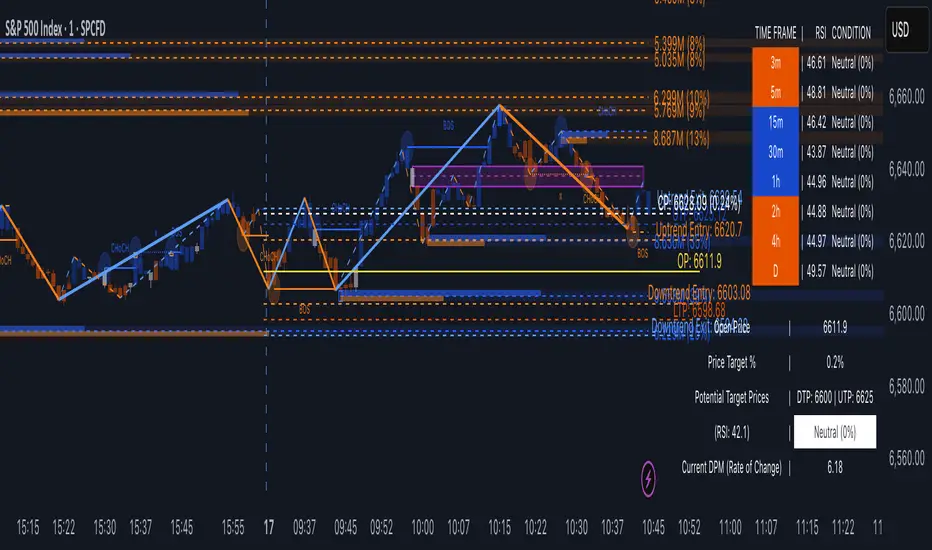
TrendVizPro (BETA)The provided script is a Pine Script code designed for TradingView that creates a sophisticated technical indicator known as “TrendVizPro (BETA).” This script performs advanced trend analysis using various tools, including candle patterns, RSI (Relative Strength Index), simple moving averages (SMA), previous-day price levels, and multi-timeframe analysis.
Key Features:
Candle Style Selection: Users can choose between traditional candlesticks or Heiken Ashi candlesticks for better visualization of trends.
Trend Identification:
Uptrend, Downtrend, and Neutral Trend conditions are determined using smoothed Heiken Ashi candles and the relationship between short and long SMAs.
The script highlights trends using customizable colors (green for uptrend, red for downtrend, white for neutral).
RSI Calculation:
Calculates the RSI and indicates overbought/oversold market conditions with visual signals.
Customizable RSI lengths, overbought/oversold levels, and associated colors.
Price Targeting System:
Automatically calculates potential price targets based on historical volatility, which can be overridden manually.
Upper and lower target price lines can be plotted, showing where the price might move based on historical data or user-defined percentages.
Multi-Timeframe Analysis:
A table is displayed that shows the RSI, trend, and condition (overbought, oversold, or neutral) across various timeframes (3m, 5m, 15m, 30m, 1h, 2h, 4h, Daily).
The table adapts dynamically based on the data for each timeframe.
Previous Day’s High, Low, and Average:
Plots lines representing the previous day’s high, low, and average price levels.
The midpoint between these values is also plotted for additional context.
Trading Signals:
Long and short trading signals are generated based on the trend’s strength and direction.
Exit signals are plotted to indicate potential points to exit trades.
How to Use:
Input Settings:
Candle Style: Select “Traditional Candle” or “Super Trend Heiken Ashi Candle” to choose how price data is visualized.
Trend Colors: Customize the colors for different trend conditions (Uptrend, Neutral, Downtrend).
RSI Settings: Adjust the RSI length, overbought/oversold levels, and corresponding signal colors.
Price Target: Toggle the autopilot mode to use historical data to calculate potential price targets, or manually input a percentage for custom target prices.
Table and Signal Visibility: Decide whether to display the multi-timeframe analysis table, open price, previous day levels, and various trading signals (long, short, exit).
Analyzing the Chart:
When applied to a chart, the indicator plots different price levels (open price, previous day levels, target prices) using lines.
The current trend is displayed via candle colors, and uptrend/downtrend signals are shown on the chart using arrows (long or short positions).
The multi-timeframe table provides a quick overview of trend and RSI conditions for different timeframes.
Signal Use:
Long Signals: Indicated by green arrows below bars, suggesting a strong uptrend.
Short Signals: Indicated by red arrows above bars, signaling a strong downtrend.
Exit Signals: Marked with X symbols, indicating when to consider exiting a long or short position.
Trend Entry and Exit:
Trend Entry/Exit Lines: When activated, orange lines mark optimal trend entry points, and blue lines show potential trend exit points.
Customizable Visuals:
The background color and plot styles (dashed lines, solid lines, labels) are customizable to make the chart more visually distinct and easy to interpret.
Advanced Use Cases:
Multi-Timeframe Traders: Use the multi-timeframe analysis table to check how trends and RSI values behave across different intervals, helping to identify key support/resistance levels or trend continuation points.
Intraday Trading: The script is highly effective for day traders, as it allows visualization of important intraday levels, such as previous highs/lows and current trend conditions.
Swing Trading: Swing traders can leverage the autopilot price target feature to identify optimal exit points based on historical price behavior.
Conclusion:
This indicator is a comprehensive tool designed for traders seeking to automate their trend and signal analysis. With flexible settings, it can cater to multiple trading styles, from scalping to swing trading, all within the TradingView platform.
RSI from Rolling VWAP [CHE]Introducing the RSI from Rolling VWAP Indicator
Elevate your trading strategy with the RSI from Rolling VWAP —a cutting-edge indicator designed to provide unparalleled insights and enhance your decision-making on TradingView. This advanced tool seamlessly integrates the Relative Strength Index (RSI) with a Rolling Volume-Weighted Average Price (VWAP) to deliver precise and actionable trading signals.
Why Choose RSI from Rolling VWAP ?
- Clear Trend Detection: Our enhanced algorithms ensure accurate identification of bullish and bearish trends, allowing you to capitalize on market movements with confidence.
- Customizable Time Settings: Tailor the time window in days, hours, and minutes to align perfectly with your unique trading strategy and market conditions.
- Flexible Moving Averages: Select from a variety of moving average types—including SMA, EMA, WMA, and more—to smooth the RSI, providing clearer trend analysis and reducing market noise.
- Threshold Alerts: Define upper and lower RSI thresholds to effortlessly spot overbought or oversold conditions, enabling timely and informed trading decisions.
- Visual Enhancements: Enjoy a visually intuitive interface with color-coded RSI lines, moving averages, and background fills that make interpreting market data straightforward and efficient.
- Automatic Signal Labels: Receive immediate bullish and bearish labels directly on your chart, signaling potential trading opportunities without the need for constant monitoring.
Key Features
- Inspired by Proven Tools: Building upon the robust foundation of TradingView's Rolling VWAP, our indicator offers enhanced functionality and greater precision.
- Volume-Weighted Insights: By incorporating volume into the VWAP calculation, gain a deeper understanding of price movements and market strength.
- User-Friendly Configuration: Easily adjust settings to match your trading preferences, whether you're a novice trader or an experienced professional.
- Hypothesis-Driven Analysis: Utilize hypothetical results to backtest strategies, understanding that past performance does not guarantee future outcomes.
How It Works
1. Data Integration: Utilizes the `hlc3` (average of high, low, and close) as the default data source, with customization options available to suit your trading needs.
2. Dynamic Time Window: Automatically calculates the optimal time window based on an auto timeframe or allows for fixed time periods, ensuring flexibility and adaptability.
3. Rolling VWAP Calculation: Accurately computes the Rolling VWAP by balancing price and volume over the specified time window, providing a reliable benchmark for price action.
4. RSI Analysis: Measures momentum through RSI based on Rolling VWAP changes, smoothed with your chosen moving average for enhanced trend clarity.
5. Actionable Signals: Detects and labels bullish and bearish conditions when RSI crosses predefined thresholds, offering clear indicators for potential market entries and exits.
Seamless Integration with Your TradingView Experience
Adding the RSI from Rolling VWAP to your TradingView charts is straightforward:
1. Add to Chart: Simply copy the Pine Script code into TradingView's Pine Editor and apply it to your desired chart.
2. Customize Settings: Adjust the Source Settings, Time Settings, RSI Settings, MA Settings, and Color Settings to align with your trading strategy.
3. Monitor Signals: Watch for RSI crossings above or below your set thresholds, accompanied by clear labels indicating bullish or bearish trends.
4. Optimize Your Trades: Leverage the visual and analytical strengths of the indicator to make informed buy or sell decisions, maximizing your trading potential.
Disclaimer:
The content provided, including all code and materials, is strictly for educational and informational purposes only. It is not intended as, and should not be interpreted as, financial advice, a recommendation to buy or sell any financial instrument, or an offer of any financial product or service. All strategies, tools, and examples discussed are provided for illustrative purposes to demonstrate coding techniques and the functionality of Pine Script within a trading context.
Any results from strategies or tools provided are hypothetical, and past performance is not indicative of future results. Trading and investing involve high risk, including the potential loss of principal, and may not be suitable for all individuals. Before making any trading decisions, please consult with a qualified financial professional to understand the risks involved.
By using this script, you acknowledge and agree that any trading decisions are made solely at your discretion and risk.
Get Started Today
Transform your trading approach with the RSI from Rolling VWAP indicator. Experience the synergy of momentum and volume-based analysis, and unlock the potential for more accurate and profitable trades.
Download now and take the first step towards a more informed and strategic trading journey!
For further inquiries or support, feel free to contact
Best regards
Chervolino
Inspired by the acclaimed Rolling VWAP by TradingView

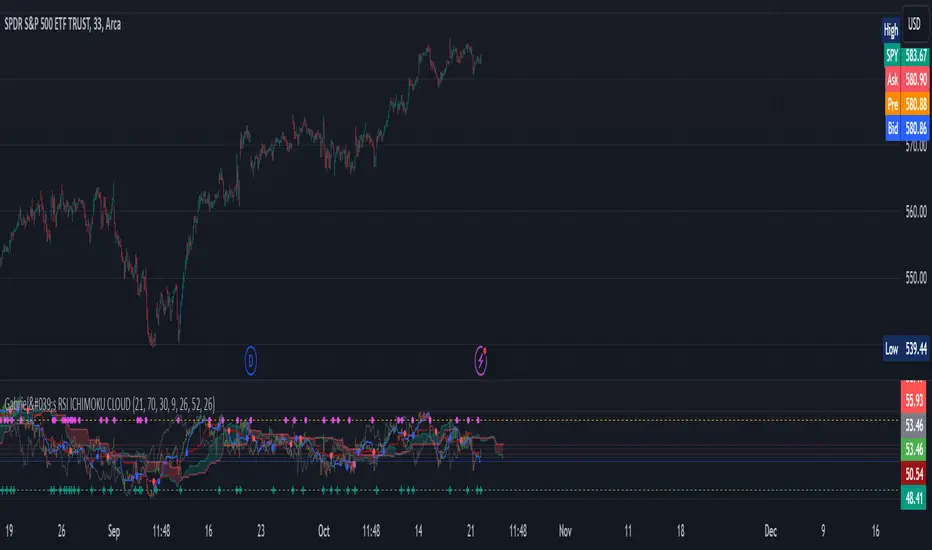
Gabriel's RSI ICHIMOKU CLOUDThe RSI Ichimoku Cloud combines the strengths of the Relative Strength Index (RSI) with the Ichimoku Cloud, offering a robust visualization of momentum and trend signals. This indicator helps traders identify potential trend reversals and key support/resistance levels by blending RSI with the Ichimoku Cloud components.
Key Features:
RSI Component:
Uses a customizable RSI length (default: 21) to detect overbought and oversold conditions.
Upper and Lower Bands (70 and 30) are plotted as dashed lines, highlighting critical zones of strength and weakness.
Bullish (green) and Bearish (red) cross signals are provided when RSI crosses key levels.
Ichimoku Cloud:
Conversion Line (Tenkan Sen): A 9-period Donchian channel (default), representing short-term price movements. Plotted in blue.
Base Line (Kijun Sen): A 26-period Donchian channel (default), representing mid-term price movements. Plotted in red.
Leading Span A (Senkou Span A): The average of the Conversion Line and Base Line, projected forward (displacement: 26). Plotted in green with transparency.
Leading Span B (Senkou Span B): A 52-period Donchian channel (default), projected forward (displacement: 26). Plotted in red with transparency.
The cloud fill between Senkou Span A and B changes color based on bullish (green) or bearish (red) cloud conditions.
Candlestick Overlay:
The indicator uses RSI values to color-code candlesticks. Bullish candles (RSI > Conversion Line) are green, and bearish candles (RSI < Conversion Line) are red.
Signal Crossovers:
RSI-Based Signals: Bullish and Bearish RSI crossovers with the Base Line trigger visual markers.
Ichimoku Signals: Bullish and Bearish crossovers between the Conversion Line and Base Line provide additional trade signals.
Alerts:
Alerts are triggered based on crossovers, allowing traders to set notifications for key trend changes.
This indicator is ideal for traders looking for a powerful blend of momentum (RSI) and trend-following (Ichimoku) tools in one place, with customizable settings for precise trade entry and exit signals.
Savitzky Golay Median Filtered RSI [BackQuant]Savitzky Golay Median Filtered RSI
Introducing BackQuant's Savitzky Golay Median Filtered RSI, a cutting-edge indicator that enhances the classic Relative Strength Index (RSI) by applying both a Savitzky-Golay filter and a median filter to provide smoother and more reliable signals. This advanced approach helps reduce noise and captures true momentum trends with greater precision. Let’s break down how the indicator works, the features it offers, and how it can improve your trading strategy.
Core Concept: Relative Strength Index (RSI)
The Relative Strength Index (RSI) is a widely used momentum oscillator that measures the speed and change of price movements. It oscillates between 0 and 100, with levels above 70 typically indicating overbought conditions and levels below 30 indicating oversold conditions. However, the standard RSI can sometimes generate noisy signals, especially in volatile markets, making it challenging to identify reliable entry and exit points.
To improve upon the traditional RSI, this indicator introduces two powerful filters: the Savitzky-Golay filter and a median filter.
Savitzky-Golay Filter: Smoothing with Precision
The Savitzky-Golay filter is a digital filtering technique used to smooth data while preserving important features, such as peaks and trends. Unlike simple moving averages that can distort important price data, the Savitzky-Golay filter uses polynomial regression to fit the data, providing a more accurate and less lagging result.
In this script, the Savitzky-Golay filter is applied to the RSI values to smooth out short-term fluctuations and provide a more reliable signal. By using a window size of 5 and a polynomial degree of 2, the filter effectively reduces noise without compromising the integrity of the underlying price movements.
Median Filter: Reducing Outliers
After applying the Savitzky-Golay filter, the median filter is applied to the smoothed RSI values. The median filter is particularly effective at removing short-lived outliers, further enhancing the accuracy of the RSI by reducing the impact of sudden and temporary price spikes or drops. This combination of filters creates an ultra-smooth RSI that is better suited for detecting true market trends.
Long and Short Signals
The Savitzky Golay Median Filtered RSI generates long and short signals based on user-defined threshold levels:
Long Signals: A long signal is triggered when the filtered RSI exceeds the Long Threshold (default set at 176). This indicates that momentum is shifting upward, and it may present a good buying opportunity.
Short Signals: A short signal is generated when the filtered RSI falls below the Short Threshold (default set at 162). This suggests that momentum is weakening, potentially signaling a selling opportunity or exit from a long position.
These threshold levels can be adjusted to suit different market conditions and timeframes, allowing traders to fine-tune the sensitivity of the indicator.
Customization and Visualization Options
The Savitzky Golay Median Filtered RSI comes with several customization options, enabling traders to tailor the indicator to their specific needs:
Calculation Source: Select the price source for the RSI calculation (default is OHLC4, but it can be changed to close, open, high, or low prices).
RSI Period: Adjust the lookback period for the RSI calculation (default is 14).
Median Filter Length: Control the length of the median filter applied to the smoothed RSI, affecting how much noise is removed from the signal.
Threshold Levels: Customize the long and short thresholds to define the sensitivity for generating buy and sell signals.
UI Settings: Choose whether to display the RSI and thresholds on the chart, color the bars according to trend direction, and adjust the line width and colors used for long and short signals.
Visual Feedback: Color-Coded Signals and Thresholds
To make the signals easier to interpret, the indicator offers visual feedback by coloring the price bars and the RSI plot according to the current market trend:
Green Bars indicate long signals when momentum is bullish.
Red Bars indicate short signals when momentum is bearish.
Gray Bars indicate neutral or undecided conditions when no clear signal is present.
In addition, the Long and Short Thresholds can be plotted directly on the chart to provide a clear reference for when signals are triggered, allowing traders to visually gauge the strength of the RSI relative to its thresholds.
Alerts for Automation
For traders who prefer automated notifications, the Savitzky Golay Median Filtered RSI includes built-in alert conditions for long and short signals. You can configure these alerts to notify you when a buy or sell condition is met, ensuring you never miss a trading opportunity.
Trading Applications
This indicator is versatile and can be used in a variety of trading strategies:
Trend Following: The combination of Savitzky-Golay and median filtering makes this RSI particularly useful for identifying strong trends without being misled by short-term noise. Traders can use the long and short signals to enter trades in the direction of the prevailing trend.
Reversal Trading: By adjusting the threshold levels, traders can use this indicator to spot potential reversals. When the RSI moves from overbought to oversold levels (or vice versa), it may signal a shift in market direction.
Swing Trading: The smoothed RSI provides a clear signal for short to medium-term price movements, making it an excellent tool for swing traders looking to capitalize on momentum shifts.
Risk Management: The filtered RSI can be used as part of a broader risk management strategy, helping traders avoid false signals and stay in trades only when the momentum is strong.
Final Thoughts
The Savitzky Golay Median Filtered RSI takes the classic RSI to the next level by applying advanced smoothing techniques that reduce noise and improve signal reliability. Whether you’re a trend follower, swing trader, or reversal trader, this indicator provides a more refined approach to momentum analysis, helping you make better-informed trading decisions.
As with all indicators, it is important to backtest thoroughly and incorporate sound risk management strategies when using the Savitzky Golay Median Filtered RSI in your trading system.
Thus following all of the key points here are some sample backtests on the 1D Chart
Disclaimer: Backtests are based off past results, and are not indicative of the future.
INDEX:BTCUSD
INDEX:ETHUSD
BINANCE:SOLUSD

DYNAMIC USD MOMENTUM INDICATOR
Hello traders,
Welcome to my script, an indicator helping you to quickly see the performance of USD in constant daily comparison to other currencies.
This script requests price data from other charts but displays overbought and oversold labels on any selected chart currency pair.
See attached images to spot high probability reversal days when USD is in extremes against multiple other currencies. The output labels represent the currency traded against USD and reaching overbought and oversold zoned on a dynamic RSI scale.
Suggested pairs with higher co relation to stronger or weaker dollar:
AUD/USD, CAD/USD, EUR/USD, GBP/USD, NZD/USD
CHF/USD and JPY/USD require more in depth analysis of individual performance of JPY AND CHF

Multi RSIDynamically display RSIs for current timeframe, 1 min, 5 min, 15 min, 30 min, 1 hour, 4 hour, 1 day, 1 week, and 1 month timeframes.
Lower timeframe RSIs that are too far below the current timeframe will be automatically hidden. E.g., 1 min RSI isn't displayed above 5 minute timeframe and 5 min RSI isn't displayed above 15 minute timeframe.
If RSI for current timeframe is enabled, it will be hidden if the current timeframe is 1 min, 5 min, 15 min, 30 min, 1 hour, 4 hour, 1 day, 1 week, or 1 month and the RSI for that timeframe is already shown.
Can display divergences and moving average if there is an RSI shown that is the same timeframe as the chart timeframe.
Can enable alerts for when RSI(s) are very overbought (greater than or equal to 80), overbought (greater than or equal to 70), oversold (less than or equal to 30), and very oversold (less than or equal to 20).

RSI Crossover and ADX oscillator [deepakks444]RSI Crossover and ADX Oscillator
The RSI Crossover and ADX Oscillator is a custom indicator designed to help traders identify potential trend reversals and trend strength by analyzing the Relative Strength Index (RSI) across multiple timeframes, combined with the Average Directional Index (ADX) to measure the momentum of a trend. This indicator provides a more comprehensive view of the market, allowing traders to spot possible entry and exit points based on multiple signals and conditions.
How the Script Works:
1. Multi-Timeframe RSI Calculation:
This indicator calculates the RSI for three different timeframes:
RSI 1 (default: 15 minutes)
RSI 2 (default: 1 hour)
RSI 3 (default: Daily)
By comparing the RSI across multiple timeframes, traders can gauge both short-term and longer-term momentum. For example, if the shorter timeframe RSI is moving in the same direction as the longer timeframe RSI, it may confirm the strength of the trend. Conversely, if they diverge, it could signal a potential reversal or weakening of the trend.
Each RSI value can also be smoothed using a variety of smoothing methods (SMA, EMA, WMA, RMA) to reduce noise and produce cleaner signals.
2. RSI Smoothing Options:
The smoothing function helps make RSI readings clearer by filtering out short-term fluctuations. This can be useful in volatile markets where small movements can trigger false signals. The user can select the preferred smoothing method (or choose none) and set the smoothing factor to control the sensitivity of the RSI line.
None: No smoothing applied.
SMA (Simple Moving Average): Averages RSI over a specified period, providing a more straightforward trend line.
EMA (Exponential Moving Average): Puts more weight on recent data points, making the trend line more responsive to recent price movements.
WMA (Weighted Moving Average): A weighted average that emphasizes more recent values.
RMA (Running Moving Average): Another smoothing option similar to SMA but with different calculation properties.
3. ADX Trend Strength Measurement:
The Average Directional Index (ADX) is used to measure the strength of a trend, regardless of its direction. ADX is a widely used tool to confirm whether the market is trending strongly or if the market is in a sideways range.
ADX > 25: Indicates a strong trend.
ADX < 25: Indicates a weak trend or range-bound market.
In this script, the color of the ADX line changes dynamically based on whether the trend is strengthening (green) or weakening (red). This allows traders to quickly assess whether the market conditions are favorable for trend-following strategies.
4. Divergence Detection:
The script includes an option to detect regular bullish and bearish divergence between price and RSI. Divergence occurs when price moves in one direction but RSI moves in the opposite direction, which may indicate that the current trend is weakening and could be about to reverse.
Bullish Divergence: Occurs when the price makes a lower low, but the RSI makes a higher low. This could signal a potential upward reversal.
Bearish Divergence: Occurs when the price makes a higher high, but the RSI makes a lower high. This could signal a potential downward reversal.
These divergence signals help traders spot potential reversal points before they become obvious on the price chart itself.
5. No-Trade Zone:
The no-trade zone is an important feature of this script. It highlights the range between RSI 40 and 60, which represents a neutral or indecisive market condition. When the RSI is within this range, it indicates that the market lacks clear directional momentum, making it a riskier environment for trend-following trades. The script shades this region on the chart, visually warning traders to avoid initiating trades during these periods.
Visual Table Display:
To improve clarity, the script includes a table that shows key values directly on the chart:
RSI 1 (15-minute): Displays the current RSI value for the 15-minute timeframe.
RSI 2 (1-hour): Displays the current RSI value for the 1-hour timeframe.
RSI 3 (Daily): Displays the current RSI value for the Daily timeframe.
ADX: Displays the current ADX value, with color-coding to show whether the trend is strengthening (green) or weakening (red).
Long/Short Signal: This final cell in the table shows whether a potential Long or Short signal is currently active based on RSI crossovers and ADX strength.
The table can be repositioned on the chart according to user preference (Top Right, Top Left, Bottom Right, Bottom Left).
Possible Entry and Exit Points:
Long Entry Criteria:
RSI 1 crosses above RSI 2.
RSI 1 is above its 9-period moving average (to confirm upward momentum).
When these conditions are met, the script will display a potential Long signal in the table, and an alert will be triggered if enabled.
Note : ADX is rising, indicating that the trend strength is increasing. ADX is falling, indicating that the trend is weakening.
Short Entry Criteria:
RSI 1 (15-minute) crosses below RSI 2 (1-hour).
RSI 1 is below its 9-period moving average (to confirm downward momentum).
Note : ADX is rising, indicating that the trend strength is increasing. ADX is falling, indicating that the trend is weakening.
When these conditions are met, the script will display a potential Short signal in the table, and an alert will be triggered if enabled.
Exit Criteria:
Exit a Long position when a Short signal is generated or when a yellow candle appears, which indicates that momentum is weakening.
Exit a Short position when a Long signal is generated or when a yellow candle appears.
Customizable Inputs:
This script offers several customization options for users:
RSI Length and Timeframes:
Adjust the length of the RSI calculation and the timeframes for each RSI (default: 15-minute, 1-hour, Daily). This allows traders to tailor the script to different market conditions and assets.
Smoothing Method:
Choose how the RSI values are smoothed (None, SMA, EMA, WMA, RMA) and adjust the smoothing factor.
ADX Settings:
Toggle the ADX on/off, and adjust the smoothing factor and DI length to match your preferred trend strength calculation.
Divergence Detection:
Enable or disable divergence detection and set the range of bars for detecting divergence patterns.
Table Position:
Change the location of the table on the chart (Top Right, Top Left, Bottom Right, Bottom Left).
Note : I have used RSI 1 = 3 Minutes, RSI 2 = 15 Minutes and RSI 3 = 1 Hour as input in the shown chart.
Important Notes:
This script is intended for educational purposes only. It is designed to help traders learn how to combine RSI and ADX to analyze trends and momentum, but it should not be used as financial advice or a guaranteed trading strategy.
Always test the script in a demo environment before using it in live trading to understand how it behaves with different assets and timeframes.
Proper risk management and additional confirmations should be used alongside this indicator for effective trading.

RSI with Dynamic ColorsThe "RSI with Dynamic Colors" is a custom indicator built on top of the traditional Relative Strength Index (RSI), which helps traders identify overbought or oversold market conditions. This enhanced version includes added functionality like dynamic colors, highlighting specific conditions, and more customization options. Here's a breakdown of how this indicator works:
Indicator Components:
Relative Strength Index (RSI) Calculation:
The RSI is a momentum oscillator that measures the speed and change of price movements. It oscillates between 0 and 100, helping traders determine if an asset is overbought or oversold.
In this version, the RSI is calculated with a configurable lookback period (default is 14) and applies smoothing to both upward and downward price changes using the Relative Moving Average (RMA).
Dynamic Coloring:
The indicator dynamically changes the color of the RSI line based on its value. Specific thresholds include:
Blue: When the RSI is at or above an extreme overbought level (≥ 85).
Red: When the RSI is in the overbought zone (≥ 70 but < 85).
Yellow: When the RSI is at or below the extreme oversold level (≤ 15).
Green: When the RSI is in the oversold zone (≤ 30 but > 15).
White: When the RSI is between the oversold and overbought zones.
Moving Average Options (MA):
The indicator allows the user to plot an optional moving average of the RSI for additional trend confirmation. Users can select from various types of moving averages, including Simple Moving Average (SMA), Exponential Moving Average (EMA), and others.
Bollinger Bands can be optionally applied around the RSI to visualize volatility.
Overbought and Oversold Highlights:
It provides visual highlights (green for overbought and red for oversold) in the background of the RSI plot, making it easier to identify potential reversal zones.
Divergence Detection (Optional):
The indicator can optionally display regular bullish or bearish divergence, which can signal potential trend reversals. Divergence occurs when price moves in the opposite direction of the RSI.
Bullish divergence is indicated when the price makes lower lows while the RSI makes higher lows.
Bearish divergence is shown when the price makes higher highs while the RSI makes lower highs.
Alerts:
Users can set up alerts for bullish or bearish divergence, making it easier to get notified when key conditions occur in the market.
Use Case:
This custom RSI indicator is designed for traders who want to combine the classic RSI functionality with enhanced visual aids, such as color coding for different RSI zones, customizable moving averages, and Bollinger Bands. It is particularly useful for identifying potential market tops and bottoms by highlighting overbought/oversold conditions and divergence signals.
In summary, this indicator not only retains the traditional RSI's power but also adds new layers of insight through color, moving averages, and divergence detection, helping traders make better-informed decisions.
