Swing Trade AL/SAT + Güç Derecesi_huğurlu
Weak signal → MACD crossover only.
Moderate signal → MACD crossover + RSI confirmation.
Strong signal → MACD crossover + RSI + Stoch RSI confirmation.
BUY/SELL labels appear on the chart in different colors and sizes.
This way, you can instantly see which signal is more reliable.
Zayıf sinyal → sadece MACD kesişim var
Orta sinyal → MACD kesişim + RSI teyidi.
Güçlü sinyal → MACD kesişim + RSI + Stoch RSI teyidi.
相對強弱指標(RSI)

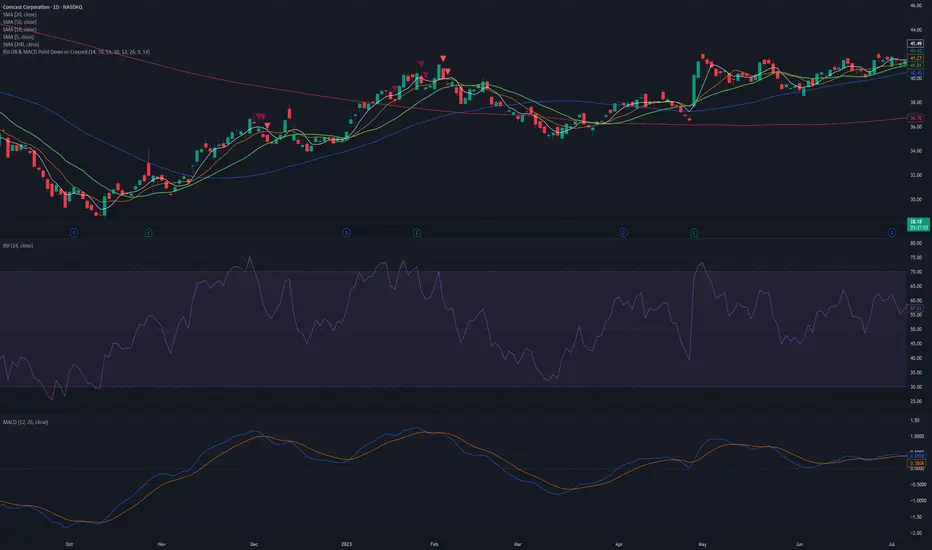
RSI OB & MACD Point Down or Crossed - PSPine script screener indicator for RSI OB and MACD point down or cross.

Hidden Bullish Divergence - B166erThis script will paint a line on the chart when hidden bullish divergence is occurring.
Relative Strength HSIWe add the relative strength indicator. We try to maximize the alpha,
when there is price divergence, we should notice.

Alpha-Weighted RSIDescription:
The Alpha-Weighted RSI is a next-generation momentum oscillator that redefines the classic RSI by incorporating the mathematical principles of Lévy Flight. This advanced adaptation applies non-linear weighting to price changes, making the indicator more sensitive to significant market moves and less reactive to minor noise. It is designed for traders seeking a clearer, more powerful view of momentum and potential reversal zones.
🔍 Key Features & Innovations:
Lévy Flight Alpha Weighting: At the core of this indicator is the Alpha parameter (1.0-2.0), which controls the sensitivity to price changes.
Lower Alpha (e.g., 1.2): Makes the indicator highly responsive to recent price movements, ideal for capturing early trend shifts.
Higher Alpha (e.g., 1.8): Creates a smoother, more conservative output that filters out noise, focusing on stronger momentum.
Customizable Smoothing: The raw Lévy-RSI is smoothed by a user-selectable moving average (8 MA types supported: SMA, EMA, SMMA, etc.), allowing for further customization of responsiveness.
Intuitive Centered Oscillator: The RSI is centered around a zero line, providing a clean visual separation between bullish and bearish territory.
Dynamic Gradient Zones: Subtle, colour coded gradient fills in the overbought (>+25) and oversold (<-25) regions enhance visual clarity without cluttering the chart.
Modern Histogram Display: Momentum is plotted as a sleek histogram that changes color between bright cyan (bullish) and magenta (bearish) based on its position relative to the zero line.
🎯 How to Use & Interpret:
Zero-Line Crossovers: The most basic signals. A crossover above the zero line indicates building bullish momentum, while a crossover below suggests growing bearish momentum.
Overbought/Oversold Levels: Use the +25/-25 and +35/-35 levels as dynamic zones. A reading above +25 suggests strong bullish momentum (overbought), while a reading below -25 indicates strong bearish momentum (oversold).
Divergence Detection: Look for divergences between the Alpha-Weighted RSI and price action. For example, if price makes a new low but the RSI forms a higher low, it can signal a potential bullish reversal.
Alpha Tuning: Adjust the Alpha parameter to match market volatility. In choppy markets, increase alpha to reduce noise. In trending markets, decrease alpha to become more responsive.
⚙️ Input Parameters:
RSI Settings: Standard RSI inputs for Length and Calculation Source.
Lévy Flight Settings: The crucial Alpha factor for response control.
MA Settings: MA Type and MA Length for smoothing the final output.
By applying Lévy Flight dynamics, this indicator offers a nuanced perspective on momentum, helping you stay ahead of the curve. Feedback is always welcome!

EMA Cross + RSI + ADX - Autotrade Strategy V2Overview
A versatile trend-following strategy combining EMA 9/21 crossovers with RSI momentum filtering and optional ADX trend strength confirmation. Designed for both cryptocurrency and traditional futures/options markets with built-in stop loss management and automated position reversals.
Key Features
Multi-Market Compatibility: Works on both crypto futures (Bitcoin, Ethereum) and traditional markets (NIFTY, Bank NIFTY, S&P 500 futures, equity options)
Triple Confirmation System: EMA crossover + RSI filter + ADX strength (optional)
Automated Risk Management: 2% stop loss with wick-touch detection
Position Auto-Reversal: Opposite signals automatically close and reverse positions
Webhook Ready: Six distinct alert messages for automation (Entry Buy/Sell, Close Long/Short, SL Hit Long/Short)
Performance Metrics
NIFTY Futures (15min): 50%+ win rate with ADX filter OFF
Crypto Markets: Requires extensive backtesting before live deployment
Optimal Timeframes: 15-minute to 1-hour charts (patience required for higher timeframes)
Strategy Logic
Entry Signals:
LONG: EMA 9 crosses above EMA 21 + RSI > 55 + ADX > 20 (if enabled)
SHORT: EMA 9 crosses below EMA 21 + RSI < 45 + ADX > 20 (if enabled)
Exit Signals:
Opposite EMA crossover (auto-closes current position)
Stop loss hit at 2% from entry price (tracks candle wicks)
Technical Indicators:
Fast EMA: 9-period (short-term trend)
Slow EMA: 21-period (primary trend)
RSI: 14-period with 55/45 thresholds (momentum confirmation)
ADX: 14-period with 20 threshold (trend strength filter - optional)
Market-Specific Settings
Traditional Markets (NIFTY, Bank NIFTY, S&P Futures, Options)
Recommended Settings:
ADX Filter: Turn OFF (less choppy, cleaner trends)
Timeframe: 15-minute chart
Win Rate: 50%+ on NIFTY Futures
Why No ADX: Traditional markets have more institutional participation and smoother price action, making ADX unnecessary
Cryptocurrency Markets (BTC, ETH, Altcoins)
Recommended Settings:
ADX Filter: Turn ON (ADX > 20)
Timeframe: 15-minute to 1-hour
Extensive backtesting required before live trading
Why ADX: Crypto markets are highly volatile and prone to false breakouts; ADX filters low-quality chop
Best Practices
✅ Backtest thoroughly on your specific instrument and timeframe
✅ Use larger timeframes (1H, 4H) for higher quality signals and better risk/reward
✅ Adjust RSI thresholds based on market volatility (try 52/48 for more signals, 60/40 for fewer but stronger)
✅ Monitor ADX effectiveness - disable for traditional markets, enable for crypto
✅ Proper position sizing - adjust default_qty_value based on your capital and instrument price
✅ Paper trade first - test for 2-4 weeks before risking real capital
Risk Management
Fixed 2% stop loss per trade (adjustable)
Stop loss tracks candle wicks for accurate execution
Positions auto-reverse on opposite signals (no manual intervention needed)
0.075% commission built into backtest (adjust for your broker)
Customization Options
All parameters are adjustable via inputs:
EMA periods (default: 9/21)
RSI length and thresholds (default: 14-period, 55/45 levels)
ADX length and threshold (default: 14-period, 20 threshold)
Stop loss percentage (default: 2%)
Webhook Automation
This strategy includes six distinct alert messages for automated trading:
"Entry Buy" - Long position opened
"Entry Sell" - Short position opened
"Close Long" - Long position closed on opposite crossover
"Close Short" - Short position closed on opposite crossover
"SL Hit Long" - Long stop loss triggered
"SL Hit Short" - Short stop loss triggered
Compatible with Delta Exchange, Binance Futures, 3Commas, Alertatron, and other webhook platforms.
Important Notes
⚠️ Crypto markets require extensive backtesting - volatility patterns differ significantly from traditional markets
⚠️ Higher timeframes = better results - 15min works but 1H/4H provide cleaner signals
⚠️ ADX toggle is critical - OFF for traditional markets, ON for crypto
⚠️ Not financial advice - always conduct your own research and use proper risk management
⚠️ Past performance ≠ future results - backtest results may not reflect live trading conditions
Disclaimer
This strategy is for educational and informational purposes only. Trading futures and options involves substantial risk of loss. Always backtest thoroughly, start with paper trading, and never risk more than you can afford to lose. The author assumes no responsibility for any trading losses incurred using this strategy.

3-Minute RSI and EMA Crossover Strategy 3-Minute RSI and EMA Crossover Sell Strategy with Exit Conditions and Re-entry

Zone Tap Counter: Support & Resistance StrengthWhat is this indicator?
This script is designed to help traders objectively monitor the strength and significance of price zones by counting and visualizing how many times price “taps” confirmed support and resistance levels. The indicator leverages swing high/low detection to automatically plot relevant zones and uses price tap frequency as an objective strength metric.
How does it work?
Zone Identification:
The script uses the Pine Script functions ta.pivothigh and ta.pivotlow to detect confirmed swing highs and lows on your chart. Each swing high establishes a resistance zone, and each swing low establishes a support zone.
Only confirmed pivots are used, ensuring all signals are strictly non-repainting.
Tap Counting Logic:
For every candle, the indicator checks whether price touches (comes within a small, user-set tolerance) of any currently tracked support or resistance zone. To avoid counting repeated taps in the same move, the script ensures only unique bar taps are registered.
Each time price taps a zone, a counter for that zone is incremented.
Both the tolerance for taps (percentage-based), and the depth/history of zones tracked are fully adjustable in settings.
Visual Feedback:
Zones with more taps are drawn darker (lower transparency), making it easy to spot the strongest/hardest-tested levels on the chart.
A label on each zone displays the current tap count (e.g., "3x"), giving direct feedback about which support/resistance are most significant in the current view.
Only recent zones (user-configurable) are shown to keep charts clear and useful.
How to use it:
Add the indicator to your TradingView chart.
Set the swing length and tap tolerance in settings to match your market or timeframe (short swing length for scalping, longer swings for bigger structure).
Watch for zones with high tap counts and darker lines: These zones represent areas where price has repeatedly reacted, suggesting they may be important for your trading decisions.
You can adjust the minimum number of taps needed for a zone to be highlighted and the number of zones to display for your preferred visual clarity.
Combine this tool with other analysis for confirmation—tap counts should not be seen as trading signals, but as supporting information.
Originality & Calculation Details:
This script does NOT simply merge or overlay existing indicators. The calculation method is original: it uses swing-based support/resistance and applies unique tap-count logic, designed for objective zone strength visualization.
No repainting logic is present.
All code and visualization methods are documented and transparent.
Disclaimer:
This indicator is for educational and analytical purposes only. It does not predict future price movement, guarantee profits, or recommend specific trades. Always use your own analysis and risk management. See TradingView’s House Rules for more details.

Multi-Timeframe RSI + MA - Santosh - BangaloreThis script has a combined 5 and 15 min RSI's together in one indicator. Created using AI.

EMA + RSI Autotrade Webhook - VarunOverview
The EMA + RSI Autotrade Webhook is a powerful trend-following indicator designed for automated crypto futures trading. This indicator combines the reliability of Exponential Moving Average (EMA) crossovers with RSI momentum filtering to generate high-probability buy and sell signals optimized for webhook integration with crypto exchanges like Delta Exchange, Binance Futures, and Bybit.Key Features
Simple & Effective: Uses proven EMA 9/21 crossover strategy
RSI Momentum Filter: Eliminates low-probability trades in ranging markets
Webhook Ready: Two clean alerts (LONG Entry, SHORT Entry) for seamless automation
Exchange Compatible: Works with Delta Exchange, 3Commas, Alertatron, and other webhook platforms
Zero Lag Signals: Real-time alerts on crossover confirmation
Visual Clarity: Clean chart markers for easy signal identification
How It Works
Entry Signals:
LONG Entry: Triggers when EMA 9 crosses above EMA 21 AND RSI is above 52 (bullish momentum confirmed)
SHORT Entry: Triggers when EMA 9 crosses under EMA 21 AND RSI is below 48 (bearish momentum confirmed)
Technical Components:
Fast EMA: 9-period (tracks short-term price action)
Slow EMA: 21-period (identifies primary trend)
RSI: 14-period (confirms momentum strength)
RSI Long Threshold: 52 (filters weak bullish signals)
RSI Short Threshold: 48 (filters weak bearish signals)
Best Use Cases
Crypto Futures Trading: Bitcoin, Ethereum, Altcoin perpetual contracts
Automated Trading Bots: Integration with Delta Exchange webhooks, TradingView alerts
Timeframes: Optimized for 15-minute charts (works on 5min-1H)
Markets: Trending crypto markets with clear directional moves
Risk Management: Best used with 1-2% stop loss per trade (managed externally)
Webhook Automation Setup
Add indicator to your TradingView chart
Create alerts for "LONG Entry" and "SHORT Entry"
Configure webhook URL from your exchange (Delta Exchange, Binance, etc.)
Use alert message: Entry LONG {{ticker}} @ {{close}} or Entry SHORT {{ticker}} @ {{close}}
Exchange automatically reverses positions on opposite signals
Advantages
✅ No manual trading required - fully automated
✅ Eliminates emotional trading decisions
✅ Catches trending moves early with EMA crossovers
✅ RSI filter reduces whipsaws in choppy markets
✅ Works 24/7 without monitoring
✅ Simple two-alert system (easy to manage)
✅ Compatible with multiple exchanges via webhooksStrategy Philosophy
This indicator follows a trend-following with momentum confirmation approach. By waiting for both EMA crossover AND RSI confirmation, it ensures you're entering trades with genuine momentum behind them, not just random price noise. The tight RSI thresholds (52/48) keep you aligned with the prevailing trend.Recommended Settings
Timeframe: 15-minute (primary), 5-minute (scalping), 1-hour (swing)
Markets: BTC/USDT, ETH/USDT, high-liquidity altcoin perpetuals
Position Sizing: 100% capital per signal (exchange manages reversals)
Stop Loss: 2% (managed via exchange or external bot)
Leverage: 1-2x for conservative approach, up to 5x for aggressive
Important Notes
⚠️ This indicator generates entry signals only - position reversals are handled automatically by your exchange
⚠️ Always backtest on historical data before live trading
⚠️ Use proper risk management and position sizing
⚠️ Best performance in trending markets; may generate false signals in tight ranges
⚠️ Requires TradingView Premium or higher for webhook functionalityTags
cryptocurrency futures automated-trading ema-crossover rsi webhook delta-exchange tradingview-alerts trend-following momentum bitcoin ethereum crypto-bot algo-trading 15-minute-strategy

Ichimoku_RSI_MACD_CleanIchimoku + RSI + MACD. A combination of three indicators. The important thing is that they have a BUY or SELL alert, so it makes it easy to understand the numbers.


Ichimoku_RSI_MACD_CleanIchimoku + RSI + MACD indicator. It combines these three indicators. It tells whether the trend is bullish or bearish. Multi-timeframe.

Pulse RSI | Lyro RSPulse RSI | Lyro RS
The Pulse RSI is a momentum oscillator that enhances the traditional RSI by incorporating volume-weighted price and linear regression. It generates multiple trading signals, including trend shifts, overbought/oversold conditions, and custom threshold levels.
By integrating both price and volume into its calculation, Pulse RSI is more robust and responsive than the standard RSI. This helps you identify trends faster, spot potential reversals sooner, and set up custom alerts based on your own strategy.
Key Features
Four Signal Types:
Type 1 (Trend): Triggers when the indicator's current value crosses its previous value, highlighting short-term momentum shifts.
Type 2 (Midline Trend): The classic midline cross. A bullish bias is indicated above 50, while a bearish bias is indicated below 50.
Type 3 (Overbought/Oversold): Flags potential reversal zones, suggesting where buying or selling opportunities may emerge.
Type 4 (Custom Thresholds): This type lets you define your own threshold levels. Instead of following a trend, use it to mark your specific conditions for a reversal. For example, set a long reversal at a low level (e.g., 5) for an early buy signal, or a short reversal at a high level (e.g., 80) for an early sell signal.
Calculation Method:
The indicator uses a volume-weighted price (Close * High * Low) and applies linear regression to smooth the data. This creates a unique and more stable oscillator, avoiding the chaotic movement seen in others.
Color System:
Choose from multiple color themes like Classic, Mystic, Accented, and Royal, or create your own custom colors for bullish and bearish signals.
Visual Plotting:
Features a clear plot with a glow effect, a midline, adjustable threshold lines, and shapes/labels to mark long/short and overbought/oversold signals.
Alerts:
Instant alerts are available for every signal type, which you can quickly enable based on your trading conditions.
How It Works:
Core Calculation
The indicator calculates a volume-weighted price using (Close * High * Low) multiplied by the absolute volume. This value is then smoothed with linear regression and converted into an oscillator, normalized to a 0-100 scale.
Trading Logic:
Bullish Signals: Trigger when the main plot line crosses above a key level—be it the previous value, the 50 midline, or a custom threshold.
Bearish Signals: Trigger when the main plot line crosses below a key level.
Visual Logic:
The system displays a main plot line, colors candles, and plots signal shapes, all customizable through a variety of color schemes.
Practical Use
Trend Confirmation (Types 1 & 2): Use Type 1 for early momentum shifts and Type 2 to confirm the overall trend direction.
Reversals (Type 3): Consider long entries when oversold signals fire, suggesting an asset is undervalued. Look for exits at overbought signals, which suggest a potential downward reversal.
Custom Thresholds (Type 4): Set tight thresholds to catch early trends and reversals. Be aware that more sensitive settings may also increase false positives.
Customization:
Adjust the Length: A higher setting makes the indicator more suited for long-term trends, while a lower setting makes it more sensitive for short-term moves.
Enable/Disable Signals: Turn the four signal types on or off to match your trading style.
Set Your Levels: Fully adjustable thresholds for Type 4 long/short conditions.
Choose Your Colors: Select from a variety of color schemes for all bullish and bearish elements.
⚠️ Disclaimer
This indicator is a tool for technical analysis and does not guarantee results. It should be used alongside other analysis methods and solid risk management practices. The creators are not responsible for any financial decisions made based on its signals.

RSI(Min-Max)RSI (Min-Max) is an enhanced version of Welles Wilder's Relative Strength Index, designed to offer greater analytical precision and dynamic insight into the behavior of the RSI within each candlestick.In addition to displaying the traditional RSI value, this script calculates the possible extreme values — the minimum and maximum RSI — based on the low and high prices of the current candle. This allows you to estimate how the RSI would react if the price moved to the extremes of the bar, providing a predictive and refined reading of momentum.

ADX Trend Strength Filter + TRAMA [DotGain]Summary
Are you tired of trading trend signals, only to get stopped out in volatile, sideways chop?
The ADX Trend Strength Filter (ADX TSF) is designed to solve this exact problem. It is a comprehensive trend-following system that only generates signals when a trend not only has the right direction and momentum, but also sufficient strength.
This indicator filters out weak or indecisive market phases (the "chop") and will only color the bars Green or Red when all conditions for a strong, confirmed trend are met.
⚙️ Core Components and Logic
The ADX TSF relies on a triple-filter logic to generate a clear trade signal:
Trend Filter (TRAMA): A TRAMA (Trending Adaptive Moving Average) is used as the main trendline. This adaptive average automatically adjusts to market volatility, acting as a dynamic support/resistance level.
Price > TRAMA = Bullish
Price < TRAMA = Bearish
Momentum Filter (RSI Crossover): Momentum is measured by a crossover of two moving averages of the RSI (a fast EMA and a slow SMA). This confirms whether the momentum is pointing in the same direction as the trend.
Strength Filter (ADX): This is the most important filter. A signal is only considered valid if the ADX (Average Directional Index) is above a defined threshold (Default: 30). This ensures the trend has sufficient strength.
🚦 How to Read the Indicator
The indicator has three states, displayed directly as bar colors on your chart:
🟩 GREEN BARS (Strong Uptrend) All three conditions are met:
Price is above the TRAMA.
RSI momentum is bullish (Fast MA > Slow MA).
ADX is above 30 (Strong trend is present).
🟥 RED BARS (Strong Downtrend) All three conditions are met:
Price is below the TRAMA.
RSI momentum is bearish (Fast MA < Slow MA).
ADX is above 30 (Strong trend is present).
🟧 ORANGE BARS (Neutral / Caution) This state appears if any of the following conditions are true:
Weak Trend: The ADX is below 30. The market is in consolidation or a sideways phase. (This is the primary filter!)
Indecision: The price is caught in the "Neutral Zone" between the TRAMA and the 200 SMA.
Visual Elements
Bar Colors: (Green/Red/Orange) Show the current trend status.
TRAMA (Orange Line): Your primary adaptive trendline.
200 SMA (White Line): Serves as a reference for the long-term trend.
Orange Background (Fill): Fills the area between the TRAMA and SMA to visually highlight the "Neutral Zone."
Key Benefit
The goal of the ADX TSF is to keep traders out of weak, unpredictable markets and help them participate only in strong, momentum-confirmed trends.
Have fun :)
Disclaimer
This "Buy The F*cking Dip" (BTFD) indicator is provided for informational and educational purposes only. It does not, and should not be construed as, financial, investment, or trading advice.
The signals generated by this tool (both "Buy" and "Sell") are the result of a specific set of algorithmic conditions. They are not a direct recommendation to buy or sell any asset. All trading and investing in financial markets involves substantial risk of loss. You can lose all of your invested capital.
Past performance is not indicative of future results. The signals generated may produce false or losing trades. The creator (© DotGain) assumes no liability for any financial losses or damages you may incur as a result of using this indicator.
You are solely responsible for your own trading and investment decisions. Always conduct your own research (DYOR) and consider your personal risk tolerance before making any trades.

RSI + MACD Multi-Timeframe StrategyThis strategy combines the Relative Strength Index (RSI) from the daily timeframe with the Moving Average Convergence Divergence (MACD) from the 4-hour timeframe to generate precise long entry and exit signals.
The system uses a multi-timeframe approach to align longer-term trend conditions with shorter-term momentum shifts — allowing traders to catch dips with confirmation and exit before reversals.
🧠 Strategy Logic
✅ Long Entry Condition:
- RSI on the daily (1D) timeframe is oversold (below your defined threshold)
- MACD on the 4H timeframe crosses above the signal line
→ A long trade is opened when these two align
✅ Long Exit Condition:
- RSI on the daily timeframe is overbought
- MACD on the 4H timeframe crosses below the signal line
→ The long trade is closed when these two conditions are met
💡 This strategy currently supports long entries only. Short logic can be added if needed.
📊 Indicator Components
🔹 RSI (Relative Strength Index):
- A momentum oscillator that measures the speed and magnitude of price changes.
- Helps identify overbought (potential sell) and oversold (potential buy) conditions.
- Applied on the 1D timeframe (by default) to reflect broader market trend or exhaustion levels.
🔹 MACD (Moving Average Convergence Divergence):
- A trend-following momentum indicator based on moving averages.
- The MACD Line (fast EMA - slow EMA) crossing above the Signal Line indicates bullish momentum.
- Used here on the 4-hour timeframe (by default) for shorter-term momentum confirmation.
🔹 Multi-Timeframe (MTF) Logic:
- Uses request.security() to pull higher timeframe data (1D for RSI, 4H for MACD).
- Ensures no repainting, as it only uses closed candles from the higher timeframe.
- Aligns longer-term signals with shorter-term entries, reducing false signals.
📈 Plotting Options
The script includes a plot selector input allowing you to toggle between:
- RSI Plot (with overbought/oversold lines)
- MACD Plot (MACD line and signal line)
- This helps visualize signal conditions clearly on your chart.
🛠 Customization
- RSI & MACD settings are fully configurable
- RSI and MACD timeframes can be adjusted independently
⚠️ Disclaimer
This strategy is provided for educational and informational purposes only.
It is not financial advice or a recommendation to buy or sell any asset.
Past performance does not guarantee future results. Always test strategies in a simulated environment before live use, and consult with a licensed financial advisor for investment decisions.

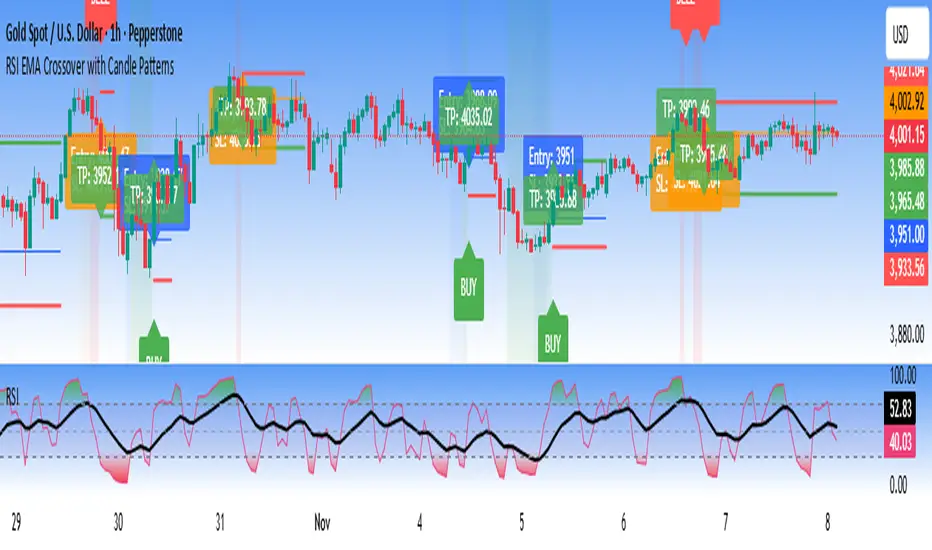
RSI EMA Crossover with Price ActionThe RSI and RSI's EMA Crossover with Price Action (1:2 Risk-Reward) strategy combines Momentum, Trend confirmation, and Basic price-action logic to generate high-probability trade setups with Proper Risk Management.
This script identifies entries when the RSI crosses a key threshold and aligns with an RSI - EMA crossover, confirming Exhaustion of a current trend and Price action confirms the Change in Trend direction. It integrates price action filters to avoid false signals during low-volatility or choppy conditions.
The strategy also includes a risk-management module, setting a fixed 1:2 risk-to-reward ratio — automatically placing a take-profit target twice the size of the stop loss. Also the Stop loss can be adjusted to nearest swing low or last 3 candles Low. to avoid Stoploss hunt.
Features
✅ RSI and EMA crossover confirmation for directional bias
✅ Basic price-action validation (optional filters)
✅ Configurable stop-loss and take-profit levels (default 1:2)
✅ Visual trade markers for entries and exits
Disclaimer: This script is intended for educational and research purposes only. It should not be considered financial advice or a guaranteed trading system. Users are encouraged to test and optimize parameters before using in live markets.
SamRSIIts multiple timeframe RSI indicator
Second RSI indicator can be enabled or disabled up on the necessity
Second RSI indicator has the ability to set to a different timeframe
Perfect for all types of trade (Intraday, Positional, Short term and Long term)

Emerson v8.4 – Kulture Metrics🜂 Emerson v8.4 – Kulture Metrics
“When volatility breathes, probability answers.”
The Emerson Engine isn’t another indicator—it’s a precision instrument built to exploit the hidden mathematics of motion.
Born from Kulture Metrics’ Nosreme lineage, this model fuses trend architecture, volatility anatomy, and Linetsky’s path-integral weighting into one living signal core. It doesn’t predict — it quantifies belief.
Each trigger passes through three unforgiving filters:
Classical Trend & Momentum Logic — directional strength, pure and unadulterated.
Squeeze Regime Anticipation — volatility compression before the break.
Path-Integral Confirmation — stochastic payoffs weighted by risk-free discounting and volatility density.
The result?
Only signals where the math, the market, and the moment all align — Absolute Confirmations.
No noise. No guessing. No emotion.
In practice, Emerson waits. It calculates. Then it strikes with surgical precision — entries that respect volatility, discount rates, and expected path contributions like a derivatives desk built into your chart.
Each decision point carries the full weight of stochastic probability theory — the same principles driving modern option pricing — yet distilled into something you can read at a glance.
Benefits that separate you from the herd:
✅ Trades filtered by volatility percentile and expected payoff distribution — not gut feel.
✅ Dotted bias line reveals the “probabilistic current” beneath price itself.
✅ Alerts trigger only when logic, momentum, and probability form a unanimous verdict.
✅ Dynamic macro-window shading adapts to volatility pressure in real time.
✅ Every entry inherently respects your risk, target, and discounting horizon.
Emerson v8.4 doesn’t ask the market what’s happening — it tells it what must happen next, given the probabilities.
It’s not designed to comfort. It’s designed to confirm.
Kulture Metrics. Built for traders who understand that randomness is just order not yet resolved.

RSI Divergence DetectorOverview
The RSI Divergence Detector is a comprehensive technical analysis tool designed to identify both regular and hidden divergences between price action and the Relative Strength Index (RSI). This indicator helps traders spot potential trend reversals and continuations by automatically detecting when price movements diverge from RSI momentum.
What are Divergences?
Regular Divergences signal potential trend reversals:
Bullish Divergence: Price makes a lower low while RSI makes a higher low → Potential upward reversal
Bearish Divergence: Price makes a higher high while RSI makes a lower high → Potential downward reversal
Hidden Divergences signal trend continuation:
Hidden Bullish Divergence: Price makes a higher low while RSI makes a lower low → Uptrend continuation
Hidden Bearish Divergence: Price makes a lower high while RSI makes a higher high → Downtrend continuation
Automatic Divergence Detection
Detects all four types of divergences automatically
Draws connecting lines between divergence points on the RSI
Labels each divergence with clear text indicators ("Bull", "Bear", "HBull", "HBear")
Independent toggle switches for each divergence type
Dynamic RSI Display
RSI line changes color based on momentum:
Green when RSI is above 50 (bullish momentum)
Red when RSI is below 50 (bearish momentum)
Standard overbought (70) and oversold (30) levels marked
Shaded background zones for overbought/oversold areas
Pivot Detection System
Adjustable pivot lookback period (default: 4 bars)
Visual pivot markers at tops and bottoms of RSI
Configurable maximum divergence range (default: 60 bars)
Adjust the setting to you desired sensitivity on each timeframe.
Full Customization Suite
Label Customization:
Choose label size (Tiny, Small, Normal, Large, Huge)
Separate color selection for each divergence type
Adjustable transparency (0-100%)
Line Customization:
Independent color control for bullish and bearish lines
Line style options for each type (Solid, Dashed, Dotted)
Default: Regular divergences use dashed lines, hidden divergences use dotted lines
Visual Settings:
Customizable overbought/oversold zone colors and transparency
Gray horizontal reference lines (70, 50, 30)
Pivot markers with adjustable visibility
Default Settings
RSI Length: 14 periods
Pivot Lookback: 4 bars
Max Divergence Range: 60 bars
Label Size: Normal
Bullish Color: #4CAF50 (Material Green)
Bearish Color: #FF5252 (Material Red)
Regular Line Style: Dashed
Hidden Line Style: Dotted
How to Use
Customize Settings: Adjust colors, line styles, and detection parameters to your preference
Toggle Divergence Types: Enable/disable specific divergence types based on your trading strategy
Identify Signals: Look for labeled divergences with connecting lines on the RSI pane
Confirm with Price Action: Use divergences in conjunction with other technical analysis tools
Best Practices
Regular Divergences: Best used to spot potential reversals at market extremes
Hidden Divergences: Best used to identify pullback entry points in trending markets
Confirmation: Always wait for price confirmation before entering trades based on divergences
Multiple Timeframes: Check for divergences across multiple timeframes for stronger signals
Risk Management: Use proper stop-losses as not all divergences lead to reversals
Technical Specifications
PineScript Version: v6
Indicator Type: Oscillator (separate pane)
Maximum Lines: 500
Calculation Method: Pivot-based divergence detection using price and RSI comparisons
