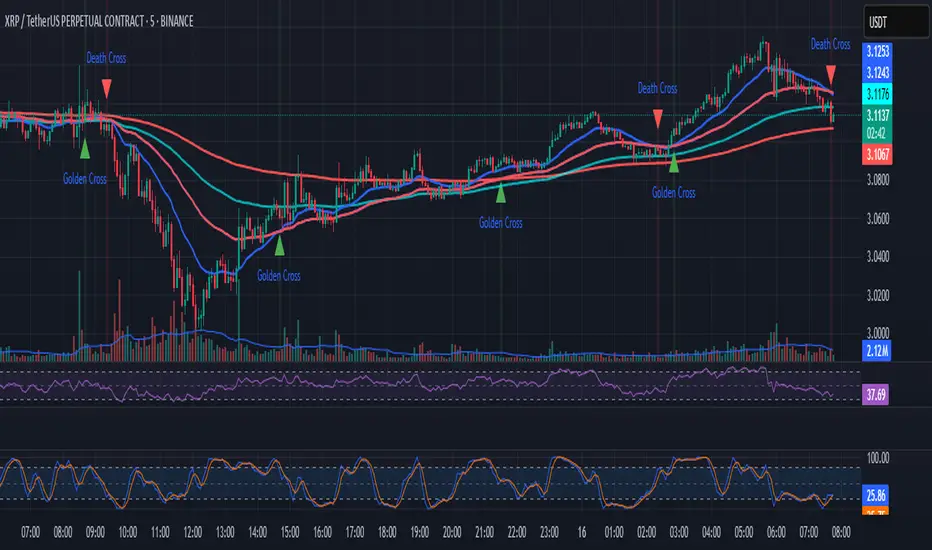
Ultra Trabalza EMA/MA + crosses,rejectionsEMA/MA crosses
Bullish cross = green "^"
Bearish cross = red "x"
Golden cross (50EMA > 200EMA) = Golden circle
Death cross (50EMA < 200EMA) = Red circle
Bullish Wick through support = Gold candle
Bearish Wick through resistance = Purple candle
在腳本中搜尋"GOLD"


DEMA Crossover Strategy_01_SARThis is used to do trade based on golden cross and death cross. It uses SAR.

Kringold2[WOZDUX] gold equivalentThe indicator is a tool for global analysis. The default is the price of gold. The price of the instrument from the main window is divided by the price of gold. The result is the price of the instrument in units of gold. The screen uses the Dow Jones index as an example. In the indicator window, the price of the index in units of gold or the so-called gold Dow Jones. The use of the gold equivalent makes it possible to see more truthful trends. The Indicator has the ability to change gold to any other equivalent. It is enough to change the name of the exchange and the name of the instrument in the options tool and exchange. In addition, in the settings, the second box on top allows you to view the graph in a linear or logarithmic scale. The first box at the top switches the line chart or the CCI =WT indicator to this chart.
-------------------------------------------
Индикатор это инструмент для глобального анализа. По умолчанию используется цена золота. Цена инструмента из основного окна делится на цену золота. В результате получается цена инструмента в единицах золота. На экране для примера используется индекс Доу джонса. В окне индикатора цена индекса в единицах золота или так называемый золотой Доу Джонс. Использование золотого эквивалента дает возможность видеть более правдивые тенденции движения. В Индикаторе есть возможность поменять золото на любой другой эквивалент. Достаточно в опциях инструмент и биржа изменить название биржи и название инструмента. Кроме того, в настройках, второй бокс сверху дает возможность смотреть график в линейном или логарифмическом масштабе. Первый бокс сверу переключает линейный график или индикатор CCI =WT к данному графику.

Cyatophilum Golden X - RSI [INDICATOR] [ALERT SETUP]This indicator is a custom combo of Ema crosses, RSI divergences and Support/resistance, designed to make the most profit possible.
It is a pretty solid indicator for trading BTC in 4H.
There are two kind of buy signals : Green and Blue triangles, that are two great Buy/Long entries.
There are also two kind of sell signals: Red and Orange triangles, that are two great Sell/Short entries.
The indicator comes with automatic Alerts that trigger on Green and Blue triangles for a Buy Alert, or that trigger on Red and Orange triangles for a Sell Alert.
If you are interested in purchasing the indicator and want to try it, then please leave a comment.
A strategy version should follow on my profile soon.
-----------------------------------------------------------------------------------------
I am also available for PineScript Development and Reverse Engineering.
Join my discord:
discord.gg

Moving AverageJust a simple script to put two MA on the same chart and find golden/death crosses.
Default on 50/200.
Fractal Regression Bands [DW]This study is an experimental regression curve built around fractal and ATR calculations.
First, Williams Fractals are calculated, and used as anchoring points.
Next, high anchor points are connected to negative sloping lines, and low anchor points to positive sloping lines. The slope is a specified percentage of the current ATR over the sampling period.
The median between the positive and negative sloping lines is then calculated, then the best fit line (linear regression) of the median is calculated to generate the basis line.
Lastly, a Golden Mean ATR is taken of price over the sampling period and multiplied by 1/2, 1, 2, and 3. The results are added and subtracted from the basis line to generate the bands.
Williams Fractals are included in the plots. The color scheme indicated whether each fractal is engulfing or non-engulfing.
Custom bar color scheme is included.

ZLT XAUUSD Alpha Breakout StrategyStrategy Overview
This is a breakout momentum strategy that combines multiple technical indicators and risk management features to trade gold. It's called "XAUUSD Alpha Breakout" and uses ATR-based risk management with session filtering and advanced stop-loss mechanisms.
Core Trading Logic
Entry Signals
The strategy generates trading signals based on:
Donchian Channel Breakouts:
Long when price breaks above the highest high of the last 20 periods
Short when price breaks below the lowest low of the last 20 periods
Trend Confirmation:
Uses a 200-period EMA as the primary trend filter
Longs only above EMA, shorts only below
Momentum Filter (RSI):
Longs require RSI ≥ 55 (bullish momentum)
Shorts require RSI ≤ 45 (bearish momentum)
Higher Timeframe Confirmation:
Optional 60-minute timeframe trend filter
Ensures alignment with larger trend
Session Filter:
Trades only during London/New York sessions (4:00-20:00)
Targets the most liquid trading hours for gold
Risk Management Features
Position Sizing & Stops
ATR-Based Stop Loss: Stop placed at 1.5x ATR from entry
Risk-Reward Ratio: Default 2:1 (take profit at 2x the risk distance)
Position Sizing: Uses 100% of equity (adjustable)
Advanced Stop Management
Break-Even Feature:
Moves stop to entry price when trade reaches 1:1 RR
Protects profits once initial risk is covered
ATR Trailing Stop:
Trails stop at 2x ATR behind price
Locks in profits as trade moves favorably
Trend Reversal Exit:
Closes positions if trend changes (price crosses EMA or HTF trend flips)
Gold-Specific Settings
Pip Size: Set to 0.01 (standard for XAUUSD)
Spread/Slippage: Simulates 20 pips of trading costs
Commission: No commission (typical for forex/CFD trading)
Visual Components
The strategy displays:
Yellow EMA line (trend indicator)
Green/Red Donchian channel boundaries
Triangle markers for entry signals (up for long, down for short)
Trailing stop lines when active (aqua for longs, purple for shorts)
Alert System
Provides alerts for:
Long and short entry signals
Break-even activation
Position management events
Use Case
This strategy is designed for:
Traders focusing on gold (XAUUSD)
Intraday to swing trading (uses session filters)
Risk-conscious traders (multiple stop-loss mechanisms)
Systematic/algorithmic trading (clear rules-based approach)
Key Strengths
Multiple confirmations reduce false signals
Dynamic risk management adapts to market volatility
Session filtering avoids low-liquidity periods
Trend alignment across multiple timeframes
Professional-grade exit management (BE + trailing stops)
This is a well-structured strategy that combines trend-following with momentum breakouts, particularly suited for the volatile nature of gold trading while maintaining strict risk controls.

EMA Golden & Death Cross with Profit Takingjust showing golden crosses and death crosses based on ema lines
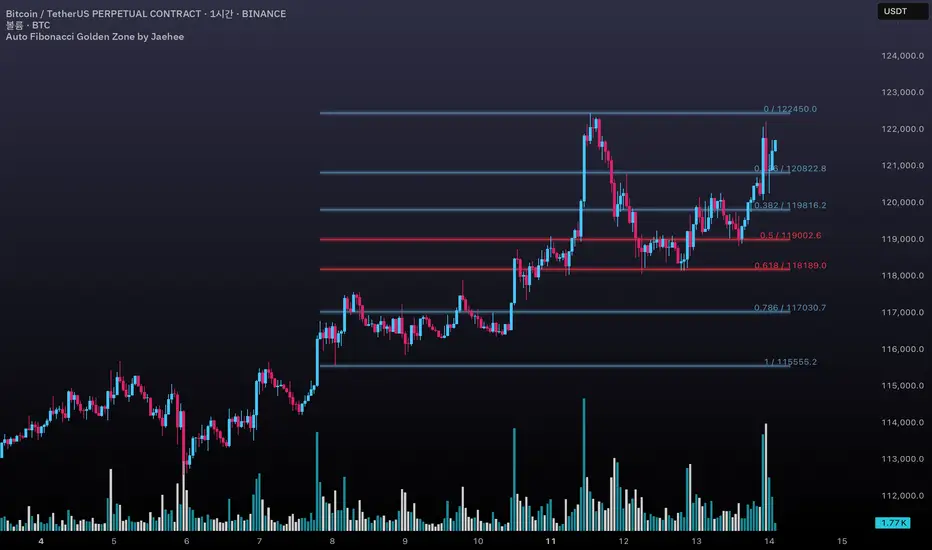
Auto Fibonacci Golden Zone by Jaehee📌 AUTO FIBONACCI GOLDEN ZONE — Auto Swing Detection with Key Level Highlights
WHAT THIS DOES
• Automatically detects the latest swing high and swing low within your chosen lookback range.
• Plots Fibonacci retracement levels: 1.000, 0.786, 0.618, 0.500, 0.382, 0.236, 0.000.
• Highlights 0.618 (“golden pocket”) and 0.500 as high-interest zones.
• Displays ratio + price labels to the right for quick reference without moving the cursor.
HOW IT WORKS
• Scans the last N bars (default 150) to locate the highest high and lowest low.
• Determines swing direction automatically: if the low forms first → up-leg, if the high forms first → down-leg.
• Calculates retracement prices and plots each level with a thin core line plus two glow layers (opacity adjustable).
• Clears and redraws lines and labels whenever a new swing is found — keeping the chart clean.
WHY THIS SETUP
• Saves time compared to manually anchoring Fib tools for each new swing.
• Highlights the golden pocket (0.618) and midpoint (0.500) — zones many traders watch for pullbacks or reactions.
• Positions labels to the right so they never overlap active candles.
HOW IT’S DIFFERENT FROM THE STANDARD FIB TOOL
• Automatic swing detection — no manual point selection.
• Built-in highlight logic for key levels.
• Clean redraw to prevent leftover lines or labels.
• Right-side label offset for readability in volatile price zones.
HOW TO READ IT (CONTEXT ONLY)
• In an up-leg, the 0.382–0.618 zone is often monitored for pullback reactions; 0.500 can act as a midpoint marker.
• In a down-leg, retracements into the 0.382–0.618 zone can be watched for selling pressure.
• Always confirm with structure, volume, and momentum tools — this indicator is not a standalone trade signal.
INPUTS
• Lookback Bars — swing detection range.
• Fib Line Color / Highlight Line Color — control standard vs. key level colors.
• Label Offset Bars — shift labels away from current price.
• Glow 1 & Glow 2 Opacity — adjust background glow visibility.
DESIGN NOTES
• Thin lines for precision, glow layers for visibility without overpowering candles.
• Overlay display — no extra panel needed.
• All elements clear and redraw automatically to avoid clutter.
LIMITATIONS & BEST PRACTICES
• Levels update whenever a new swing forms within the lookback range — historical lines are not fixed.
• Fib retracements are reference zones only, not guarantees of reversal.
• Best used with confluence factors like S/R flips, market structure, and volume analysis.
• No alerts, no performance claims — purely a market context tool.
DEFAULTS & SCOPE
• Works on all OHLCV instruments and timeframes.
• No repainting after swing confirmation.
AUTHOR’S NOTE FOR REVIEW
This is not a repackaged Fib tool. It combines automatic swing detection, golden pocket highlighting, and a clean redraw process to make retracement analysis faster and clearer. It provides context only, with no predictive or performance claims.
Multi SMA + Golden/Death + Heatmap + BB**Multi SMA (50/100/200) + Golden/Death + Candle Heatmap + BB**
A practical trend toolkit that blends classic 50/100/200 SMAs with clear crossover labels, special 🚀 Golden / 💀 Death Cross markers, and a readable candle heatmap based on a dynamic regression midline and volatility bands. Optional Bollinger Bands are included for context.
* See trend direction at a glance with SMAs.
* Get minimal, de-cluttered labels on important crosses (50↔100, 50↔200, 100↔200).
* Highlight big regime shifts with special Golden/Death tags.
* Read momentum and volatility with the candle heatmap.
* Add Bollinger Bands if you want classic mean-reversion context.
Designed to be lightweight, non-repainting on confirmed bars, and flexible across timeframes.
# What This Indicator Does (plain English)
* **Tracks trend** using **SMA 50/100/200** and lets you optionally compute each SMA on a higher or different timeframe (HTF-safe, no lookahead).
* **Prints labels** when SMAs cross each other (up or down). You can force signals only after bar close to avoid repaint.
* **Marks Golden/Death Crosses** (50 over/under 200) with special labels so major regime changes stand out.
* **Colors candles** with a **heatmap** built from a regression midline and volatility bands—greenish above, reddish below, with a smooth gradient.
* **Optionally shows Bollinger Bands** (basis SMA + stdev bands) and fills the area between them.
* **Includes alert conditions** for Golden and Death Cross so you can automate notifications.
---
# Settings — Simple Explanations
## Source
* **Source**: Price source used to calculate SMAs and Bollinger basis. Default: `close`.
## SMA 50
* **Show 50**: Turn the SMA(50) line on/off.
* **Length 50**: How many bars to average. Lower = faster but noisier.
* **Color 50** / **Width 50**: Visual style.
* **Timeframe 50**: Optional alternate timeframe for SMA(50). Leave empty to use the chart timeframe.
## SMA 100
* **Show 100**: Turn the SMA(100) line on/off.
* **Length 100**: Bars used for the mid-term trend.
* **Color 100** / **Width 100**: Visual style.
* **Timeframe 100**: Optional alternate timeframe for SMA(100).
## SMA 200
* **Show 200**: Turn the SMA(200) line on/off.
* **Length 200**: Bars used for the long-term trend.
* **Color 200** / **Width 200**: Visual style.
* **Timeframe 200**: Optional alternate timeframe for SMA(200).
## Signals (crossover labels)
* **Show crossover signals**: Prints triangle labels on SMA crosses (50↔100, 50↔200, 100↔200).
* **Wait for bar close (confirmed)**: If ON, signals only appear after the candle closes (reduces repaint).
* **Min bars between same-pair signals**: Minimum spacing to avoid duplicate labels from the same SMA pair too often.
* **Trend filter (buy: 50>100>200, sell: 50<100<200)**: Only show bullish labels when SMAs are stacked bullish (50 above 100 above 200), and only show bearish labels when stacked bearish.
### Label Offset
* **Offset mode**: Choose how to push labels away from price:
* **Percent**: Offset is a % of price.
* **ATR x**: Offset is ATR(14) × multiplier.
* **Percent of price (%)**: Used when mode = Percent.
* **ATR multiplier (for ‘ATR x’)**: Used when mode = ATR x.
### Label Colors
* **Bull color** / **Bear color**: Background of triangle labels.
* **Bull label text color** / **Bear label text color**: Text color inside the triangles.
## Golden / Death Cross
* **Show 🚀 Golden Cross (50↑200)**: Show a special “Golden” label when SMA50 crosses above SMA200.
* **Golden label color** / **Golden text color**: Styling for Golden label.
* **Show 💀 Death Cross (50↓200)**: Show a special “Death” label when SMA50 crosses below SMA200.
* **Death label color** / **Death text color**: Styling for Death label.
## Candle Heatmap
* **Enable heatmap candle colors**: Turns the heatmap on/off.
* **Length**: Lookback for the regression midline and volatility measure.
* **Deviation Multiplier**: Band width around the midline (bigger = wider).
* **Volatility basis**:
* **RMA Range** (smoothed high-low range)
* **Stdev** (standard deviation of close)
* **Upper/Middle/Lower color**: Gradient colors for the heatmap.
* **Heatmap transparency (0..100)**: 0 = solid, 100 = invisible.
* **Force override base candles**: Repaint base candles so heatmap stays visible even if your chart has custom coloring.
## Bollinger Bands (optional)
* **Show Bollinger Bands**: Toggle the overlay on/off.
* **Length**: Basis SMA length.
* **StdDev Multiplier**: Distance of bands from the basis in standard deviations.
* **Basis color** / **Band color**: Line colors for basis and bands.
* **Bands fill transparency**: Opacity of the fill between upper/lower bands.
---
# Features & How It Works
## 1) HTF-Safe SMAs
Each SMA can be calculated on the chart timeframe or a higher/different timeframe you choose. The script pulls HTF values **without lookahead** (non-repainting on confirmed bars).
## 2) Crossover Labels (Three Pairs)
* **50↔100**, **50↔200**, **100↔200**:
* **Triangle Up** label when the first SMA crosses **above** the second.
* **Triangle Down** label when it crosses **below**.
* Optional **Trend Filter** ensures only signals aligned with the overall stack (50>100>200 for bullish, 50<100<200 for bearish).
* **Debounce** spacing avoids repeated labels for the same pair too close together.
## 3) Golden / Death Cross Highlights
* **🚀 Golden Cross**: SMA50 crosses **above** SMA200 (often a longer-term bullish regime shift).
* **💀 Death Cross**: SMA50 crosses **below** SMA200 (often a longer-term bearish regime shift).
* Separate styling so they stand out from regular cross labels.
## 4) Candle Heatmap
* Builds a **regression midline** with **volatility bands**; colors candles by their position inside that channel.
* Smooth gradient: lower side → reddish, mid → yellowish, upper side → greenish.
* Helps you see momentum and “where price sits” relative to a dynamic channel.
## 5) Bollinger Bands (Optional)
* Classic **basis SMA** ± **StdDev** bands.
* Light visual context for mean-reversion and volatility expansion.
## 6) Alerts
* **Golden Cross**: `🚀 GOLDEN CROSS: SMA 50 crossed ABOVE SMA 200`
* **Death Cross**: `💀 DEATH CROSS: SMA 50 crossed BELOW SMA 200`
Add these to your alerts to get notified automatically.
---
# Tips & Notes
* For fewer false positives, keep **“Wait for bar close”** ON, especially on lower timeframes.
* Use the **Trend Filter** to align signals with the broader stack and cut noise.
* For HTF context, set **Timeframe 50/100/200** to higher frames (e.g., H1/H4/D) while you trade on a lower frame.
* Heatmap “Length” and “Deviation Multiplier” control smoothness and channel width—tune for your asset’s volatility.

The Golden TriggerThe Golden Trigger - XAUUSD
Unlock your trading potential with The Golden Trigger, a powerful technical analysis strategy designed for XAUUSD. This custom indicator combines the synergy of moving averages and the MACD to provide clear buy and sell signals, optimizing your trading decisions.
Key Features:
SMA Crossovers: Utilizes the 2-period and 7-period Simple Moving Averages (SMAs) to spot short-term price momentum shifts, triggering buy or sell signals.
MACD Confirmation: The strategy only acts when the MACD aligns with the price action, ensuring you’re trading with the market's momentum.
Long-Term Trend Filter: The 200-period SMA ensures that your trades align with the overall market trend, helping you avoid counter-trend moves.
Real-Time Alerts: Get notified when it's time to act with the built-in alert conditions for both Buy and Sell signals.
Customizable and User-Friendly: Tailor the strategy to your preferences and trade with confidence.
This indicator is perfect for traders looking to catch short-term trends in gold (XAUUSD), with clear visual buy and sell markers that appear directly on the chart.
Why You Need This Indicator:
Stay ahead of the market with real-time signals
Filter trades to match the prevailing market trend
Enhance your trading strategy with a clear, simple-to-follow system
Unlock the power of The Golden Trigger today and make smarter, more confident trades!

High/Low MA Touch with Golden CrossHigh/Low MA Touch with Golden Cross
You can check short MA / Long MA Golden Cross
You can check buy timing with touching the short MA and oversole Stoch RSI
You can also check buy timing with touching the Long MA and oversole Stoch RSI

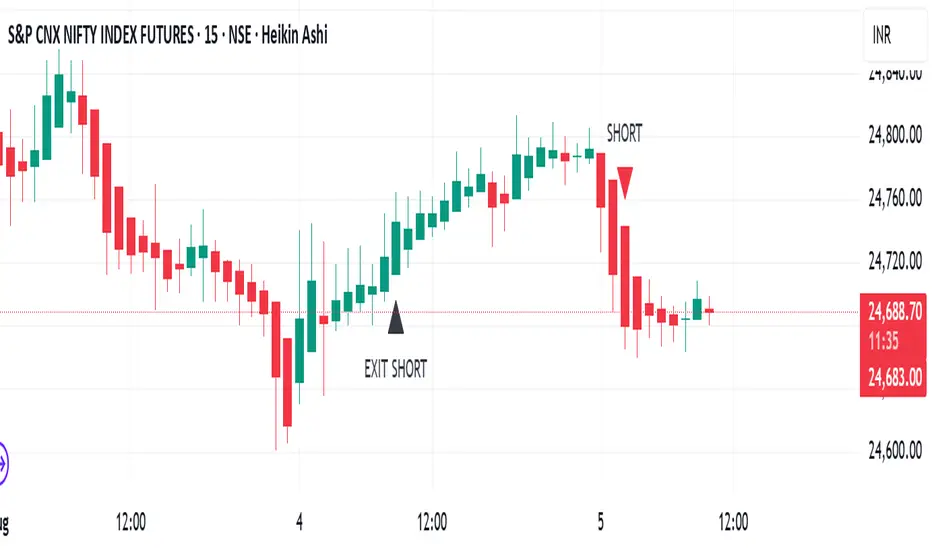
TrendRiderThis is an indicator to capture and ride trends in indices like Nifty50, Banknifty, Finnifty, Sensex, Gold,silver and crude oil. To be used mainly in futures and options.
Usage of this indicator:
1. 15 mins Timeframe to be set on chart
2. Candletype to made Heiken Ashi
3. Use on Futures charts of Nifty50, Banknifty, Finnifty, Sensex, Gold, Silver and Crude oil.
4. On trending days, can target minimum 100 points on Nifty50 and Finnifty, 200 pts on Banknifty, 250 pts on Sensex, 300 pts on Gold, 500 pts on Silver, 30 pts on Crude oil. All on futures. SL to be kept the same as target points, so R:R ratio is 1:1.
5. For options buy ATM CE/PE and can capture - 10% of premium on Nifty50 and Finnifty, 20% of premium on Banknifty, Sensex, Gold and Silver, 5% premium on Crude oil. SL to be kept same % as target.
6. Strictly exit as soon as you receive Exit signal whether in profit or loss.
7. Non repaint signals so you can enter as soon as you get buy/short signals and also exit as soon as you get exit signal.
8. You can target the fixed points as mentioned above, or just wait and ride till exit signal.
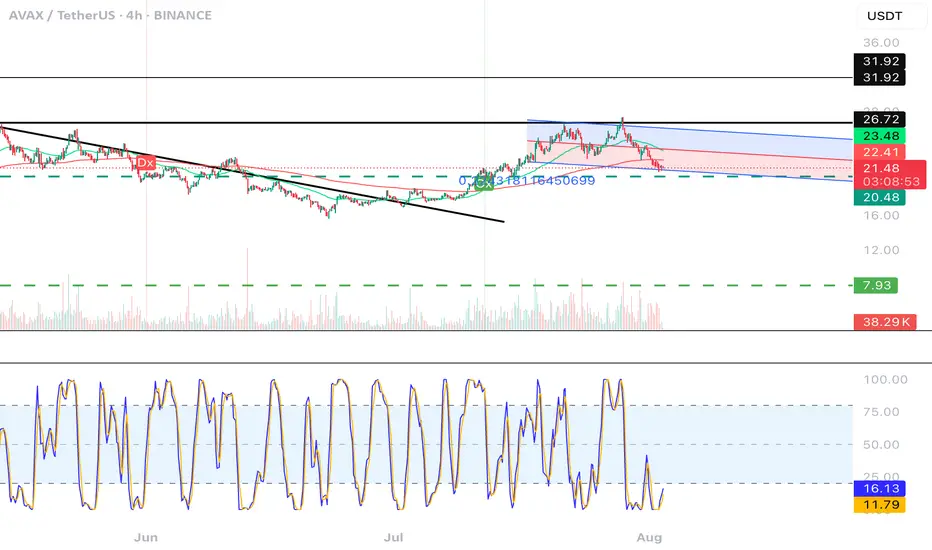
CGPT Golden Cross / Death Cross AlertThis custom indicator identifies Golden Cross (Gx) and Death Cross (Dx) events using either EMA or SMA moving averages. A Golden Cross occurs when a short-term MA (e.g., 50) crosses above a long-term MA (e.g., 200), signaling potential bullish momentum. A Death Cross signals potential bearish momentum, with the short-term MA crossing below the long-term MA.
It includes:
📈 Customizable MA types (EMA or SMA)
⚙️ Adjustable fast & slow MA lengths
🟢🔴 Chart labels for Gx (green) and Dx (red)
🎯 Background highlights for visual trend shifts
🔔 Built-in alert conditions for real-time notifications
Ideal for crypto, stocks, or forex swing and trend trading
THF Crossover and Trend Signals Golden & Death Cross with VolumeScript Overview:
This Pine Script is designed to assist traders in identifying key buy/sell signals and major trend changes on the chart using Exponential Moving Averages (EMA) and Simple Moving Averages (SMA), as well as visualizing Golden Cross and Death Cross events. The script also includes a volume indicator to highlight the volume trading activity in relation to the price movements.
Key Features:
1. Moving Averages:
EMA 21: Exponential Moving Average over a 21-period, shown in green.
EMA 50: Exponential Moving Average over a 50-period, shown in yellow.
SMA 50: Simple Moving Average over a 50-period, shown in red.
SMA 200: Simple Moving Average over a 200-period, shown in blue.
2. Signals:
Buy Signal: Generated when EMA 21 crosses above SMA 50, indicating a potential upward trend. Displayed with a green label below the price bar.
Sell Signal: Generated when EMA 21 crosses below SMA 50, indicating a potential downward trend. Displayed with a red label above the price bar.
3. Golden Cross (Bullish Trend):
A Golden Cross occurs when EMA 50 crosses above SMA 200, which often signals the start of a long-term upward trend. The signal is displayed with a yellow label below the price bar.
4. Death Cross (Bearish Trend):
A Death Cross occurs when EMA 50 crosses below SMA 200, which often signals the start of a long-term downward trend. The signal is displayed with a blue label above the price bar.
5. Volume Indicator:
The volume is plotted as colored columns. Green indicates higher volume than the 20-period moving average, and red indicates lower volume.
A Volume Moving Average (SMA 20) is also plotted to compare volume changes over time.
How the Script Works:
1. The EMA and SMA lines are plotted on the chart, providing a visual representation of the short- and long-term trends.
2. Buy/Sell signals are triggered based on the crossover between EMA 21 and SMA 50, helping to identify potential entry and exit points.
3. The Golden Cross and Death Cross indicators highlight major trend reversals based on the crossover between EMA 50 and SMA 200, providing clear visual cues for long-term trend changes.
4. Volume is displayed alongside price movements, offering insight into the strength or weakness of a trend.
Key Customizations:
Moving Average Periods: Users can modify the lengths of the EMAs and SMAs for customized analysis.
Volume Moving Average Period: The script allows for adjustment of the volume moving average period to suit different market conditions.
Signal Visibility: The size and color of the buy, sell, Golden Cross, and Death Cross signals can be easily customized to make them more prominent on the chart.
Conclusion:
This script is ideal for traders looking to combine price action with volume analysis, using key technical indicators such as EMA, SMA, Golden Cross, and Death Cross to make informed decisions in trending markets.
---
This explanation covers all aspects of the script and provides a clear understanding of its functionality, which is helpful for sharing the script or using it as an educational resource.

Auto Fib Extension with alert (golden rentry zone)Ideal for:
Traders who want an objective, auto-updating Fibonacci framework to identify potential continuation, or reaction zones after significant highs. The “Golden zone” highlights an area of particular interest for bounces, reactions, or consolidations. Once, price renters the Golden zone, 40% of the time, it will lead to 1.68 and 2.68 levels, making 80 to 200% once all time high is broken!!
This script automatically detects major swing points (all-time high and following swing low) using the last 1 year or 6 months of data, then draws Fibonacci retracement and extension levels from the all-time high (ATH) down to the lowest low after that high.
What it does:
Detects All-Time High (ATH) within your chosen lookback window (default: 1 year, falls back to 6 months if insufficient bars).
Finds the lowest low after ATH within the lookback period (ensures swing low always comes after swing high).
Plots Fibonacci retracement levels (0, 0.236, 0.382, 0.5, 0.618, 0.786, 1) from ATH to the swing low.
Issues an alert if price enters the Golden zone (between 0.236 and 0.382).

Multi SMA AnalyzerMulti SMA Analyzer with Custom SMA Table & Advanced Session Logic
A feature-rich SMA analysis suite for traders, offering up to 7 configurable SMAs, in-depth trend detection, real-time table, and true session-aware calculations.
Ideal for those who want to combine intraday, swing, and higher-timeframe trend analysis with maximum chart flexibility.
Key Features
📊 Multi-SMA Overlay
- 7 SMAs (default: 5, 20, 50, 100, 200, 21, 34)—individually configurable (period, source, color, line style)
- Show/hide each SMA, custom line style (solid, stepline, circles), and color logic
- Dynamic color: full opacity above SMA, reduced when below
⏰ Session-Aware SMAs
- Each SMA can be calculated using only user-defined session hours/days/timezone
- “Ignore extended hours” option for accurate intraday trend
📋 Smart Data Table
- Live SMA values, % distance from price, and directional arrows (↑/↓/→)
- Bull/Bear/Sideways trend classification
- Custom table position, size, colors, transparency
- Table can run on chart or custom (higher) timeframe for multi-TF analysis
🎯 Golden/Death Cross Detection
- Flexible crossover engine: select any two from (5, 10, 20, 50, 100, 200) for fast/slow SMA cross signals
- Plots icons (★ Golden, 💀 Death), optional crossover labels with custom size/colors
🏷️ SMA Labels
- Optional on-chart SMA period labels
- Custom placement (above/below/on line), size, color, offset
🚨 Signal & Trend Engine
- Bull/Bear/Sideways logic: price vs. multiple SMAs (not just one pair)
- Volume spike detection (2x 20-period SMA)
- Bullish engulfing candlestick detection
- All signals can use chart or custom table timeframe
🎨 Visual Customization
- Dynamic background color (Bull: green, Bear: red, Neutral: gray)
- Every visual aspect is customizable: label/table colors, transparency, size, position
🔔 Built-in Alerts
- Crossovers (SMA20/50, Golden/Death)
- Bull trend, volume spikes, engulfing pattern—all alert-ready
How It Works
- Session Filtering:
- SMAs can be set to count only bars from your chosen market session, for true intraday/trading-hour signals
Dynamic Table & Signals:
- Table and all signal logic run on your selected chart or custom timeframe
Flexible Crossover:
- Choose any pair (5, 10, 20, 50, 100, 200) for cross detection—SMA 10 is available for crossover even if not shown as an SMA line
Everything is modular:
- Toggle features, set visuals, and alerts to your workflow
🚨 How to Use Alerts
- All key signals (crossovers, trend shifts, volume spikes, engulfing patterns) are available as alert conditions.
To enable:
- Click the “Alerts” (clock) icon at the top of TradingView.
- Select your desired signal (e.g., “Golden Cross”) from the condition dropdown.
- Set your alert preferences and create the alert.
- Now, you’ll get notified automatically whenever a signal occurs!
Perfect For
- Multi-timeframe and swing traders seeking higher timeframe SMA confirmation
- Intraday traders who want to ignore pre/post-market data
- Anyone wanting a modern, powerful, fully customizable multi-SMA overlay
// P.S: Experiment with Golden Cross where Fast SMA is 5 and Slow SMA is 20.
// Set custom timeframe for 4 hr while monitoring your chart on 15 min time frame.
// Enable Background Color and Use Table Timeframe for Background.
// Uncheck Pine labels in Style tab.
Clean, open-source, and loaded with pro features—enjoy!
Like, share, and let me know if you'd like any new features added.

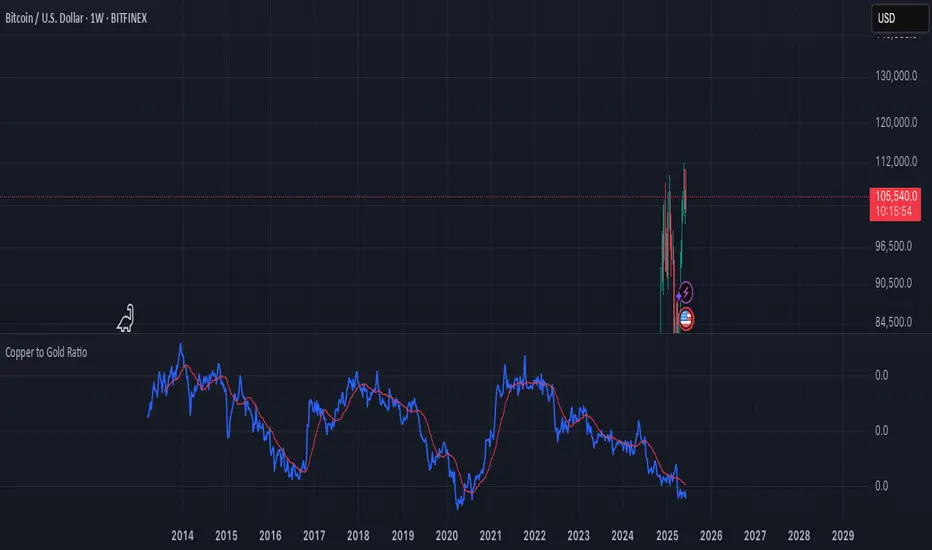
Copper to Gold Ratioratio = copper / gold: Calculates the ratio by dividing copper price by gold price.
plot(ratio): Plots the ratio as a blue line.
ma = ta.sma(ratio, 20): Adds a 20-period simple moving average (optional) to smooth the ratio, plotted as a red line.
A rising Copper/Gold ratio often signals economic expansion (strong copper demand relative to gold), while a falling ratio may indicate economic uncertainty or recession fears, as gold outperforms copper.
The ratio is also used as a leading indicator for 10-year U.S. Treasury yields, with a rising ratio often correlating with higher yields.
Sabbz Golden indicatorIndicator Name: Sabbz Golden Indicator
Short Title: Sabbz
Purpose: A comprehensive trading indicator designed for multiple trading styles (scalping, day trading, and trend following) by combining technical analysis tools such as EMAs, VWAP, support/resistance levels, order blocks, supply/demand zones, RSI, MACD, and volume analysis. It provides visual signals, trend analysis, and a dashboard for real-time decision-making.
Key Features
Exponential Moving Averages (EMAs):
Calculates four EMAs (Fast: 9, Medium: 21, Slow: 50, Trend: 200) to assess short, medium, and long-term trends.
Dynamic coloring based on trend direction:
Fast EMA: Lime (bullish), Red (bearish), Yellow (neutral).
Medium EMA: Blue (bullish), Orange (bearish), Gray (neutral).
Slow EMA: Green (bullish), Red (bearish), Purple (neutral).
Trend EMA: Green (bullish), Red (bearish).
Volume-Weighted Average Price (VWAP):
Plots VWAP with ±1σ deviation bands to identify dynamic support/resistance.
VWAP trend direction (bullish if close > VWAP and VWAP rising, bearish if close < VWAP and VWAP falling) informs trading signals.
Multi-Timeframe Analysis:
Incorporates 5-minute and 15-minute EMA (9 and 21) data to confirm trends across timeframes, enhancing signal reliability.
Support and Resistance Levels:
Detects key support/resistance levels using fractal-based pivot points (5-bar left/right lookback).
Tracks touches of levels (minimum 3 touches required) within a 50-bar lookback.
Levels are filtered to stay within ±0.5% of the current price to avoid clutter.
Break of structure (BoS) signals are generated when price breaks key levels by a user-defined threshold (default: 0.1%).
Order Blocks:
Identifies bullish and bearish order blocks based on strong price reversals with high volume.
Visualized as green (bullish) or red (bearish) boxes on the chart.
Supply and Demand Zones:
Detects fresh demand zones (price drops to a 10-bar low, bounces with high volume) and supply zones (price reaches a 10-bar high, reverses with high volume).
Plotted as blue (demand) or orange (supply) boxes, adjusted by ±0.5 ATR for width.
Scalping Signals:
Generates scalp long/short signals for 1-5 minute timeframes based on:
Short-term EMA trend (9 > 21 for long, 9 < 21 for short).
RSI oversold (<30, rising) for longs or overbought (>70, falling) for shorts.
MACD momentum (histogram positive and rising for longs, negative and falling for shorts).
Volume spike (volume > 1.5x 20-period SMA).
Price above/below VWAP.
Day Trading Signals:
Generates day trading long/short signals for 5-15 minute timeframes based on:
Medium-term trend (EMA 9 > 21 and 21 > 50 for long, opposite for short).
Break of key resistance (long) or support (short).
Multi-timeframe EMA confirmation (5m and 15m).
Volume spike.
Trend Following Signals:
Generates swing/position trading signals based on:
Strong trend (short, medium, long-term EMAs aligned, VWAP trend, and multi-timeframe confirmation).
Presence of fresh demand/supply zones or order blocks.
RSI not overextended (<60 for longs, >40 for shorts).
Volume Analysis:
Uses a 20-period SMA of volume to detect spikes (>1.5x SMA) and high volume (>2x SMA) for signal confirmation.
Dashboard:
Displays real-time data in a top-right table with:
Timeframe: Scalping, Day Trading, Trend Following.
Trend: Bullish, Bearish, Neutral, or Strong Bull/Bear based on EMA and VWAP conditions.
Signal: Long, Short, or Wait based on entry conditions.
Levels: Key support, resistance, VWAP, and RSI values with status (Overbought, Oversold, Neutral).
Color-coded for quick interpretation.
Visual Elements:
Plots EMAs, VWAP, support/resistance levels, order blocks, and supply/demand zones.
Entry signals are marked with triangles (up for long, down for short) of varying sizes (small for scalping, normal for day trading, large for trend following) and colors (e.g., aqua for scalp long, purple for scalp short).
Background coloring indicates trend strength (green for bullish, red for bearish, gray for neutral).
Alerts:
Configurable alerts for:
Scalping Long/Short entries.
Day Trading Long/Short entries.
Trend Following Long/Short entries.
Resistance/Support breaks.
Input Parameters
EMAs:
Fast EMA (default: 9), Medium EMA (21), Slow EMA (50), Trend EMA (200).
Support/Resistance:
Lookback (50 bars), Minimum Touches (3), Break Threshold (0.1%).
Scalping:
RSI Length (14), Overbought (70), Oversold (30), Volume MA (20).
Display Options:
Toggle signals, support/resistance levels, supply/demand zones, and order blocks (all default to true).
Usage
Scalping: Use on 1-5 minute charts for quick entries/exits based on scalp signals.
Day Trading: Use on 5-15 minute charts for break-of-structure trades with multi-timeframe confirmation.
Trend Following: Use on higher timeframes (e.g., 1H, 4H) for swing/position trades aligned with strong trends.
Dashboard: Monitor trend and signal status for all timeframes in real-time.
Alerts: Set up alerts to automate trade notifications.
Notes
Performance: The indicator is computationally intensive due to multi-timeframe calculations and array-based support/resistance logic. Test on your platform to ensure smooth performance.
Customization: Adjust input parameters (e.g., EMA lengths, RSI thresholds) to suit specific markets or trading styles.
Limitations: Signals are based on historical data and technical conditions; always combine with risk management and market context.

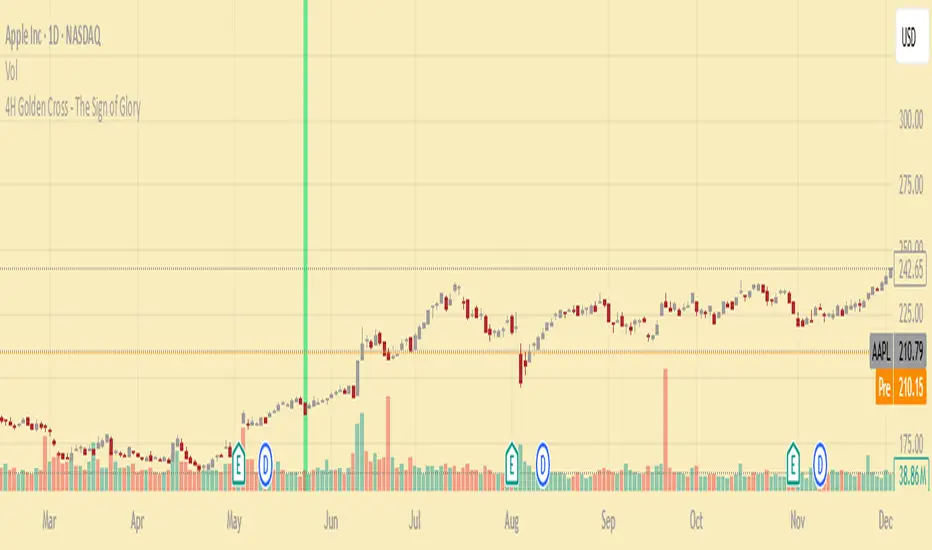
4H Golden Cross - The Sign of GloryCalculates the golden cross on the 4-hour timeframe
Displays the result on any timeframe
Draws a green vertical beam (a vertical line or background stripe) on the bar where the golden cross happened, so it’s clearly visible regardless of your chart timeframe
This is used to see the effectiveness of the 4h golden cross without having to change timeframes continually