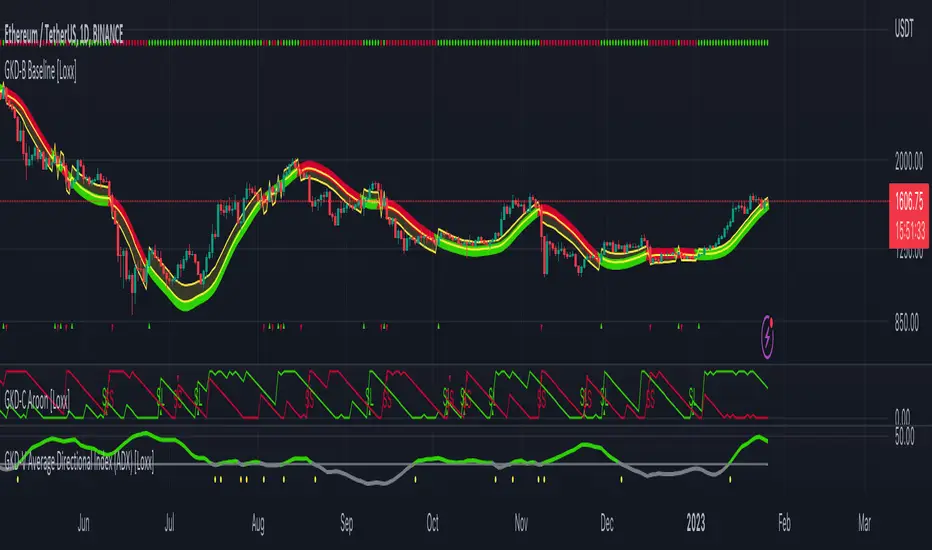
GKD-C Aroon [Loxx]Giga Kaleidoscope Aroon is a Confirmation module included in Loxx's "Giga Kaleidoscope Modularized Trading System".
█ Giga Kaleidoscope Modularized Trading System
What is Loxx's "Giga Kaleidoscope Modularized Trading System"?
The Giga Kaleidoscope Modularized Trading System is a trading system built on the philosophy of the NNFX (No Nonsense Forex) algorithmic trading.
What is an NNFX algorithmic trading strategy?
The NNFX algorithm is built on the principles of trend, momentum, and volatility. There are six core components in the NNFX trading algorithm:
1. Volatility - price volatility; e.g., Average True Range, True Range Double, Close-to-Close, etc.
2. Baseline - a moving average to identify price trend
3. Confirmation 1 - a technical indicator used to identify trends.
4. Confirmation 2 - a technical indicator used to identify trends.
5. Continuation - a technical indicator used to identify trends.
6. Volatility/Volume - a technical indicator used to identify volatility/volume breakouts/breakdown.
7. Exit - a technical indicator used to determine when a trend is exhausted.
How does Loxx's GKD (Giga Kaleidoscope Modularized Trading System) implement the NNFX algorithm outlined above?
Loxx's GKD v1.0 system has five types of modules (indicators/strategies). These modules are:
1. GKD-BT - Backtesting module (Volatility, Number 1 in the NNFX algorithm)
2. GKD-B - Baseline module (Baseline and Volatility/Volume, Numbers 1 and 2 in the NNFX algorithm)
3. GKD-C - Confirmation 1/2 and Continuation module (Confirmation 1/2 and Continuation, Numbers 3, 4, and 5 in the NNFX algorithm)
4. GKD-V - Volatility/Volume module (Confirmation 1/2, Number 6 in the NNFX algorithm)
5. GKD-E - Exit module (Exit, Number 7 in the NNFX algorithm)
(additional module types will added in future releases)
Each module interacts with every module by passing data between modules. Data is passed between each module as described below:
GKD-B => GKD-V => GKD-C(1) => GKD-C(2) => GKD-C(Continuation) => GKD-E => GKD-BT
That is, the Baseline indicator passes its data to Volatility/Volume. The Volatility/Volume indicator passes its values to the Confirmation 1 indicator. The Confirmation 1 indicator passes its values to the Confirmation 2 indicator. The Confirmation 2 indicator passes its values to the Continuation indicator. The Continuation indicator passes its values to the Exit indicator, and finally, the Exit indicator passes its values to the Backtest strategy.
This chaining of indicators requires that each module conform to Loxx's GKD protocol, therefore allowing for the testing of every possible combination of technical indicators that make up the six components of the NNFX algorithm.
What does the application of the GKD trading system look like?
Example trading system:
Backtest: Strategy with 1-3 take profits, trailing stop loss, multiple types of PnL volatility, and 2 backtesting styles
Baseline: Leader Exponential Moving Average as shown on the chart above
Volatility/Volume: Average Directional Index (ADX) as shown on the chart above
Confirmation 1: Aroon as shown on the chart above
Confirmation 2: Williams Percent Range
Continuation: Fisher Transform
Exit: Rex Oscillator
Each GKD indicator is denoted with a module identifier of either: GKD-BT, GKD-B, GKD-C, GKD-V, or GKD-E. This allows traders to understand to which module each indicator belongs and where each indicator fits into the GKD protocol chain.
Giga Kaleidoscope Modularized Trading System Signals (based on the NNFX algorithm)
Standard Entry
1. GKD-C Confirmation 1 Signal
2. GKD-B Baseline agrees
3. Price is within a range of 0.2x Volatility and 1.0x Volatility of the Goldie Locks Mean
4. GKD-C Confirmation 2 agrees
5. GKD-V Volatility/Volume agrees
Baseline Entry
1. GKD-B Baseline signal
2. GKD-C Confirmation 1 agrees
3. Price is within a range of 0.2x Volatility and 1.0x Volatility of the Goldie Locks Mean
4. GKD-C Confirmation 2 agrees
5. GKD-V Volatility/Volume agrees
6. GKD-C Confirmation 1 signal was less than 7 candles prior
Continuation Entry
1. Standard Entry, Baseline Entry, or Pullback; entry triggered previously
2. GKD-B Baseline hasn't crossed since entry signal trigger
3. GKD-C Confirmation Continuation Indicator signals
4. GKD-C Confirmation 1 agrees
5. GKD-B Baseline agrees
6. GKD-C Confirmation 2 agrees
1-Candle Rule Standard Entry
1. GKD-C Confirmation 1 signal
2. GKD-B Baseline agrees
3. Price is within a range of 0.2x Volatility and 1.0x Volatility of the Goldie Locks Mean
Next Candle:
1. Price retraced (Long: close < close or Short: close > close )
2. GKD-B Baseline agrees
3. GKD-C Confirmation 1 agrees
4. GKD-C Confirmation 2 agrees
5. GKD-V Volatility/Volume agrees
1-Candle Rule Baseline Entry
1. GKD-B Baseline signal
2. GKD-C Confirmation 1 agrees
3. Price is within a range of 0.2x Volatility and 1.0x Volatility of the Goldie Locks Mean
4. GKD-C Confirmation 1 signal was less than 7 candles prior
Next Candle:
1. Price retraced (Long: close < close or Short: close > close )
2. GKD-B Baseline agrees
3. GKD-C Confirmation 1 agrees
4. GKD-C Confirmation 2 agrees
5. GKD-V Volatility/Volume Agrees
PullBack Entry
1. GKD-B Baseline signal
2. GKD-C Confirmation 1 agrees
3. Price is beyond 1.0x Volatility of Baseline
Next Candle:
1. Price is within a range of 0.2x Volatility and 1.0x Volatility of the Goldie Locks Mean
3. GKD-C Confirmation 1 agrees
4. GKD-C Confirmation 2 agrees
5. GKD-V Volatility/Volume Agrees
█ Aroon
What is Aroon?
The Aroon indicator is a technical indicator that is used to identify trend changes in the price of an asset, as well as the strength of that trend. In essence, the indicator measures the time between highs and the time between lows over a time period. The idea is that strong uptrends will regularly see new highs, and strong downtrends will regularly see new lows. The indicator signals when this is happening, and when it isn't.
Requirements
Inputs
Confirmation 1 and Solo Confirmation: GKD-V Volatility / Volume indicator
Confirmation 2: GKD-C Confirmation indicator
Outputs
Confirmation 2 and Solo Confirmation: GKD-E Exit indicator
Confirmation 1: GKD-C Confirmation indicator
Continuation: GKD-E Exit indicator
Additional features will be added in future releases.
This indicator is only available to ALGX Trading VIP group members . You can see the Author's Instructions below to get more information on how to get access.
在腳本中搜尋"GOLD"
GKD-C Vortex [Loxx]Giga Kaleidoscope Vortex is a Confirmation module included in Loxx's "Giga Kaleidoscope Modularized Trading System".
█ Giga Kaleidoscope Modularized Trading System
What is Loxx's "Giga Kaleidoscope Modularized Trading System"?
The Giga Kaleidoscope Modularized Trading System is a trading system built on the philosophy of the NNFX (No Nonsense Forex) algorithmic trading.
What is an NNFX algorithmic trading strategy?
The NNFX algorithm is built on the principles of trend, momentum, and volatility. There are six core components in the NNFX trading algorithm:
1. Volatility - price volatility; e.g., Average True Range, True Range Double, Close-to-Close, etc.
2. Baseline - a moving average to identify price trend
3. Confirmation 1 - a technical indicator used to identify trends.
4. Confirmation 2 - a technical indicator used to identify trends.
5. Continuation - a technical indicator used to identify trends.
6. Volatility/Volume - a technical indicator used to identify volatility/volume breakouts/breakdown.
7. Exit - a technical indicator used to determine when a trend is exhausted.
How does Loxx's GKD (Giga Kaleidoscope Modularized Trading System) implement the NNFX algorithm outlined above?
Loxx's GKD v1.0 system has five types of modules (indicators/strategies). These modules are:
1. GKD-BT - Backtesting module (Volatility, Number 1 in the NNFX algorithm)
2. GKD-B - Baseline module (Baseline and Volatility/Volume, Numbers 1 and 2 in the NNFX algorithm)
3. GKD-C - Confirmation 1/2 and Continuation module (Confirmation 1/2 and Continuation, Numbers 3, 4, and 5 in the NNFX algorithm)
4. GKD-V - Volatility/Volume module (Confirmation 1/2, Number 6 in the NNFX algorithm)
5. GKD-E - Exit module (Exit, Number 7 in the NNFX algorithm)
(additional module types will added in future releases)
Each module interacts with every module by passing data between modules. Data is passed between each module as described below:
GKD-B => GKD-V => GKD-C(1) => GKD-C(2) => GKD-C(Continuation) => GKD-E => GKD-BT
That is, the Baseline indicator passes its data to Volatility/Volume. The Volatility/Volume indicator passes its values to the Confirmation 1 indicator. The Confirmation 1 indicator passes its values to the Confirmation 2 indicator. The Confirmation 2 indicator passes its values to the Continuation indicator. The Continuation indicator passes its values to the Exit indicator, and finally, the Exit indicator passes its values to the Backtest strategy.
This chaining of indicators requires that each module conform to Loxx's GKD protocol, therefore allowing for the testing of every possible combination of technical indicators that make up the six components of the NNFX algorithm.
What does the application of the GKD trading system look like?
Example trading system:
Backtest: Strategy with 1-3 take profits, trailing stop loss, multiple types of PnL volatility, and 2 backtesting styles
Baseline: Leader Exponential Moving Average as shown on the chart above
Volatility/Volume: Average Directional Index (ADX) as shown on the chart above
Confirmation 1: Vortex as shown on the chart above
Confirmation 2: DiNapoli Stochastic
Continuation: Fisher Transform
Exit: Rex Oscillator
Each GKD indicator is denoted with a module identifier of either: GKD-BT, GKD-B, GKD-C, GKD-V, or GKD-E. This allows traders to understand to which module each indicator belongs and where each indicator fits into the GKD protocol chain.
Giga Kaleidoscope Modularized Trading System Signals (based on the NNFX algorithm)
Standard Entry
1. GKD-C Confirmation 1 Signal
2. GKD-B Baseline agrees
3. Price is within a range of 0.2x Volatility and 1.0x Volatility of the Goldie Locks Mean
4. GKD-C Confirmation 2 agrees
5. GKD-V Volatility/Volume agrees
Baseline Entry
1. GKD-B Baseline signal
2. GKD-C Confirmation 1 agrees
3. Price is within a range of 0.2x Volatility and 1.0x Volatility of the Goldie Locks Mean
4. GKD-C Confirmation 2 agrees
5. GKD-V Volatility/Volume agrees
6. GKD-C Confirmation 1 signal was less than 7 candles prior
Continuation Entry
1. Standard Entry, Baseline Entry, or Pullback; entry triggered previously
2. GKD-B Baseline hasn't crossed since entry signal trigger
3. GKD-C Confirmation Continuation Indicator signals
4. GKD-C Confirmation 1 agrees
5. GKD-B Baseline agrees
6. GKD-C Confirmation 2 agrees
1-Candle Rule Standard Entry
1. GKD-C Confirmation 1 signal
2. GKD-B Baseline agrees
3. Price is within a range of 0.2x Volatility and 1.0x Volatility of the Goldie Locks Mean
Next Candle:
1. Price retraced (Long: close < close or Short: close > close )
2. GKD-B Baseline agrees
3. GKD-C Confirmation 1 agrees
4. GKD-C Confirmation 2 agrees
5. GKD-V Volatility/Volume agrees
1-Candle Rule Baseline Entry
1. GKD-B Baseline signal
2. GKD-C Confirmation 1 agrees
3. Price is within a range of 0.2x Volatility and 1.0x Volatility of the Goldie Locks Mean
4. GKD-C Confirmation 1 signal was less than 7 candles prior
Next Candle:
1. Price retraced (Long: close < close or Short: close > close )
2. GKD-B Baseline agrees
3. GKD-C Confirmation 1 agrees
4. GKD-C Confirmation 2 agrees
5. GKD-V Volatility/Volume Agrees
PullBack Entry
1. GKD-B Baseline signal
2. GKD-C Confirmation 1 agrees
3. Price is beyond 1.0x Volatility of Baseline
Next Candle:
1. Price is within a range of 0.2x Volatility and 1.0x Volatility of the Goldie Locks Mean
3. GKD-C Confirmation 1 agrees
4. GKD-C Confirmation 2 agrees
5. GKD-V Volatility/Volume Agrees
█ Vortex
What is Vortex?
The Vortex indicator is an indicator composed of two lines - an uptrend line (VI+) and a downtrend line (VI-). These lines are typically colored green and red respectively. A vortex indicator is used to spot trend reversals and confirm current trends.
Requirements
Inputs
Confirmation 1 and Solo Confirmation: GKD-V Volatility / Volume indicator
Confirmation 2: GKD-C Confirmation indicator
Outputs
Confirmation 2 and Solo Confirmation: GKD-E Exit indicator
Confirmation 1: GKD-C Confirmation indicator
Continuation: GKD-E Exit indicator
Additional features will be added in future releases.
This indicator is only available to ALGX Trading VIP group members . You can see the Author's Instructions below to get more information on how to get access.

GKD-C Trend Continuation Factor [Loxx]Giga Kaleidoscope Trend Continuation Factor is a Confirmation module included in Loxx's "Giga Kaleidoscope Modularized Trading System".
█ Giga Kaleidoscope Modularized Trading System
What is Loxx's "Giga Kaleidoscope Modularized Trading System"?
The Giga Kaleidoscope Modularized Trading System is a trading system built on the philosophy of the NNFX (No Nonsense Forex) algorithmic trading.
What is an NNFX algorithmic trading strategy?
The NNFX algorithm is built on the principles of trend, momentum, and volatility. There are six core components in the NNFX trading algorithm:
1. Volatility - price volatility; e.g., Average True Range, True Range Double, Close-to-Close, etc.
2. Baseline - a moving average to identify price trend
3. Confirmation 1 - a technical indicator used to identify trends.
4. Confirmation 2 - a technical indicator used to identify trends.
5. Continuation - a technical indicator used to identify trends.
6. Volatility/Volume - a technical indicator used to identify volatility/volume breakouts/breakdown.
7. Exit - a technical indicator used to determine when a trend is exhausted.
How does Loxx's GKD (Giga Kaleidoscope Modularized Trading System) implement the NNFX algorithm outlined above?
Loxx's GKD v1.0 system has five types of modules (indicators/strategies). These modules are:
1. GKD-BT - Backtesting module (Volatility, Number 1 in the NNFX algorithm)
2. GKD-B - Baseline module (Baseline and Volatility/Volume, Numbers 1 and 2 in the NNFX algorithm)
3. GKD-C - Confirmation 1/2 and Continuation module (Confirmation 1/2 and Continuation, Numbers 3, 4, and 5 in the NNFX algorithm)
4. GKD-V - Volatility/Volume module (Confirmation 1/2, Number 6 in the NNFX algorithm)
5. GKD-E - Exit module (Exit, Number 7 in the NNFX algorithm)
(additional module types will added in future releases)
Each module interacts with every module by passing data between modules. Data is passed between each module as described below:
GKD-B => GKD-V => GKD-C(1) => GKD-C(2) => GKD-C(Continuation) => GKD-E => GKD-BT
That is, the Baseline indicator passes its data to Volatility/Volume. The Volatility/Volume indicator passes its values to the Confirmation 1 indicator. The Confirmation 1 indicator passes its values to the Confirmation 2 indicator. The Confirmation 2 indicator passes its values to the Continuation indicator. The Continuation indicator passes its values to the Exit indicator, and finally, the Exit indicator passes its values to the Backtest strategy.
This chaining of indicators requires that each module conform to Loxx's GKD protocol, therefore allowing for the testing of every possible combination of technical indicators that make up the six components of the NNFX algorithm.
What does the application of the GKD trading system look like?
Example trading system:
Backtest: Strategy with 1-3 take profits, trailing stop loss, multiple types of PnL volatility, and 2 backtesting styles
Baseline: Leader Exponential Moving Average as shown on the chart above
Volatility/Volume: Average Directional Index (ADX) as shown on the chart above
Confirmation 1: Trend Continuation Factor as shown on the chart above
Confirmation 2: Jurik Turning Point Oscillator
Continuation: Fisher Transform
Exit: Rex Oscillator
Each GKD indicator is denoted with a module identifier of either: GKD-BT, GKD-B, GKD-C, GKD-V, or GKD-E. This allows traders to understand to which module each indicator belongs and where each indicator fits into the GKD protocol chain.
Giga Kaleidoscope Modularized Trading System Signals (based on the NNFX algorithm)
Standard Entry
1. GKD-C Confirmation 1 Signal
2. GKD-B Baseline agrees
3. Price is within a range of 0.2x Volatility and 1.0x Volatility of the Goldie Locks Mean
4. GKD-C Confirmation 2 agrees
5. GKD-V Volatility/Volume agrees
Baseline Entry
1. GKD-B Baseline signal
2. GKD-C Confirmation 1 agrees
3. Price is within a range of 0.2x Volatility and 1.0x Volatility of the Goldie Locks Mean
4. GKD-C Confirmation 2 agrees
5. GKD-V Volatility/Volume agrees
6. GKD-C Confirmation 1 signal was less than 7 candles prior
Continuation Entry
1. Standard Entry, Baseline Entry, or Pullback; entry triggered previously
2. GKD-B Baseline hasn't crossed since entry signal trigger
3. GKD-C Confirmation Continuation Indicator signals
4. GKD-C Confirmation 1 agrees
5. GKD-B Baseline agrees
6. GKD-C Confirmation 2 agrees
1-Candle Rule Standard Entry
1. GKD-C Confirmation 1 signal
2. GKD-B Baseline agrees
3. Price is within a range of 0.2x Volatility and 1.0x Volatility of the Goldie Locks Mean
Next Candle:
1. Price retraced (Long: close < close or Short: close > close )
2. GKD-B Baseline agrees
3. GKD-C Confirmation 1 agrees
4. GKD-C Confirmation 2 agrees
5. GKD-V Volatility/Volume agrees
1-Candle Rule Baseline Entry
1. GKD-B Baseline signal
2. GKD-C Confirmation 1 agrees
3. Price is within a range of 0.2x Volatility and 1.0x Volatility of the Goldie Locks Mean
4. GKD-C Confirmation 1 signal was less than 7 candles prior
Next Candle:
1. Price retraced (Long: close < close or Short: close > close )
2. GKD-B Baseline agrees
3. GKD-C Confirmation 1 agrees
4. GKD-C Confirmation 2 agrees
5. GKD-V Volatility/Volume Agrees
PullBack Entry
1. GKD-B Baseline signal
2. GKD-C Confirmation 1 agrees
3. Price is beyond 1.0x Volatility of Baseline
Next Candle:
1. Price is within a range of 0.2x Volatility and 1.0x Volatility of the Goldie Locks Mean
3. GKD-C Confirmation 1 agrees
4. GKD-C Confirmation 2 agrees
5. GKD-V Volatility/Volume Agrees
█ Trend Continuation Factor
What is Trend Continuation Factor
The Trend Continuation Factor ( TCF ) identifies the trend and its direction. TCF was introduced by M. H. Pee. Positive values of either the Positive Trend Continuation Factor (TCF+) and the Negative Trend Continuation Factor (TCF-) indicate the presence of a strong trend.
Requirements
Inputs
Confirmation 1 and Solo Confirmation: GKD-V Volatility / Volume indicator
Confirmation 2: GKD-C Confirmation indicator
Outputs
Confirmation 2 and Solo Confirmation: GKD-E Exit indicator
Confirmation 1: GKD-C Confirmation indicator
Continuation: GKD-E Exit indicator
Additional features will be added in future releases.
This indicator is only available to ALGX Trading VIP group members . You can see the Author's Instructions below to get more information on how to get access.

GKD-C Trading Channel Index [Loxx]Giga Kaleidoscope Trading Channel Index is a Confirmation module included in Loxx's "Giga Kaleidoscope Modularized Trading System".
█ Giga Kaleidoscope Modularized Trading System
What is Loxx's "Giga Kaleidoscope Modularized Trading System"?
The Giga Kaleidoscope Modularized Trading System is a trading system built on the philosophy of the NNFX (No Nonsense Forex) algorithmic trading.
What is an NNFX algorithmic trading strategy?
The NNFX algorithm is built on the principles of trend, momentum, and volatility. There are six core components in the NNFX trading algorithm:
1. Volatility - price volatility; e.g., Average True Range, True Range Double, Close-to-Close, etc.
2. Baseline - a moving average to identify price trend
3. Confirmation 1 - a technical indicator used to identify trends.
4. Confirmation 2 - a technical indicator used to identify trends.
5. Continuation - a technical indicator used to identify trends.
6. Volatility/Volume - a technical indicator used to identify volatility/volume breakouts/breakdown.
7. Exit - a technical indicator used to determine when a trend is exhausted.
How does Loxx's GKD (Giga Kaleidoscope Modularized Trading System) implement the NNFX algorithm outlined above?
Loxx's GKD v1.0 system has five types of modules (indicators/strategies). These modules are:
1. GKD-BT - Backtesting module (Volatility, Number 1 in the NNFX algorithm)
2. GKD-B - Baseline module (Baseline and Volatility/Volume, Numbers 1 and 2 in the NNFX algorithm)
3. GKD-C - Confirmation 1/2 and Continuation module (Confirmation 1/2 and Continuation, Numbers 3, 4, and 5 in the NNFX algorithm)
4. GKD-V - Volatility/Volume module (Confirmation 1/2, Number 6 in the NNFX algorithm)
5. GKD-E - Exit module (Exit, Number 7 in the NNFX algorithm)
(additional module types will added in future releases)
Each module interacts with every module by passing data between modules. Data is passed between each module as described below:
GKD-B => GKD-V => GKD-C(1) => GKD-C(2) => GKD-C(Continuation) => GKD-E => GKD-BT
That is, the Baseline indicator passes its data to Volatility/Volume. The Volatility/Volume indicator passes its values to the Confirmation 1 indicator. The Confirmation 1 indicator passes its values to the Confirmation 2 indicator. The Confirmation 2 indicator passes its values to the Continuation indicator. The Continuation indicator passes its values to the Exit indicator, and finally, the Exit indicator passes its values to the Backtest strategy.
This chaining of indicators requires that each module conform to Loxx's GKD protocol, therefore allowing for the testing of every possible combination of technical indicators that make up the six components of the NNFX algorithm.
What does the application of the GKD trading system look like?
Example trading system:
Backtest: Strategy with 1-3 take profits, trailing stop loss, multiple types of PnL volatility, and 2 backtesting styles
Baseline: Hull Moving Average as shown on the chart above
Volatility/Volume: Average Directional Index (ADX) as shown on the chart above
Confirmation 1: Trading Channel Index as shown on the chart above
Confirmation 2: Jurik Turning Point Oscillator
Continuation: Fisher Transform
Exit: Rex Oscillator
Each GKD indicator is denoted with a module identifier of either: GKD-BT, GKD-B, GKD-C, GKD-V, or GKD-E. This allows traders to understand to which module each indicator belongs and where each indicator fits into the GKD protocol chain.
Giga Kaleidoscope Modularized Trading System Signals (based on the NNFX algorithm)
Standard Entry
1. GKD-C Confirmation 1 Signal
2. GKD-B Baseline agrees
3. Price is within a range of 0.2x Volatility and 1.0x Volatility of the Goldie Locks Mean
4. GKD-C Confirmation 2 agrees
5. GKD-V Volatility/Volume agrees
Baseline Entry
1. GKD-B Baseline signal
2. GKD-C Confirmation 1 agrees
3. Price is within a range of 0.2x Volatility and 1.0x Volatility of the Goldie Locks Mean
4. GKD-C Confirmation 2 agrees
5. GKD-V Volatility/Volume agrees
6. GKD-C Confirmation 1 signal was less than 7 candles prior
Continuation Entry
1. Standard Entry, Baseline Entry, or Pullback; entry triggered previously
2. GKD-B Baseline hasn't crossed since entry signal trigger
3. GKD-C Confirmation Continuation Indicator signals
4. GKD-C Confirmation 1 agrees
5. GKD-B Baseline agrees
6. GKD-C Confirmation 2 agrees
1-Candle Rule Standard Entry
1. GKD-C Confirmation 1 signal
2. GKD-B Baseline agrees
3. Price is within a range of 0.2x Volatility and 1.0x Volatility of the Goldie Locks Mean
Next Candle:
1. Price retraced (Long: close < close or Short: close > close )
2. GKD-B Baseline agrees
3. GKD-C Confirmation 1 agrees
4. GKD-C Confirmation 2 agrees
5. GKD-V Volatility/Volume agrees
1-Candle Rule Baseline Entry
1. GKD-B Baseline signal
2. GKD-C Confirmation 1 agrees
3. Price is within a range of 0.2x Volatility and 1.0x Volatility of the Goldie Locks Mean
4. GKD-C Confirmation 1 signal was less than 7 candles prior
Next Candle:
1. Price retraced (Long: close < close or Short: close > close )
2. GKD-B Baseline agrees
3. GKD-C Confirmation 1 agrees
4. GKD-C Confirmation 2 agrees
5. GKD-V Volatility/Volume Agrees
PullBack Entry
1. GKD-B Baseline signal
2. GKD-C Confirmation 1 agrees
3. Price is beyond 1.0x Volatility of Baseline
Next Candle:
1. Price is within a range of 0.2x Volatility and 1.0x Volatility of the Goldie Locks Mean
3. GKD-C Confirmation 1 agrees
4. GKD-C Confirmation 2 agrees
5. GKD-V Volatility/Volume Agrees
█ Trading Channel Index
What is Trading Channel Index
The Trading Channel Index measures the location of average daily price relative to a smoothed average of average daily price. It is derived from the average difference between these two values.
Requirements
Inputs
Confirmation 1 and Solo Confirmation: GKD-V Volatility / Volume indicator
Confirmation 2: GKD-C Confirmation indicator
Continuation: GKD-C Confirmation indicator
Outputs
Confirmation 2 and Solo Confirmation: GKD-E Exit indicator
Confirmation 1: GKD-C Confirmation indicator
Continuation: GKD-E Exit indicator
Additional features will be added in future releases.
This indicator is only available to ALGX Trading VIP group members . You can see the Author's Instructions below to get more information on how to get access.

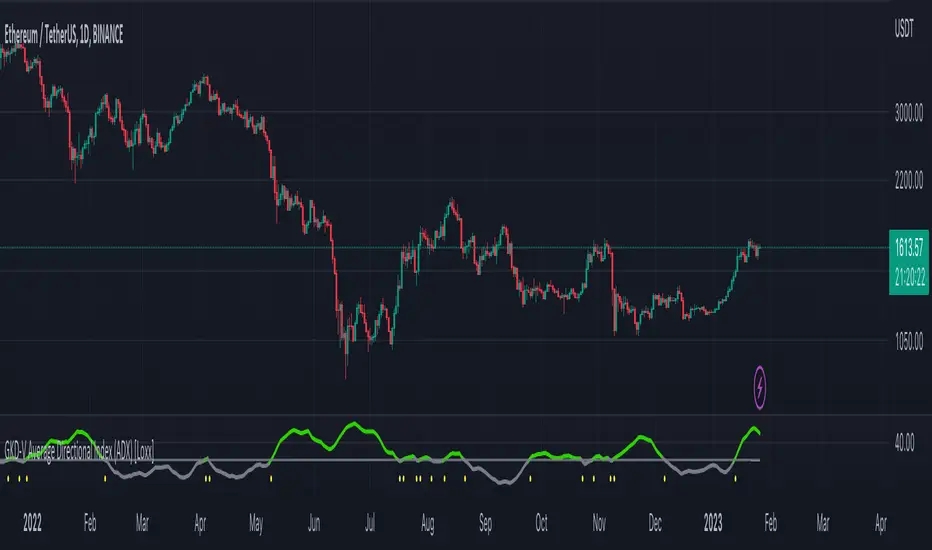
GKD-V Average Directional Index (ADX) [Loxx]Giga Kaleidoscope Average Directional Index (ADX) is a Volatility/Volume module included in Loxx's "Giga Kaleidoscope Modularized Trading System".
█ Giga Kaleidoscope Modularized Trading System
What is Loxx's "Giga Kaleidoscope Modularized Trading System"?
The Giga Kaleidoscope Modularized Trading System is a trading system built on the philosophy of the NNFX (No Nonsense Forex) algorithmic trading.
What is an NNFX algorithmic trading strategy?
The NNFX algorithm is built on the principles of trend, momentum, and volatility. There are six core components in the NNFX trading algorithm:
1. Volatility - price volatility; e.g., Average True Range, True Range Double, Close-to-Close, etc.
2. Baseline - a moving average to identify price trend
3. Confirmation 1 - a technical indicator used to identify trends.
4. Confirmation 2 - a technical indicator used to identify trends.
5. Continuation - a technical indicator used to identify trends.
6. Volatility/Volume - a technical indicator used to identify volatility/volume breakouts/breakdown.
7. Exit - a technical indicator used to determine when a trend is exhausted.
How does Loxx's GKD (Giga Kaleidoscope Modularized Trading System) implement the NNFX algorithm outlined above?
Loxx's GKD v1.0 system has five types of modules (indicators/strategies). These modules are:
1. GKD-BT - Backtesting module (Volatility, Number 1 in the NNFX algorithm)
2. GKD-B - Baseline module (Baseline and Volatility/Volume, Numbers 1 and 2 in the NNFX algorithm)
3. GKD-C - Confirmation 1/2 and Continuation module (Confirmation 1/2 and Continuation, Numbers 3, 4, and 5 in the NNFX algorithm)
4. GKD-V - Volatility/Volume module (Confirmation 1/2, Number 6 in the NNFX algorithm)
5. GKD-E - Exit module (Exit, Number 7 in the NNFX algorithm)
(additional module types will added in future releases)
Each module interacts with every module by passing data between modules. Data is passed between each module as described below:
GKD-B => GKD-V => GKD-C(1) => GKD-C(2) => GKD-C(Continuation) => GKD-E => GKD-BT
That is, the Baseline indicator passes its data to Volatility/Volume. The Volatility/Volume indicator passes its values to the Confirmation 1 indicator. The Confirmation 1 indicator passes its values to the Confirmation 2 indicator. The Confirmation 2 indicator passes its values to the Continuation indicator. The Continuation indicator passes its values to the Exit indicator, and finally, the Exit indicator passes its values to the Backtest strategy.
This chaining of indicators requires that each module conform to Loxx's GKD protocol, therefore allowing for the testing of every possible combination of technical indicators that make up the six components of the NNFX algorithm.
What does the application of the GKD trading system look like?
Example trading system:
Backtest: Strategy with 1-3 take profits, trailing stop loss, multiple types of PnL volatility, and 2 backtesting styles
Baseline: Leader Exponential Moving Average
Volatility/Volume: Average Directional Index (ADX) as shown on the chart above
Confirmation 1: Double Smoothed Stochastic of Momentum
Confirmation 2: Jurik Turning Point Oscillator
Continuation: Fisher Transform
Exit: Rex Oscillator
Each GKD indicator is denoted with a module identifier of either: GKD-BT, GKD-B, GKD-C, GKD-V, or GKD-E. This allows traders to understand to which module each indicator belongs and where each indicator fits into the GKD protocol chain.
Giga Kaleidoscope Modularized Trading System Signals (based on the NNFX algorithm)
Standard Entry
1. GKD-C Confirmation 1 Signal
2. GKD-B Baseline agrees
3. Price is within a range of 0.2x Volatility and 1.0x Volatility of the Goldie Locks Mean
4. GKD-C Confirmation 2 agrees
5. GKD-V Volatility/Volume agrees
Baseline Entry
1. GKD-B Baseline signal
2. GKD-C Confirmation 1 agrees
3. Price is within a range of 0.2x Volatility and 1.0x Volatility of the Goldie Locks Mean
4. GKD-C Confirmation 2 agrees
5. GKD-V Volatility/Volume agrees
6. GKD-C Confirmation 1 signal was less than 7 candles prior
Continuation Entry
1. Standard Entry, Baseline Entry, or Pullback; entry triggered previously
2. GKD-B Baseline hasn't crossed since entry signal trigger
3. GKD-C Confirmation Continuation Indicator signals
4. GKD-C Confirmation 1 agrees
5. GKD-B Baseline agrees
6. GKD-C Confirmation 2 agrees
1-Candle Rule Standard Entry
1. GKD-C Confirmation 1 signal
2. GKD-B Baseline agrees
3. Price is within a range of 0.2x Volatility and 1.0x Volatility of the Goldie Locks Mean
Next Candle:
1. Price retraced (Long: close < close or Short: close > close )
2. GKD-B Baseline agrees
3. GKD-C Confirmation 1 agrees
4. GKD-C Confirmation 2 agrees
5. GKD-V Volatility/Volume agrees
1-Candle Rule Baseline Entry
1. GKD-B Baseline signal
2. GKD-C Confirmation 1 agrees
3. Price is within a range of 0.2x Volatility and 1.0x Volatility of the Goldie Locks Mean
4. GKD-C Confirmation 1 signal was less than 7 candles prior
Next Candle:
1. Price retraced (Long: close < close or Short: close > close )
2. GKD-B Baseline agrees
3. GKD-C Confirmation 1 agrees
4. GKD-C Confirmation 2 agrees
5. GKD-V Volatility/Volume Agrees
PullBack Entry
1. GKD-B Baseline signal
2. GKD-C Confirmation 1 agrees
3. Price is beyond 1.0x Volatility of Baseline
Next Candle:
1. Price is within a range of 0.2x Volatility and 1.0x Volatility of the Goldie Locks Mean
3. GKD-C Confirmation 1 agrees
4. GKD-C Confirmation 2 agrees
5. GKD-V Volatility/Volume Agrees
█ Average Directional Index (ADX)
What is Average Directional Index (ADX)
Trading in the direction of a strong trend reduces risk and increases profit potential. The average directional index (ADX) is used to determine when the price is trending strongly. In many cases, it is the ultimate trend indicator. After all, the trend may be your friend, but it sure helps to know who your friends are.
ADX is used to quantify trend strength. ADX calculations are based on a moving average of price range expansion over a given period of time. The default setting is 14 bars, although other time periods can be used. ADX can be used on any trading vehicle such as stocks, mutual funds, exchange-traded funds and futures.
ADX is plotted as a single line with values ranging from a low of zero to a high of 100. ADX is non-directional; it registers trend strength whether price is trending up or down. The indicator is usually plotted in the same window as the two directional movement indicator (DMI) lines, but for our purposes here, we are only concerned with the ADX itself.
Signals
Traditional: ADX is above the threshold cutoff; both longs/shorts triggered when ADX is above the threshold cutoff
Crossing: ADX crosses above/below the threshold cutoff; longs or shorts are only valid on the candle where the cross happens. Both cross-ups and cross-downs are valid for both shorts and longs
Signal Modifiers
X-Bar Rule: If signals occur within XX bars, then the signal is still valid
Bars Rising: This is for traditional signals only. This requires that an upward slop of ADX be present over XX bars
Other things to note
The GKD trading system requires that a GKD-V indicator be present in the indicator chain, but the GKD-V indicator doesn't need to be active. You can turn on/off the Volatility Ratio as you wish so you can backtest your trading strategy with the filter on or off.
Additional features will be added in future releases.
This indicator is only available to ALGX Trading VIP group members . You can see the Author's Instructions below to get more information on how to get access.
GKD-V Loxx Volty [Loxx]Giga Kaleidoscope Loxx Volty is a Volatility/Volume module included in Loxx's "Giga Kaleidoscope Modularized Trading System".
█ Giga Kaleidoscope Modularized Trading System
What is Loxx's "Giga Kaleidoscope Modularized Trading System"?
The Giga Kaleidoscope Modularized Trading System is a trading system built on the philosophy of the NNFX (No Nonsense Forex) algorithmic trading.
What is an NNFX algorithmic trading strategy?
The NNFX algorithm is built on the principles of trend, momentum, and volatility. There are six core components in the NNFX trading algorithm:
1. Volatility - price volatility; e.g., Average True Range, True Range Double, Close-to-Close, etc.
2. Baseline - a moving average to identify price trend
3. Confirmation 1 - a technical indicator used to identify trends.
4. Confirmation 2 - a technical indicator used to identify trends.
5. Continuation - a technical indicator used to identify trends.
6. Volatility/Volume - a technical indicator used to identify volatility/volume breakouts/breakdown.
7. Exit - a technical indicator used to determine when a trend is exhausted.
How does Loxx's GKD (Giga Kaleidoscope Modularized Trading System) implement the NNFX algorithm outlined above?
Loxx's GKD v1.0 system has five types of modules (indicators/strategies). These modules are:
1. GKD-BT - Backtesting module (Volatility, Number 1 in the NNFX algorithm)
2. GKD-B - Baseline module (Baseline and Volatility/Volume, Numbers 1 and 2 in the NNFX algorithm)
3. GKD-C - Confirmation 1/2 and Continuation module (Confirmation 1/2 and Continuation, Numbers 3, 4, and 5 in the NNFX algorithm)
4. GKD-V - Volatility/Volume module (Confirmation 1/2, Number 6 in the NNFX algorithm)
5. GKD-E - Exit module (Exit, Number 7 in the NNFX algorithm)
(additional module types will added in future releases)
Each module interacts with every module by passing data between modules. Data is passed between each module as described below:
GKD-B => GKD-V => GKD-C(1) => GKD-C(2) => GKD-C(Continuation) => GKD-E => GKD-BT
That is, the Baseline indicator passes its data to Volatility/Volume. The Volatility/Volume indicator passes its values to the Confirmation 1 indicator. The Confirmation 1 indicator passes its values to the Confirmation 2 indicator. The Confirmation 2 indicator passes its values to the Continuation indicator. The Continuation indicator passes its values to the Exit indicator, and finally, the Exit indicator passes its values to the Backtest strategy.
This chaining of indicators requires that each module conform to Loxx's GKD protocol, therefore allowing for the testing of every possible combination of technical indicators that make up the six components of the NNFX algorithm.
What does the application of the GKD trading system look like?
Example trading system:
Backtest: Strategy with 1-3 take profits, trailing stop loss, multiple types of PnL volatility, and 2 backtesting styles
Baseline: Leader Exponential Moving Average
Volatility/Volume: Loxx Volty as shown on the chart above
Confirmation 1: Double Smoothed Stochastic of Momentum
Confirmation 2: Jurik Turning Point Oscillator
Continuation: Fisher Transform
Exit: Rex Oscillator
Each GKD indicator is denoted with a module identifier of either: GKD-BT, GKD-B, GKD-C, GKD-V, or GKD-E. This allows traders to understand to which module each indicator belongs and where each indicator fits into the GKD protocol chain.
Giga Kaleidoscope Modularized Trading System Signals (based on the NNFX algorithm)
Standard Entry
1. GKD-C Confirmation 1 Signal
2. GKD-B Baseline agrees
3. Price is within a range of 0.2x Volatility and 1.0x Volatility of the Goldie Locks Mean
4. GKD-C Confirmation 2 agrees
5. GKD-V Volatility/Volume agrees
Baseline Entry
1. GKD-B Baseline signal
2. GKD-C Confirmation 1 agrees
3. Price is within a range of 0.2x Volatility and 1.0x Volatility of the Goldie Locks Mean
4. GKD-C Confirmation 2 agrees
5. GKD-V Volatility/Volume agrees
6. GKD-C Confirmation 1 signal was less than 7 candles prior
Continuation Entry
1. Standard Entry, Baseline Entry, or Pullback; entry triggered previously
2. GKD-B Baseline hasn't crossed since entry signal trigger
3. GKD-C Confirmation Continuation Indicator signals
4. GKD-C Confirmation 1 agrees
5. GKD-B Baseline agrees
6. GKD-C Confirmation 2 agrees
1-Candle Rule Standard Entry
1. GKD-C Confirmation 1 signal
2. GKD-B Baseline agrees
3. Price is within a range of 0.2x Volatility and 1.0x Volatility of the Goldie Locks Mean
Next Candle:
1. Price retraced (Long: close < close or Short: close > close )
2. GKD-B Baseline agrees
3. GKD-C Confirmation 1 agrees
4. GKD-C Confirmation 2 agrees
5. GKD-V Volatility/Volume agrees
1-Candle Rule Baseline Entry
1. GKD-B Baseline signal
2. GKD-C Confirmation 1 agrees
3. Price is within a range of 0.2x Volatility and 1.0x Volatility of the Goldie Locks Mean
4. GKD-C Confirmation 1 signal was less than 7 candles prior
Next Candle:
1. Price retraced (Long: close < close or Short: close > close )
2. GKD-B Baseline agrees
3. GKD-C Confirmation 1 agrees
4. GKD-C Confirmation 2 agrees
5. GKD-V Volatility/Volume Agrees
PullBack Entry
1. GKD-B Baseline signal
2. GKD-C Confirmation 1 agrees
3. Price is beyond 1.0x Volatility of Baseline
Next Candle:
1. Price is within a range of 0.2x Volatility and 1.0x Volatility of the Goldie Locks Mean
3. GKD-C Confirmation 1 agrees
4. GKD-C Confirmation 2 agrees
5. GKD-V Volatility/Volume Agrees
█ Loxx Volty
What is Loxx Volty
One of the lesser known qualities of Loxx smoothing is that the Loxx smoothing process is adaptive. "Loxx Volty" (a sort of market volatility) is what makes Loxx smoothing adaptive. The Loxx Volty calculation can be used as both a standalone indicator and to smooth other indicators that you wish to make adaptive.
Other things to note
The GKD trading system requires that a GKD-V indicator be present in the indicator chain, but the GKD-V indicator doesn't need to be active. You can turn on/off the Volatility Ratio as you wish so you can backtest your trading strategy with the filter on or off.
Additional features will be added in future releases.
This indicator is only available to ALGX Trading VIP group members . You can see the Author's Instructions below to get more information on how to get access.

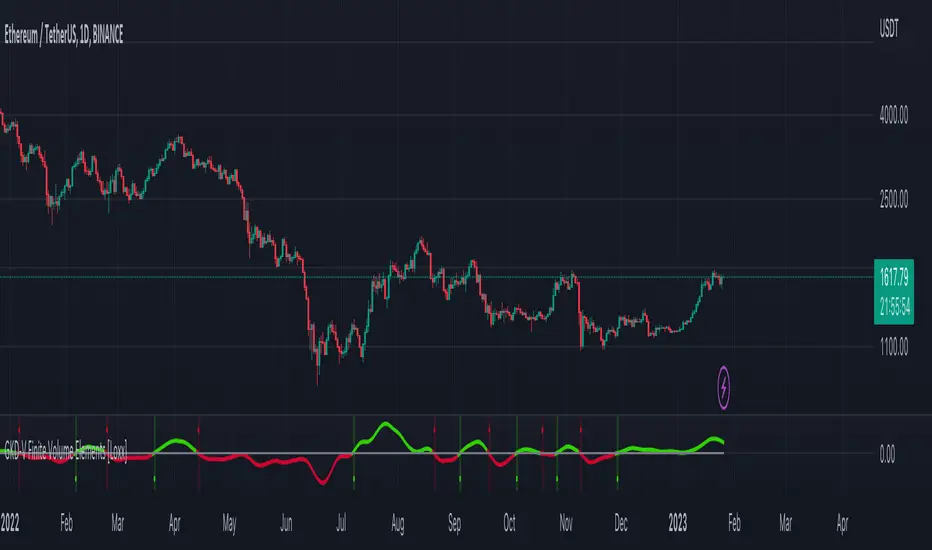
GKD-V Finite Volume Elements [Loxx]Giga Kaleidoscope Finite Volume Elements is a Volatility/Volume module included in Loxx's "Giga Kaleidoscope Modularized Trading System".
█ Giga Kaleidoscope Modularized Trading System
What is Loxx's "Giga Kaleidoscope Modularized Trading System"?
The Giga Kaleidoscope Modularized Trading System is a trading system built on the philosophy of the NNFX (No Nonsense Forex) algorithmic trading.
What is an NNFX algorithmic trading strategy?
The NNFX algorithm is built on the principles of trend, momentum, and volatility. There are six core components in the NNFX trading algorithm:
1. Volatility - price volatility; e.g., Average True Range, True Range Double, Close-to-Close, etc.
2. Baseline - a moving average to identify price trend
3. Confirmation 1 - a technical indicator used to identify trends.
4. Confirmation 2 - a technical indicator used to identify trends.
5. Continuation - a technical indicator used to identify trends.
6. Volatility/Volume - a technical indicator used to identify volatility/volume breakouts/breakdown.
7. Exit - a technical indicator used to determine when a trend is exhausted.
How does Loxx's GKD (Giga Kaleidoscope Modularized Trading System) implement the NNFX algorithm outlined above?
Loxx's GKD v1.0 system has five types of modules (indicators/strategies). These modules are:
1. GKD-BT - Backtesting module (Volatility, Number 1 in the NNFX algorithm)
2. GKD-B - Baseline module (Baseline and Volatility/Volume, Numbers 1 and 2 in the NNFX algorithm)
3. GKD-C - Confirmation 1/2 and Continuation module (Confirmation 1/2 and Continuation, Numbers 3, 4, and 5 in the NNFX algorithm)
4. GKD-V - Volatility/Volume module (Confirmation 1/2, Number 5 in the NNFX algorithm)
5. GKD-E - Exit module (Exit, Number 7 in the NNFX algorithm)
(additional module types will added in future releases)
Each module interacts with every module by passing data between modules. Data is passed between each module as described below:
GKD-B => GKD-V => GKD-C(1) => GKD-C(2) => GKD-C(Continuation) => GKD-E => GKD-BT
That is, the Baseline indicator passes its data to Volatility/Volume. The Volatility/Volume indicator passes its values to the Confirmation 1 indicator. The Confirmation 1 indicator passes its values to the Confirmation 2 indicator. The Confirmation 2 indicator passes its values to the Continuation indicator. The Continuation indicator passes its values to the Exit indicator, and finally, the Exit indicator passes its values to the Backtest strategy.
This chaining of indicators requires that each module conform to Loxx's GKD protocol, therefore allowing for the testing of every possible combination of technical indicators that make up the six components of the NNFX algorithm.
What does the application of the GKD trading system look like?
Example trading system:
Backtest: Strategy with 1-3 take profits, trailing stop loss, multiple types of PnL volatility, and 2 backtesting styles
Baseline: Leader Exponential Moving Average
Volatility/Volume: Finite Volume Elements as shown on the chart above
Confirmation 1: Double Smoothed Stochastic of Momentum
Confirmation 2: Jurik Turning Point Oscillator
Continuation: Fisher Transform
Exit: Rex Oscillator
Each GKD indicator is denoted with a module identifier of either: GKD-BT, GKD-B, GKD-C, GKD-V, or GKD-E. This allows traders to understand to which module each indicator belongs and where each indicator fits into the GKD protocol chain.
Giga Kaleidoscope Modularized Trading System Signals (based on the NNFX algorithm)
Standard Entry
1. GKD-C Confirmation 1 Signal
2. GKD-B Baseline agrees
3. Price is within a range of 0.2x Volatility and 1.0x Volatility of the Goldie Locks Mean
4. GKD-C Confirmation 2 agrees
5. GKD-V Volatility/Volume agrees
Baseline Entry
1. GKD-B Baseline signal
2. GKD-C Confirmation 1 agrees
3. Price is within a range of 0.2x Volatility and 1.0x Volatility of the Goldie Locks Mean
4. GKD-C Confirmation 2 agrees
5. GKD-V Volatility/Volume agrees
6. GKD-C Confirmation 1 signal was less than 7 candles prior
Continuation Entry
1. Standard Entry, Baseline Entry, or Pullback; entry triggered previously
2. GKD-B Baseline hasn't crossed since entry signal trigger
3. GKD-C Confirmation Continuation Indicator signals
4. GKD-C Confirmation 1 agrees
5. GKD-B Baseline agrees
6. GKD-C Confirmation 2 agrees
1-Candle Rule Standard Entry
1. GKD-C Confirmation 1 signal
2. GKD-B Baseline agrees
3. Price is within a range of 0.2x Volatility and 1.0x Volatility of the Goldie Locks Mean
Next Candle:
1. Price retraced (Long: close < close or Short: close > close )
2. GKD-B Baseline agrees
3. GKD-C Confirmation 1 agrees
4. GKD-C Confirmation 2 agrees
5. GKD-V Volatility/Volume agrees
1-Candle Rule Baseline Entry
1. GKD-B Baseline signal
2. GKD-C Confirmation 1 agrees
3. Price is within a range of 0.2x Volatility and 1.0x Volatility of the Goldie Locks Mean
4. GKD-C Confirmation 1 signal was less than 7 candles prior
Next Candle:
1. Price retraced (Long: close < close or Short: close > close )
2. GKD-B Baseline agrees
3. GKD-C Confirmation 1 agrees
4. GKD-C Confirmation 2 agrees
5. GKD-V Volatility/Volume Agrees
PullBack Entry
1. GKD-B Baseline signal
2. GKD-C Confirmation 1 agrees
3. Price is beyond 1.0x Volatility of Baseline
Next Candle:
1. Price is within a range of 0.2x Volatility and 1.0x Volatility of the Goldie Locks Mean
3. GKD-C Confirmation 1 agrees
4. GKD-C Confirmation 2 agrees
5. GKD-V Volatility/Volume Agrees
█ Finite Volume Elements
What is Finite Volume Elements
The Finite Volume Element Indicator ( FVE ) was developed by Markos Katsanos and introduced in the April 2003 issue of Technical Analysis of Stocks & Commodities magazine. It was modified for volatility in the September 2003 issue of TASC.
FVE is a money flow indicator but with two important differences from existing money flow indicators:
It resolves contradictions between intraday money flow indicators (such as Chaikin’s money flow ) and intraday money flow indicators (like On Balance Volume ) by taking into account both intra- and intraday price action.
Unlike other money flow indicators which add or subtract all volume even if the security closed just 1 cent higher than the previous close, FVE uses a volatility threshold to take into account minimal price changes
Other things to note
The GKD trading system requires that a GKD-V indicator be present in the indicator chain, but the GKD-V indicator doesn't need to be active. You can turn on/off the Volatility Ratio as you wish so you can backtest your trading strategy with the filter on or off.
Additional features will be added in future releases.
This indicator is only available to ALGX Trading VIP group members . You can see the Author's Instructions below to get more information on how to get access.
GKD-B Baseline [Loxx]Giga Kaleidoscope Baseline is a Baseline module included in Loxx's "Giga Kaleidoscope Modularized Trading System".
What is Loxx's "Giga Kaleidoscope Modularized Trading System"?
The Giga Kaleidoscope Modularized Trading System is a trading system built on the philosophy of the NNFX (No Nonsense Forex) algorithmic trading.
What is an NNFX algorithmic trading strategy?
The NNFX algorithm is built on the principles of trend, momentum, and volatility. There are six core components in the NNFX trading algorithm:
1. Volatility - price volatility; e.g., Average True Range, True Range Double, Close-to-Close, etc.
2. Baseline - a moving average to identify price trend (such as "Baseline" shown on the chart above)
3. Confirmation 1 - a technical indicator used to identify trend. This should agree with the "Baseline"
4. Confirmation 2 - a technical indicator used to identify trend. This filters/verifies the trend identified by "Baseline" and "Confirmation 1"
5. Volatility/Volume - a technical indicator used to identify volatility/volume breakouts/breakdown.
6. Exit - a technical indicator used to determine when trend is exhausted.
How does Loxx's GKD (Giga Kaleidoscope Modularized Trading System) implement the NNFX algorithm outlined above?
Loxx's GKD v1.0 system has five types of modules (indicators/strategies). These modules are:
1. GKD-BT - Backtesting module (Volatility, Number 1 in the NNFX algorithm)
2. GKD-B - Baseline module (Baseline and Volatility/Volume, Numbers 1 and 2 in the NNFX algorithm)
3. GKD-C - Confirmation 1/2 module (Confirmation 1/2, Numbers 3 and 4 in the NNFX algorithm)
4. GKD-V - Volatility/Volume module (Confirmation 1/2, Number 5 in the NNFX algorithm)
5. GKD-E - Exit module (Exit, Number 6 in the NNFX algorithm)
(additional module types will added in future releases)
Each module interacts with every module by passing data between modules. Data is passed between each module as described below:
GKD-B => GKD-V => GKD-C(1) => GKD-C(2) => GKD-E => GKD-BT
That is, the Baseline indicator passes its data to Volatility/Volume. The Volatility/Volume indicator passes its values to the Confirmation 1 indicator. The Confirmation 1 indicator passes its values to the Confirmation 2 indicator. The Confirmation 2 indicator passes its values to the Exit indicator, and finally, the Exit indicator passes its values to the Backtest strategy.
This chaining of indicators requires that each module conform to Loxx's GKD protocol, therefore allowing for the testing of every possible combination of technical indicators that make up the six components of the NNFX algorithm.
What does the application of the GKD trading system look like?
Example trading system:
Backtest: Strategy with 1-3 take profits, trailing stop loss, multiple types of PnL volatility, and 2 backtesting styles
Baseline: Hull Moving Average as shown on the chart above
Volatility/Volume: Jurik Volty
Confirmation 1: Vortex
Confirmation 2: Fisher Transform
Exit: Rex Oscillator
Each GKD indicator is denoted with a module identifier of either: GKD-BT, GKD-B, GKD-C, GKD-V, or GKD-E. This allows traders understand to which module each indicator belongs and where each indicator fits into the GKD protocol chain.
Now that you have a general understanding of the NNFX algorithm and the GKD trading system. let's go over what's inside the GKD-B Baseline itself.
GKD Baseline Special Features and Notable Inputs
GKD Baseline v1.0 includes 63 different moving averages:
Adaptive Moving Average - AMA
ADXvma - Average Directional Volatility Moving Average
Ahrens Moving Average
Alexander Moving Average - ALXMA
Deviation Scaled Moving Average - DSMA
Donchian
Double Exponential Moving Average - DEMA
Double Smoothed Exponential Moving Average - DSEMA
Double Smoothed FEMA - DSFEMA
Double Smoothed Range Weighted EMA - DSRWEMA
Double Smoothed Wilders EMA - DSWEMA
Double Weighted Moving Average - DWMA
Ehlers Optimal Tracking Filter - EOTF
Exponential Moving Average - EMA
Fast Exponential Moving Average - FEMA
Fractal Adaptive Moving Average - FRAMA
Generalized DEMA - GDEMA
Generalized Double DEMA - GDDEMA
Hull Moving Average (Type 1) - HMA1
Hull Moving Average (Type 2) - HMA2
Hull Moving Average (Type 3) - HMA3
Hull Moving Average (Type 4) - HMA4
IE /2 - Early T3 by Tim Tilson
Integral of Linear Regression Slope - ILRS
Instantaneous Trendline
Kalman Filter
Kaufman Adaptive Moving Average - KAMA
Laguerre Filter
Leader Exponential Moving Average
Linear Regression Value - LSMA ( Least Squares Moving Average )
Linear Weighted Moving Average - LWMA
McGinley Dynamic
McNicholl EMA
Non-Lag Moving Average
Ocean NMA Moving Average - ONMAMA
Parabolic Weighted Moving Average
Probability Density Function Moving Average - PDFMA
Quadratic Regression Moving Average - QRMA
Regularized EMA - REMA
Range Weighted EMA - RWEMA
Recursive Moving Trendline
Simple Decycler - SDEC
Simple Jurik Moving Average - SJMA
Simple Moving Average - SMA
Sine Weighted Moving Average
Smoothed LWMA - SLWMA
Smoothed Moving Average - SMMA
Smoother
Super Smoother
T3
Three-pole Ehlers Butterworth
Three-pole Ehlers Smoother
Triangular Moving Average - TMA
Triple Exponential Moving Average - TEMA
Two-pole Ehlers Butterworth
Two-pole Ehlers smoother
Variable Index Dynamic Average - VIDYA
Variable Moving Average - VMA
Volume Weighted EMA - VEMA
Volume Weighted Moving Average - VWMA
Zero-Lag DEMA - Zero Lag Exponential Moving Average
Zero-Lag Moving Average
Zero Lag TEMA - Zero Lag Triple Exponential Moving Average
Adaptive Moving Average - AMA
Description. The Adaptive Moving Average (AMA) is a moving average that changes its sensitivity to price moves depending on the calculated volatility. It becomes more sensitive during periods when the price is moving smoothly in a certain direction and becomes less sensitive when the price is volatile.
ADXvma - Average Directional Volatility Moving Average
Linnsoft's ADXvma formula is a volatility-based moving average, with the volatility being determined by the value of the ADX indicator.
The ADXvma has the SMA in Chande's CMO replaced with an EMA , it then uses a few more layers of EMA smoothing before the "Volatility Index" is calculated.
A side effect is, those additional layers slow down the ADXvma when you compare it to Chande's Variable Index Dynamic Average VIDYA .
The ADXVMA provides support during uptrends and resistance during downtrends and will stay flat for longer, but will create some of the most accurate market signals when it decides to move.
Ahrens Moving Average
Richard D. Ahrens's Moving Average promises "Smoother Data" that isn't influenced by the occasional price spike. It works by using the Open and the Close in his formula so that the only time the Ahrens Moving Average will change is when the candlestick is either making new highs or new lows.
Alexander Moving Average - ALXMA
This Moving Average uses an elaborate smoothing formula and utilizes a 7 period Moving Average. It corresponds to fitting a second-order polynomial to seven consecutive observations. This moving average is rarely used in trading but is interesting as this Moving Average has been applied to diffusion indexes that tend to be very volatile.
Deviation Scaled Moving Average - DSMA
The Deviation-Scaled Moving Average is a data smoothing technique that acts like an exponential moving average with a dynamic smoothing coefficient. The smoothing coefficient is automatically updated based on the magnitude of price changes. In the Deviation-Scaled Moving Average, the standard deviation from the mean is chosen to be the measure of this magnitude. The resulting indicator provides substantial smoothing of the data even when price changes are small while quickly adapting to these changes.
Donchian
Donchian Channels are three lines generated by moving average calculations that comprise an indicator formed by upper and lower bands around a midrange or median band. The upper band marks the highest price of a security over N periods while the lower band marks the lowest price of a security over N periods.
Double Exponential Moving Average - DEMA
The Double Exponential Moving Average ( DEMA ) combines a smoothed EMA and a single EMA to provide a low-lag indicator. It's primary purpose is to reduce the amount of "lagging entry" opportunities, and like all Moving Averages, the DEMA confirms uptrends whenever price crosses on top of it and closes above it, and confirms downtrends when the price crosses under it and closes below it - but with significantly less lag.
Double Smoothed Exponential Moving Average - DSEMA
The Double Smoothed Exponential Moving Average is a lot less laggy compared to a traditional EMA . It's also considered a leading indicator compared to the EMA , and is best utilized whenever smoothness and speed of reaction to market changes are required.
Double Smoothed FEMA - DSFEMA
Same as the Double Exponential Moving Average (DEMA), but uses a faster version of EMA for its calculation.
Double Smoothed Range Weighted EMA - DSRWEMA
Range weighted exponential moving average (EMA) is, unlike the "regular" range weighted average calculated in a different way. Even though the basis - the range weighting - is the same, the way how it is calculated is completely different. By definition this type of EMA is calculated as a ratio of EMA of price*weight / EMA of weight. And the results are very different and the two should be considered as completely different types of averages. The higher than EMA to price changes responsiveness when the ranges increase remains in this EMA too and in those cases this EMA is clearly leading the "regular" EMA. This version includes double smoothing.
Double Smoothed Wilders EMA - DSWEMA
Welles Wilder was frequently using one "special" case of EMA (Exponential Moving Average) that is due to that fact (that he used it) sometimes called Wilder's EMA. This version is adding double smoothing to Wilder's EMA in order to make it "faster" (it is more responsive to market prices than the original) and is still keeping very smooth values.
Double Weighted Moving Average - DWMA
Double weighted moving average is an LWMA (Linear Weighted Moving Average). Instead of doing one cycle for calculating the LWMA, the indicator is made to cycle the loop 2 times. That produces a smoother values than the original LWMA
Ehlers Optimal Tracking Filter - EOTF
The Elher's Optimum Tracking Filter quickly adjusts rapid shifts in the price and yet is relatively smooth when the price has a sideways action. The operation of this filter is similar to Kaufman’s Adaptive Moving
Average
Exponential Moving Average - EMA
The EMA places more significance on recent data points and moves closer to price than the SMA ( Simple Moving Average ). It reacts faster to volatility due to its emphasis on recent data and is known for its ability to give greater weight to recent and more relevant data. The EMA is therefore seen as an enhancement over the SMA .
Fast Exponential Moving Average - FEMA
An Exponential Moving Average with a short look-back period.
Fractal Adaptive Moving Average - FRAMA
The Fractal Adaptive Moving Average by John Ehlers is an intelligent adaptive Moving Average which takes the importance of price changes into account and follows price closely enough to display significant moves whilst remaining flat if price ranges. The FRAMA does this by dynamically adjusting the look-back period based on the market's fractal geometry.
Generalized DEMA - GDEMA
The double exponential moving average (DEMA), was developed by Patrick Mulloy in an attempt to reduce the amount of lag time found in traditional moving averages. It was first introduced in the February 1994 issue of the magazine Technical Analysis of Stocks & Commodities in Mulloy's article "Smoothing Data with Faster Moving Averages.". Instead of using fixed multiplication factor in the final DEMA formula, the generalized version allows you to change it. By varying the "volume factor" form 0 to 1 you apply different multiplications and thus producing DEMA with different "speed" - the higher the volume factor is the "faster" the DEMA will be (but also the slope of it will be less smooth). The volume factor is limited in the calculation to 1 since any volume factor that is larger than 1 is increasing the overshooting to the extent that some volume factors usage makes the indicator unusable.
Generalized Double DEMA - GDDEMA
The double exponential moving average (DEMA), was developed by Patrick Mulloy in an attempt to reduce the amount of lag time found in traditional moving averages. It was first introduced in the February 1994 issue of the magazine Technical Analysis of Stocks & Commodities in Mulloy's article "Smoothing Data with Faster Moving Averages''. This is an extension of the Generalized DEMA using Tim Tillsons (the inventor of T3) idea, and is using GDEMA of GDEMA for calculation (which is the "middle step" of T3 calculation). Since there are no versions showing that middle step, this version covers that too. The result is smoother than Generalized DEMA, but is less smooth than T3 - one has to do some experimenting in order to find the optimal way to use it, but in any case, since it is "faster" than the T3 (Tim Tillson T3) and still smooth, it looks like a good compromise between speed and smoothness.
Hull Moving Average (Type 1) - HMA1
Alan Hull's HMA makes use of weighted moving averages to prioritize recent values and greatly reduce lag whilst maintaining the smoothness of a traditional Moving Average. For this reason, it's seen as a well-suited Moving Average for identifying entry points. This version uses SMA for smoothing.
Hull Moving Average (Type 2) - HMA2
Alan Hull's HMA makes use of weighted moving averages to prioritize recent values and greatly reduce lag whilst maintaining the smoothness of a traditional Moving Average. For this reason, it's seen as a well-suited Moving Average for identifying entry points. This version uses EMA for smoothing.
Hull Moving Average (Type 3) - HMA3
Alan Hull's HMA makes use of weighted moving averages to prioritize recent values and greatly reduce lag whilst maintaining the smoothness of a traditional Moving Average. For this reason, it's seen as a well-suited Moving Average for identifying entry points. This version uses LWMA for smoothing.
Hull Moving Average (Type 4) - HMA4
Alan Hull's HMA makes use of weighted moving averages to prioritize recent values and greatly reduce lag whilst maintaining the smoothness of a traditional Moving Average. For this reason, it's seen as a well-suited Moving Average for identifying entry points. This version uses SMMA for smoothing.
IE /2 - Early T3 by Tim Tilson and T3 new
T3 is basically an EMA on steroids, You can read about T3 here:
Integral of Linear Regression Slope - ILRS
A Moving Average where the slope of a linear regression line is simply integrated as it is fitted in a moving window of length N (natural numbers in maths) across the data. The derivative of ILRS is the linear regression slope. ILRS is not the same as a SMA ( Simple Moving Average ) of length N, which is actually the midpoint of the linear regression line as it moves across the data.
Instantaneous Trendline
The Instantaneous Trendline is created by removing the dominant cycle component from the price information which makes this Moving Average suitable for medium to long-term trading.
Kalman Filter
Kalman filter is an algorithm that uses a series of measurements observed over time, containing statistical noise and other inaccuracies. This means that the filter was originally designed to work with noisy data. Also, it is able to work with incomplete data. Another advantage is that it is designed for and applied in dynamic systems; our price chart belongs to such systems. This version is true to the original design of the trade-ready Kalman Filter where velocity is the triggering mechanism.
Kalman Filter is a more accurate smoothing/prediction algorithm than the moving average because it is adaptive: it accounts for estimation errors and tries to adjust its predictions from the information it learned in the previous stage. Theoretically, Kalman Filter consists of measurement and transition components.
Kaufman Adaptive Moving Average - KAMA
Developed by Perry Kaufman, Kaufman's Adaptive Moving Average (KAMA) is a moving average designed to account for market noise or volatility. KAMA will closely follow prices when the price swings are relatively small and the noise is low.
Laguerre Filter
The Laguerre Filter is a smoothing filter which is based on Laguerre polynomials. The filter requires the current price, three prior prices, a user defined factor called Alpha to fill its calculation.
Adjusting the Alpha coefficient is used to increase or decrease its lag and its smoothness.
Leader Exponential Moving Average
The Leader EMA was created by Giorgos E. Siligardos who created a Moving Average which was able to eliminate lag altogether whilst maintaining some smoothness. It was first described during his research paper "MACD Leader" where he applied this to the MACD to improve its signals and remove its lagging issue. This filter uses his leading MACD's "modified EMA" and can be used as a zero lag filter.
Linear Regression Value - LSMA ( Least Squares Moving Average )
LSMA as a Moving Average is based on plotting the end point of the linear regression line. It compares the current value to the prior value and a determination is made of a possible trend, eg. the linear regression line is pointing up or down.
Linear Weighted Moving Average - LWMA
LWMA reacts to price quicker than the SMA and EMA . Although it's similar to the Simple Moving Average , the difference is that a weight coefficient is multiplied to the price which means the most recent price has the highest weighting, and each prior price has progressively less weight. The weights drop in a linear fashion.
McGinley Dynamic
John McGinley created this Moving Average to track prices better than traditional Moving Averages. It does this by incorporating an automatic adjustment factor into its formula, which speeds (or slows) the indicator in trending, or ranging, markets.
McNicholl EMA
Dennis McNicholl developed this Moving Average to use as his center line for his "Better Bollinger Bands" indicator and was successful because it responded better to volatility changes over the standard SMA and managed to avoid common whipsaws.
Non-lag moving average
The Non Lag Moving average follows price closely and gives very quick signals as well as early signals of price change. As a standalone Moving Average, it should not be used on its own, but as an additional confluence tool for early signals.
Ocean NMA Moving Average - ONMAMA
Created by Jim Sloman, the NMA is a moving average that automatically adjusts to volatility without being programmed to do so. For more info, read his guide "Ocean Theory, an Introduction"
Parabolic Weighted Moving Average
The Parabolic Weighted Moving Average is a variation of the Linear Weighted Moving Average . The Linear Weighted Moving Average calculates the average by assigning different weights to each element in its calculation. The Parabolic Weighted Moving Average is a variation that allows weights to be changed to form a parabolic curve. It is done simply by using the Power parameter of this indicator.
Probability Density Function Moving Average - PDFMA
Probability density function based MA is a sort of weighted moving average that uses probability density function to calculate the weights. By its nature it is similar to a lot of digital filters.
Quadratic Regression Moving Average - QRMA
A quadratic regression is the process of finding the equation of the parabola that best fits a set of data. This moving average is an obscure concept that was posted to Forex forums in around 2008.
Regularized EMA - REMA
The regularized exponential moving average (REMA) by Chris Satchwell is a variation on the EMA (see Exponential Moving Average) designed to be smoother but not introduce too much extra lag.
Range Weighted EMA - RWEMA
This indicator is a variation of the range weighted EMA. The variation comes from a possible need to make that indicator a bit less "noisy" when it comes to slope changes. The method used for calculating this variation is the method described by Lee Leibfarth in his article "Trading With An Adaptive Price Zone".
Recursive Moving Trendline
Dennis Meyers's Recursive Moving Trendline uses a recursive (repeated application of a rule) polynomial fit, a technique that uses a small number of past values estimations of price and today's price to predict tomorrow's price.
Simple Decycler - SDEC
The Ehlers Simple Decycler study is a virtually zero-lag technical indicator proposed by John F. Ehlers. The original idea behind this study (and several others created by John F. Ehlers) is that market data can be considered a continuum of cycle periods with different cycle amplitudes. Thus, trending periods can be considered segments of longer cycles, or, in other words, low-frequency segments. Applying the right filter might help identify these segments.
Simple Loxx Moving Average - SLMA
A three stage moving average combining an adaptive EMA, a Kalman Filter, and a Kauffman adaptive filter.
Simple Moving Average - SMA
The SMA calculates the average of a range of prices by adding recent prices and then dividing that figure by the number of time periods in the calculation average. It is the most basic Moving Average which is seen as a reliable tool for starting off with Moving Average studies. As reliable as it may be, the basic moving average will work better when it's enhanced into an EMA .
Sine Weighted Moving Average
The Sine Weighted Moving Average assigns the most weight at the middle of the data set. It does this by weighting from the first half of a Sine Wave Cycle and the most weighting is given to the data in the middle of that data set. The Sine WMA closely resembles the TMA (Triangular Moving Average).
Smoothed LWMA - SLWMA
A smoothed version of the LWMA
Smoothed Moving Average - SMMA
The Smoothed Moving Average is similar to the Simple Moving Average ( SMA ), but aims to reduce noise rather than reduce lag. SMMA takes all prices into account and uses a long lookback period. Due to this, it's seen as an accurate yet laggy Moving Average.
Smoother
The Smoother filter is a faster-reacting smoothing technique which generates considerably less lag than the SMMA ( Smoothed Moving Average ). It gives earlier signals but can also create false signals due to its earlier reactions. This filter is sometimes wrongly mistaken for the superior Jurik Smoothing algorithm.
Super Smoother
The Super Smoother filter uses John Ehlers’s “Super Smoother” which consists of a Two pole Butterworth filter combined with a 2-bar SMA ( Simple Moving Average ) that suppresses the 22050 Hz Nyquist frequency: A characteristic of a sampler, which converts a continuous function or signal into a discrete sequence.
Three-pole Ehlers Butterworth
The 3 pole Ehlers Butterworth (as well as the Two pole Butterworth) are both superior alternatives to the EMA and SMA . They aim at producing less lag whilst maintaining accuracy. The 2 pole filter will give you a better approximation for price, whereas the 3 pole filter has superior smoothing.
Three-pole Ehlers smoother
The 3 pole Ehlers smoother works almost as close to price as the above mentioned 3 Pole Ehlers Butterworth. It acts as a strong baseline for signals but removes some noise. Side by side, it hardly differs from the Three Pole Ehlers Butterworth but when examined closely, it has better overshoot reduction compared to the 3 pole Ehlers Butterworth.
Triangular Moving Average - TMA
The TMA is similar to the EMA but uses a different weighting scheme. Exponential and weighted Moving Averages will assign weight to the most recent price data. Simple moving averages will assign the weight equally across all the price data. With a TMA (Triangular Moving Average), it is double smoother (averaged twice) so the majority of the weight is assigned to the middle portion of the data.
Triple Exponential Moving Average - TEMA
The TEMA uses multiple EMA calculations as well as subtracting lag to create a tool which can be used for scalping pullbacks. As it follows price closely, its signals are considered very noisy and should only be used in extremely fast-paced trading conditions.
Two-pole Ehlers Butterworth
The 2 pole Ehlers Butterworth (as well as the three pole Butterworth mentioned above) is another filter that cuts out the noise and follows the price closely. The 2 pole is seen as a faster, leading filter over the 3 pole and follows price a bit more closely. Analysts will utilize both a 2 pole and a 3 pole Butterworth on the same chart using the same period, but having both on chart allows its crosses to be traded.
Two-pole Ehlers smoother
A smoother version of the Two pole Ehlers Butterworth. This filter is the faster version out of the 3 pole Ehlers Butterworth. It does a decent job at cutting out market noise whilst emphasizing a closer following to price over the 3 pole Ehlers .
Variable Index Dynamic Average - VIDYA
Variable Index Dynamic Average Technical Indicator ( VIDYA ) was developed by Tushar Chande. It is an original method of calculating the Exponential Moving Average ( EMA ) with the dynamically changing period of averaging.
Variable Moving Average - VMA
The Variable Moving Average (VMA) is a study that uses an Exponential Moving Average being able to automatically adjust its smoothing factor according to the market volatility.
Volume Weighted EMA - VEMA
An EMA that uses a volume and price weighted calculation instead of the standard price input.
Volume Weighted Moving Average - VWMA
A Volume Weighted Moving Average is a moving average where more weight is given to bars with heavy volume than with light volume. Thus the value of the moving average will be closer to where most trading actually happened than it otherwise would be without being volume weighted.
Zero-Lag DEMA - Zero Lag Double Exponential Moving Average
John Ehlers's Zero Lag DEMA's aim is to eliminate the inherent lag associated with all trend following indicators which average a price over time. Because this is a Double Exponential Moving Average with Zero Lag, it has a tendency to overshoot and create a lot of false signals for swing trading. It can however be used for quick scalping or as a secondary indicator for confluence.
Zero-Lag Moving Average
The Zero Lag Moving Average is described by its creator, John Ehlers , as a Moving Average with absolutely no delay. And it's for this reason that this filter will cause a lot of abrupt signals which will not be ideal for medium to long-term traders. This filter is designed to follow price as close as possible whilst de-lagging data instead of basing it on regular data. The way this is done is by attempting to remove the cumulative effect of the Moving Average.
Zero-Lag TEMA - Zero Lag Triple Exponential Moving Average
Just like the Zero Lag DEMA , this filter will give you the fastest signals out of all the Zero Lag Moving Averages. This is useful for scalping but dangerous for medium to long-term traders, especially during market Volatility and news events. Having no lag, this filter also has no smoothing in its signals and can cause some very bizarre behavior when applied to certain indicators.
Exotic Triggers
This version of Baseline allows the user to select from exotic or source triggers. An exotic trigger determines trend by either slope or some other mechanism that is special to each moving average. A source trigger is one of 32 different source types from Loxx's Exotic Source Types. You can read about these source types here:
Volatility Goldie Locks Zone
This volatility filter is the standard first pass filter that is used for all NNFX systems despite the additional volatility/volume filter used in step 5. For this filter, price must fall into a range of maximum and minimum values calculated using multiples of volatility. Unlike the standard NNFX systems, this version of volatility filtering is separated from the core Baseline and uses it's own moving average with Loxx's Exotic Source Types. The green and red dots at the top of the chart denote whether a candle qualifies for a either or long or short respectively. The green and red triangles at the bottom of the chart denote whether the trigger has crossed up or down and qualifies inside the Goldie Locks zone. White coloring of the Goldie Locks Zone mean line is where volatility is too low to trade.
Volatility Types Included
v1.0 Included Volatility
Close-to-Close
Close-to-Close volatility is a classic and most commonly used volatility measure, sometimes referred to as historical volatility .
Volatility is an indicator of the speed of a stock price change. A stock with high volatility is one where the price changes rapidly and with a bigger amplitude. The more volatile a stock is, the riskier it is.
Close-to-close historical volatility calculated using only stock's closing prices. It is the simplest volatility estimator. But in many cases, it is not precise enough. Stock prices could jump considerably during a trading session, and return to the open value at the end. That means that a big amount of price information is not taken into account by close-to-close volatility .
Despite its drawbacks, Close-to-Close volatility is still useful in cases where the instrument doesn't have intraday prices. For example, mutual funds calculate their net asset values daily or weekly, and thus their prices are not suitable for more sophisticated volatility estimators.
Parkinson
Parkinson volatility is a volatility measure that uses the stock’s high and low price of the day.
The main difference between regular volatility and Parkinson volatility is that the latter uses high and low prices for a day, rather than only the closing price. That is useful as close to close prices could show little difference while large price movements could have happened during the day. Thus Parkinson's volatility is considered to be more precise and requires less data for calculation than the close-close volatility .
One drawback of this estimator is that it doesn't take into account price movements after market close. Hence it systematically undervalues volatility . That drawback is taken into account in the Garman-Klass's volatility estimator.
Garman-Klass
Garman Klass is a volatility estimator that incorporates open, low, high, and close prices of a security.
Garman-Klass volatility extends Parkinson's volatility by taking into account the opening and closing price. As markets are most active during the opening and closing of a trading session, it makes volatility estimation more accurate.
Garman and Klass also assumed that the process of price change is a process of continuous diffusion (Geometric Brownian motion). However, this assumption has several drawbacks. The method is not robust for opening jumps in price and trend movements.
Despite its drawbacks, the Garman-Klass estimator is still more effective than the basic formula since it takes into account not only the price at the beginning and end of the time interval but also intraday price extremums.
Researchers Rogers and Satchel have proposed a more efficient method for assessing historical volatility that takes into account price trends. See Rogers-Satchell Volatility for more detail.
Rogers-Satchell
Rogers-Satchell is an estimator for measuring the volatility of securities with an average return not equal to zero.
Unlike Parkinson and Garman-Klass estimators, Rogers-Satchell incorporates drift term (mean return not equal to zero). As a result, it provides a better volatility estimation when the underlying is trending.
The main disadvantage of this method is that it does not take into account price movements between trading sessions. It means an underestimation of volatility since price jumps periodically occur in the market precisely at the moments between sessions.
A more comprehensive estimator that also considers the gaps between sessions was developed based on the Rogers-Satchel formula in the 2000s by Yang-Zhang. See Yang Zhang Volatility for more detail.
Yang-Zhang
Yang Zhang is a historical volatility estimator that handles both opening jumps and the drift and has a minimum estimation error.
We can think of the Yang-Zhang volatility as the combination of the overnight (close-to-open volatility ) and a weighted average of the Rogers-Satchell volatility and the day’s open-to-close volatility . It considered being 14 times more efficient than the close-to-close estimator.
Garman-Klass-Yang-Zhang
Garman-Klass-Yang-Zhang (GKYZ) volatility estimator consists of using the returns of open, high, low, and closing prices in its calculation.
GKYZ volatility estimator takes into account overnight jumps but not the trend, i.e. it assumes that the underlying asset follows a GBM process with zero drift. Therefore the GKYZ volatility estimator tends to overestimate the volatility when the drift is different from zero. However, for a GBM process, this estimator is eight times more efficient than the close-to-close volatility estimator.
Exponential Weighted Moving Average
The Exponentially Weighted Moving Average (EWMA) is a quantitative or statistical measure used to model or describe a time series. The EWMA is widely used in finance, the main applications being technical analysis and volatility modeling.
The moving average is designed as such that older observations are given lower weights. The weights fall exponentially as the data point gets older – hence the name exponentially weighted.
The only decision a user of the EWMA must make is the parameter lambda. The parameter decides how important the current observation is in the calculation of the EWMA. The higher the value of lambda, the more closely the EWMA tracks the original time series.
Standard Deviation of Log Returns
This is the simplest calculation of volatility . It's the standard deviation of ln(close/close(1))
Pseudo GARCH(2,2)
This is calculated using a short- and long-run mean of variance multiplied by θ.
θavg(var ;M) + (1 − θ) avg (var ;N) = 2θvar/(M+1-(M-1)L) + 2(1-θ)var/(M+1-(M-1)L)
Solving for θ can be done by minimizing the mean squared error of estimation; that is, regressing L^-1var - avg (var; N) against avg (var; M) - avg (var; N) and using the resulting beta estimate as θ.
Average True Range
The average true range (ATR) is a technical analysis indicator, introduced by market technician J. Welles Wilder Jr. in his book New Concepts in Technical Trading Systems, that measures market volatility by decomposing the entire range of an asset price for that period.
The true range indicator is taken as the greatest of the following: current high less the current low; the absolute value of the current high less the previous close; and the absolute value of the current low less the previous close. The ATR is then a moving average, generally using 14 days, of the true ranges.
True Range Double
A special case of ATR that attempts to correct for volatility skew.
Additional features will be added in future releases.
This indicator is only available to ALGX Trading VIP group members . You can see the Author's Instructions below to get more information on how to get access.
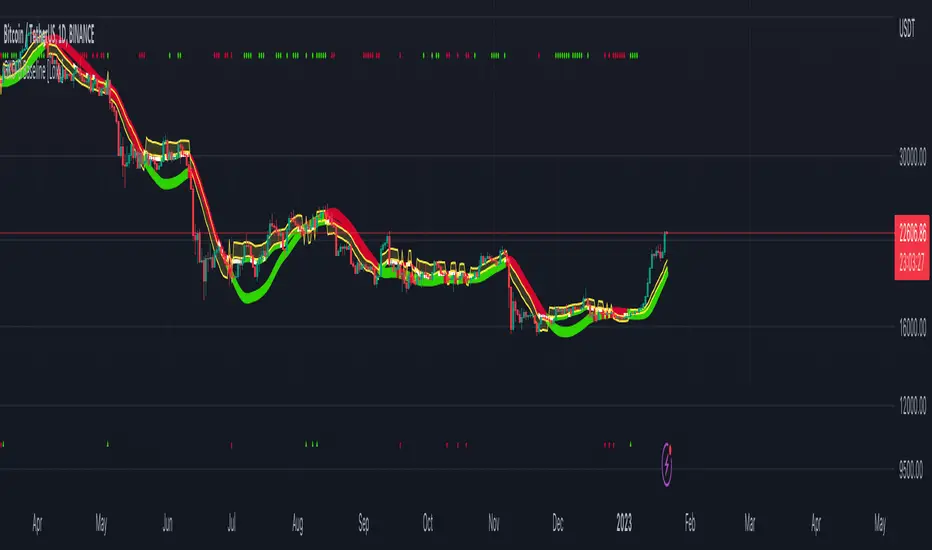
MathConstantsLibrary "MathConstants"
Mathematical Constants
E() The number e
Log2E() The number log (e)
Log10E() The number log (e)
Ln2() The number log (2)
Ln10() The number log (10)
LnPi() The number log (pi)
Ln2PiOver2() The number log (2*pi)/2
InvE() The number 1/e
SqrtE() The number sqrt(e)
Sqrt2() The number sqrt(2)
Sqrt3() The number sqrt(3)
Sqrt1Over2() The number sqrt(1/2) = 1/sqrt(2) = sqrt(2)/2
HalfSqrt3() The number sqrt(3)/2
Pi() The number pi
Pi2() The number pi*2
PiOver2() The number pi/2
Pi3Over2() The number pi*3/2
PiOver4() The number pi/4
SqrtPi() The number sqrt(pi)
Sqrt2Pi() The number sqrt(2pi)
SqrtPiOver2() The number sqrt(pi/2)
Sqrt2PiE() The number sqrt(2*pi*e)
LogSqrt2Pi() The number log(sqrt(2*pi))
LogSqrt2PiE() The number log(sqrt(2*pi*e))
LogTwoSqrtEOverPi() The number log(2 * sqrt(e / pi))
InvPi() The number 1/pi
TwoInvPi() The number 2/pi
InvSqrtPi() The number 1/sqrt(pi)
InvSqrt2Pi() The number 1/sqrt(2pi)
TwoInvSqrtPi() The number 2/sqrt(pi)
TwoSqrtEOverPi() The number 2 * sqrt(e / pi)
Degree() The number (pi)/180 - factor to convert from Degree (deg) to Radians (rad).
Grad() The number (pi)/200 - factor to convert from NewGrad (grad) to Radians (rad).
PowerDecibel() The number ln(10)/20 - factor to convert from Power Decibel (dB) to Neper (Np). Use this version when the Decibel represent a power gain but the compared values are not powers (e.g. amplitude, current, voltage).
NeutralDecibel() The number ln(10)/10 - factor to convert from Neutral Decibel (dB) to Neper (Np). Use this version when either both or neither of the Decibel and the compared values represent powers.
Catalan() The Catalan constant
Sum(k=0 -> inf){ (-1)^k/(2*k + 1)2 }
EulerMascheroni() The Euler-Mascheroni constant
lim(n -> inf){ Sum(k=1 -> n) { 1/k - log(n) } }
GoldenRatio() The number (1+sqrt(5))/2, also known as the golden ratio
Glaisher() The Glaisher constant
e^(1/12 - Zeta(-1))
Khinchin() The Khinchin constant
prod(k=1 -> inf){1+1/(k*(k+2))^log(k,2)}

[astropark] Auto Fibonacci Retracement ExtensionDear followers,
today a new analysis tool for day trading, scalping and swing trading: Automatic Fibonacci Retracements and Extensions drawer!
It works on every timeframe and market, as it simply draws automatically most important fibonacci levels on the chart.
Based on the analysis window set (default 100 bars, but you can edit it as you like), it finds recent high and low and start drawing the following levels:
recent high and low (black)
golden retracement range: 0.5 * 0.618 * 0.705 fibonacci retracements (gold)
fibonacci extensions range above 1: 1.272 * 1.424 * 1.618 * 2.618 * 4.236 (blue)
fibonacci extensions range below 0: -0.238 * -0.618 * -0.706 * -1(fuchsia)
Whenever the indicator finds a new high or a new low, al fibonacci levels are re-draw automatically.
The indicator will let you:
change analysis window
enable displaying labels related to current fibonacci levels and/or prices
change colors
show/hide each specific level
How to use the indicator?
Basically, all techniques which apply to fibonacci tool are valid here too.
After a big move up or down, a new high or low is created and a retracement is expected: if trend is strong, retracement to golden ration 0.618 will be a perfect spot for buy or sell respectively in order to continue riding the trend.
In general a bounce is always expected when price hit 0.618 retracement , good to know for scalping traders, while swing trades will continue holding the trade for higher profits.
If the golden retracement range (0.5 - 0.705) is broken and then retested from the other side, a continuation move is expected towards previous high/low (fib level 1) and even more towards the fibonacci extensions range above 1 (1.618 - 2.618 - 4.236).
If the base of bounce and trend continuation on golden retracement range, traders can expect
price to hit again previous high/low and
if trend is strong, a consolidation near the previous high/low range (conditions that are respectively bullish and bearish)
do a further continuation towards -0.618 fib level range
Traders must always understand that
the higher the timeframe, the stronger is the meaning and so the reaction when a specific fibonacci level is hit
don't trade blindly, try to find confluences to have an higher chance to be in a winning trade in near future
money and risk management are very important, so manage your position size and always have a stop loss in your trades
As said, this indicators work on every timeframe and in all markets (Crypto currencies, stocks, FOREX, indexes, commodities). Here some examples:
BTCUSDT 1D: after a long run, a retracement is expected and a bounce at 0.618 golden level is more than obvious: perfect short (sell) entry
BTCUSDT 1D: again as previous example, after a long run, a retracement is expected as well as price's bounces back above
EURUSD 1h: lots of info here, directly in the chart below:
bounces on 0.618 golden zone
double top
price breaks 0.618 level and retests it from below targeting previous low
double bottom and bounce back towards golden zone
bearish consolidation at recent low and further decline towards 1.618 fib extension
AMZN 1h stock: lots of info here too, directly in the chart below:
new high is print, price retrace to golden zone
bounces on 0.618 golden zone
price breaks 0.618 level and retests it from below targeting previous low
double bottom and bounce back towards golden zone
rejection at golden zone, price falling targeting previous low again and probably 1.618 fib extension
price breaks hard previous low and hits fib extension range below recent low
price retraces back up towards new golden retracement range
golden retracement range is broken and used as support: targets are previous high and 1.618 extension
once 1.618 extension level is broken and retested successfully as support, price moves towards 2.618 fibonacci extension level
SPY (SPX500) index: lots of info in the chart
interesting to note that March 2020 huge dump can be totally mapped as a series of fibonacci level bounces, so you understand the importance of riding a trend now, right?
after the low was formed, price retraced perfectly to golden ration 0.618
each time price hit a golden level/range, it retraces creating double top and double bottom configurations too
In the chart below we can see the power of the double bottom at golden retracement level: targets are previous high and -0.618 fibonacci extension level
XAUUSD 15m: as we are in a lower timeframe, the default analysis windows has been reduced to 50.
What can we see here:
golden retracement and price is rejected towards previous low
golden retracement hit and price bounces back lower
new high is formed: golden retracement hit and price bounces back higher
price break previous high and hits fibonacci extensions -0.618 and -1
price continues rising forming a regular bearish divergence with RSI
once uptrend is broken, price falls dramatically
first target is 0.618 retracement level, where you see a very small retracement due to strength of sellers
second target is previous low, which is broken and retested many time from below (bearish retest)
third target is fibonacci extension range (in this case 1.414 is almost hit)
as an hidden bullish divergence with RSI was created, price goes back up
This is a premium indicator , so send me a private message in order to get access to this script.
Fibonacci Disciples Auto Levels (ES/NQ/GC/NQ WIDE) - APPROVEDPVTEvery Index, every ETF , every sector started somewhere.
That starting point defines Zones that follow that Index, or ETF forever.
What i am saying is - everything you are trading has a pre-defined range of movement that was established when the stock Index became available to the market.
It is this range that defines specific levels that will always play a significant part in the movement of that stock, or Index for its entire lifespan.
This script will automatically multiply that original price range to the stock or index’s current real time value using Fibonacci sequence and a proprietary pre-calculated Fibonacci formula to draw custom Golden Ratios on your chart in real-time. Each gold line represents a new “Golden Ratio” that is, or has already emerged as price moves up and down.
This phenomenon becomes possible by sealing the gaps between Fibonacci Fractal retracements making each gold line a measured .618:1.618 Golden Ratio.
Having these unique Golden Ratios displayed automatically on your chart allows you as the Trader to always have a price target in mind rather than having to guess where price might be headed on a naked chart.
From there you are welcome to add your favorite moving average or any other tool you wish to help determine the overall direction of the trend whilst using these Golden Ratio targets for scalping opportunities. If you do not know how to identify fractal W’s and M’s may I suggest you utilize a public Williams Fractal tool to accompany this indicator script.
Due to the scalping nature of this tool it will be best used on all time frames from 1min up to 4hrs.
Each measured line is customizable to your liking. If you wish to see less you can unclick individual measurements. I suggest leaving the “Baseline” and each “.618%” line active.
You can also change the color of the lines if you wish.
If you would like access to this script you can either DM me on TradingView

Southnjes - Auto Fibonacci LevelsI obtained this script elsewhere and modified it. Original Script by "borserman". Thank you for this.
I added some extras that he did not have, hence the uploaded and modified version.
I tried to add this to my "Southnjes- Multi 5MA/5EMA crossover signal + RSI/MACD/STOCH Div signal + Bollinger + Candlestick signals." But there were too many outputs so it had to go separate.
Anyway. You can change the "Fib period" to get the positions you need on the levels. Default is 100 but I will change mine to 25/50/200 and sometimes 180 or 220 which gives me my needed highs and lows for calculations. Play with it as it only takes a minute or so to get the desired H/L.
Golden pocket is mapped in golden.
Green is up, Red is down.
Higher Fib levels can be turned off or on (1.272-3.618).
I hope you all enjoy it and again, don't forget to visit borserman for his other great scripts. :)
🔗Blockchain Fundamentals - Bitcoin's Stock to Flow Ratio🔗Blockchain Fundamentals - Bitcoin's Stock to Flow Ratio by Cryptorhythms
Intro
What is a stock to flow ratio and why is it important? The stock-to-flow ratio of a commodity is the amount of the asset that is held in reserves divided by the amount produced every year.
The higher the stock-to-flow ratio the reduced inflation occurs on the asset annually. Commodities with a higher stock-to-flow ratio are preferred for their scarcity.
How does it relate to Bitcoin?
Today, Bitcoin has a considerable lower stock-to-flow ratio than gold and this is where the opportunity presents itself. Bitcoin’s software has a core component cooked into the protocol in the form of an event called “the halvening”
‘The halving’ is an event that happens every 210,000 blocks or roughly every 4 years where the block reward given to the miners for securing the network gets halved. For example in 2009 the block reward was 50 BTC and today in 2019 it currently sits at 12.5 BTC with the ETA for next halving happening on Mon, 25 May 2020 which will take reward down to 6.25 BTC.
The idea that Bitcoin is the first ever truly verifiable, non-confiscatable fixed asset to exist is an extremely powerful concept. Without its strong and non-inflatable monetary policy Bitcoin would have a futile attempt of being able to disrupt gold and even accrue value in the first place.
Over the next several decades we will see Bitcoin’s stock-to-flow ratio increase significantly into never before seen water. No other asset will have anywhere near the scarcity of bitcoin.
With the incredible influx of talent coming into the industry to build out the infrastructure (custodial, ETF’s, futures) needed to allow legacy financial institutions to dip their toes in the soon smooth and regulated crypto asset waters. The next few years will be very interesting.
You might say "where will all this capital come from to propel bitcoin to new all time highs?"
1. Well asteroid mining is coming which could well eliminate golds scarcity. Your garden variety metallic asteroid could contain as much gold as half the gold humanity has ever mined!
2. Countries/economies with negative interest rate monetary policy and /or heavy quantitative easing. Their currency supply and debt just keep increasing...
3. Countries looking for ways around the USD dominated and US controlled financial systems (Iran, Russia, Venezuela, North Korea, etc)
4. There's tons more I just wanted to highlight a few.
Usage
You can compare Bitcoin with various other precious metals and commodities from the settings panel. I suggest a logarithmic scale for this indicator, other wise most assets are clumped at the bottom:
There's also plots for the forecasted (estimated) SFR ratios after the 2020 and 2024 Halvings.
👍 Enjoying this indicator or find it useful? Please give me a like and follow! I post crypto analysis, price action strategies and free indicators regularly.
💬 Questions? Comments? Want to get access to an entire suite of proven trading indicators? Come visit us on telegram and chat, or just soak up some knowledge. We make timely posts about the market, news, and strategy everyday. Our community isn't open only to subscribers - everyone is welcome to join.
For Trialers & Chat: t.me

Custom Time Frame Moving Aver Cross w/Alerts - VWAP - BBandsWork in progress
- made the VWAP really small because it is only used on the shorter time frames, but it is nice to have at times
- BBands are great for showing me when to pay even more attention, when they are squeezing
Open to suggestions

MA(7/28) + RSI + MACD(hist) — AUTO(exit)Trading Strategy Overview
This strategy combines Moving Averages (7-day & 28-day), RSI (Relative Strength Index), and MACD (Moving Average Convergence Divergence) to generate highly accurate trading signals, especially for short-term traders.
Entry Signals
Golden Cross / Death Cross:
The 7-day moving average crossing above the 28-day signals a bullish momentum (Golden Cross), while crossing below signals bearish momentum (Death Cross).
RSI Confirmation:
RSI above 50 confirms long entries, while RSI below 50 confirms short entries.
MACD Histogram Filter:
Positive histogram values strengthen long entries, while negative values support short entries.
Exit & Position Management
Trades are exited when the MACD histogram shifts direction (positive to negative or vice versa), clearly marking the optimal take-profit or exit zone.
Performance
With this multi-layer confirmation system, the strategy filters out false signals and provides up to 90% accuracy in entry/exit timing, making it particularly effective for scalpers and short-term traders who seek high-probability setups.

MA + RSI + MACD StrategyTrading Strategy Overview
This strategy combines Moving Averages (7-day & 28-day), RSI (Relative Strength Index), and MACD (Moving Average Convergence Divergence) to generate highly accurate trading signals, especially for short-term traders.
Entry Signals
Golden Cross / Death Cross:
The 7-day moving average crossing above the 28-day signals a bullish momentum (Golden Cross), while crossing below signals bearish momentum (Death Cross).
RSI Confirmation:
RSI above 50 confirms long entries, while RSI below 50 confirms short entries.
MACD Histogram Filter:
Positive histogram values strengthen long entries, while negative values support short entries.
Exit & Position Management
Trades are exited when the MACD histogram shifts direction (positive to negative or vice versa), clearly marking the optimal take-profit or exit zone.
Performance
With this multi-layer confirmation system, the strategy filters out false signals and provides up to 90% accuracy in entry/exit timing, making it particularly effective for scalpers and short-term traders who seek high-probability setups.

Killzones High/Low [FD] - ENGKillzones High/Low - ENG
Advanced Pine Script v5 indicator designed for ICT (Inner Circle Trader) strategies that identifies trading killzones, key support/resistance levels and midnight prices with granular controls for every element.
SETTINGS
General controls that affect all indicator elements:
Session Drawings Limit (1): Determines how many historical sessions to keep on chart for each element type. Higher values show more history but may slow performance
Timeframe Limit (30): Drawings disappear on timeframes equal or higher to avoid visual overload
Time Zone: Select reference timezone for sessions. America/New_York automatically adjusts for daylight saving, GMT options are fixed
Label Size: Controls global size of all labels (from Tiny to Huge)
Drawings Cutoff Time: Stops extension of all pivots at specified time (useful for end of trading day)
KILLZONES
Manages critical trading sessions with colored boxes and pivot lines:
General Controls
Show Boxes/Text: Enables visualization and texts in session boxes
Transparency: Controls opacity of boxes and text (0=opaque, 100=transparent)
Available Sessions
Five configurable sessions with individual controls for enabling, custom text, times and colors:
Asia (18:00-00:00): Blue by default
London (02:30-05:30): Red by default
N.Y. AM (07:00-11:30): Green by default
Lunch (11:30-13:00): Golden yellow, enabled by default
N.Y. PM (13:00-16:00): Purple by default
PDH / PDL
Manages Previous Day High and Previous Day Low levels:
Show PDH/PDL: Enables previous day's maximum/minimum
Extension: "Until Mitigation" (stops when broken) or "Most Recent Candle" (continues always)
Colors/Thickness: Visual customization of lines (dark purple by default, 1px thickness)
Labels: Shows "PDH"/"PDL" texts with customizable color (white by default)
PWH / PWL
Manages Previous Week High and Previous Week Low levels:
Show PWH/PWL: Enables previous week's maximum/minimum
Extension: Independent control of line extension
Colors/Thickness: Orange by default for both, 2px thickness
Labels: Configurable "PWH"/"PWL" texts
PMH / PML
Manages Previous Month High and Previous Month Low levels:
Show PMH/PML: Enables previous month's maximum/minimum using security()
Extension: Independent control like other systems
Colors/Thickness: Blue by default for both, 1px thickness
Labels: Customizable "PMH"/"PML" texts
MIDNIGHT PRICE LEVEL
Advanced system for multiple midnight prices:
Base Controls
Show Midnight Price: Enables line at pre-00:00 closing price (ICT strategy)
Midnight -2/-3 Days: Extends system to 2 and 3 days prior
Extension/Mitigation: "Until Mitigation" or "Most Recent Candle" with "Once" or "Multiple" mode
Customization
Separate Colors: D-1, D-2, D-3 with progressive transparency (gold by default)
Style/Thickness: Customizable lines (Solid, Dotted, Dashed)
Labels: Configurable texts (🌙1, 🌙2, 🌙3) with customizable background/text colors
Alerts: Alerts when mitigated during active killzones
KILLZONE LEVEL
Controls pivot lines and killzone labels:
Line Controls
Show Lines: Enables horizontal lines on killzone highs/lows
Break Alerts: Alerts when pivots are exceeded
Midpoints: Dashed lines at range center with stop option after mitigation
Label Offset: Moves labels ahead by 5 candles (0-20 configurable), rejoining when mitigated
Label Controls
Text Customization: Configurable labels for each session (Asia_H/L, London_H/L, etc.)
Background/Colors: Transparent or visible labels with customizable colors
Broken Labels: Additional text (❌ by default) and special colors when pivots mitigated
Extension: "Until Mitigation" or "Beyond Mitigation" with session filter ("Most Recent" or "All")
LABEL STYLES
Four dedicated sections to customize label graphic shapes:
Killzone Line Label Styles: Separate controls for killzone High/Low
PDH/PDL Label Styles: Customizable shapes for Previous Day levels
PWH/PWL Label Styles: Customizable shapes for Previous Week levels
PMH/PML Label Styles: Customizable shapes for Previous Month levels
Each section offers 15+ shape options (Arrows, Center, Circle, Square, Diamond, Triangles, Crosses, Flags, etc.)
MIDNIGHT LINES
System for vertical lines at 00:00:
Show Lines/Labels: Vertical lines with upward arrow labels
Customization: Color (gray by default), style, thickness of vertical lines
Labels: Configurable text ("00:00" by default) with customizable text color (black by default)
Label Offset: Percentage control (-10000% to +10000%) for vertical positioning
Extension: Configurable directions (None, Above, Below, Both)
Limit: Maximum number of lines maintained (4 by default, max 50)
The indicator offers granular control over every visual and functional aspect, making it possible to adapt it to any ICT trading strategy or personal setup.

Killzones High/Low [FD] - ITADESCRIPTION ENGLISH - ITALIAN
Killzones High/Low - ITA - Indicator Description
Advanced Pine Script v5 indicator designed for ICT (Inner Circle Trader) strategies that identifies trading killzones, key support/resistance levels and midnight prices with granular controls for every element.
SETTINGS
General controls that affect all indicator elements:
Session Drawings Limit (1): Determines how many historical sessions to keep on chart for each element type. Higher values show more history but may slow performance
Timeframe Limit (30): Drawings disappear on timeframes equal or higher to avoid visual overload
Time Zone: Select reference timezone for sessions. America/New_York automatically adjusts for daylight saving, GMT options are fixed
Label Size: Controls global size of all labels (from Tiny to Huge)
Drawings Cutoff Time: Stops extension of all pivots at specified time (useful for end of trading day)
KILLZONES
Manages critical trading sessions with colored boxes and pivot lines:
General Controls
Show Boxes/Text: Enables visualization and texts in session boxes
Transparency: Controls opacity of boxes and text (0=opaque, 100=transparent)
Available Sessions
Five configurable sessions with individual controls for enabling, custom text, times and colors:
Asia (18:00-00:00): Blue by default
London (02:30-05:30): Red by default
N.Y. AM (07:00-11:30): Green by default
Lunch (11:30-13:00): Golden yellow, enabled by default
N.Y. PM (13:00-16:00): Purple by default
PDH / PDL
Manages Previous Day High and Previous Day Low levels:
Show PDH/PDL: Enables previous day's maximum/minimum
Extension: "Until Mitigation" (stops when broken) or "Most Recent Candle" (continues always)
Colors/Thickness: Visual customization of lines (dark purple by default, 1px thickness)
Labels: Shows "PDH"/"PDL" texts with customizable color (white by default)
PWH / PWL
Manages Previous Week High and Previous Week Low levels:
Show PWH/PWL: Enables previous week's maximum/minimum
Extension: Independent control of line extension
Colors/Thickness: Orange by default for both, 2px thickness
Labels: Configurable "PWH"/"PWL" texts
PMH / PML
Manages Previous Month High and Previous Month Low levels:
Show PMH/PML: Enables previous month's maximum/minimum using security()
Extension: Independent control like other systems
Colors/Thickness: Blue by default for both, 1px thickness
Labels: Customizable "PMH"/"PML" texts
MIDNIGHT PRICE LEVEL
Advanced system for multiple midnight prices:
Base Controls
Show Midnight Price: Enables line at pre-00:00 closing price (ICT strategy)
Midnight -2/-3 Days: Extends system to 2 and 3 days prior
Extension/Mitigation: "Until Mitigation" or "Most Recent Candle" with "Once" or "Multiple" mode
Customization
Separate Colors: D-1, D-2, D-3 with progressive transparency (gold by default)
Style/Thickness: Customizable lines (Solid, Dotted, Dashed)
Labels: Configurable texts (🌙1, 🌙2, 🌙3) with customizable background/text colors
Alerts: Alerts when mitigated during active killzones
KILLZONE LEVEL
Controls pivot lines and killzone labels:
Line Controls
Show Lines: Enables horizontal lines on killzone highs/lows
Break Alerts: Alerts when pivots are exceeded
Midpoints: Dashed lines at range center with stop option after mitigation
Label Offset: Moves labels ahead by 5 candles (0-20 configurable), rejoining when mitigated
Label Controls
Text Customization: Configurable labels for each session (Asia_H/L, London_H/L, etc.)
Background/Colors: Transparent or visible labels with customizable colors
Broken Labels: Additional text (❌ by default) and special colors when pivots mitigated
Extension: "Until Mitigation" or "Beyond Mitigation" with session filter ("Most Recent" or "All")
LABEL STYLES
Four dedicated sections to customize label graphic shapes:
Killzone Line Label Styles: Separate controls for killzone High/Low
PDH/PDL Label Styles: Customizable shapes for Previous Day levels
PWH/PWL Label Styles: Customizable shapes for Previous Week levels
PMH/PML Label Styles: Customizable shapes for Previous Month levels
Each section offers 15+ shape options (Arrows, Center, Circle, Square, Diamond, Triangles, Crosses, Flags, etc.)
MIDNIGHT LINES
System for vertical lines at 00:00:
Show Lines/Labels: Vertical lines with upward arrow labels
Customization: Color (gray by default), style, thickness of vertical lines
Labels: Configurable text ("00:00" by default) with customizable text color (black by default)
Label Offset: Percentage control (-10000% to +10000%) for vertical positioning
Extension: Configurable directions (None, Above, Below, Both)
Limit: Maximum number of lines maintained (4 by default, max 50)
The indicator offers granular control over every visual and functional aspect, making it possible to adapt it to any ICT trading strategy or personal setup.
---ITALIANO---
Killzones High/L ow - ITA
Indicatore avanzato per Pine Script v5 progettato per strategie ICT (Inner Circle Trader) che identifica killzones di trading, livelli chiave di supporto/resistenza e prezzi di mezzanotte con controlli granulari per ogni elemento.
IMPOSTAZIONI
Controlli generali che influenzano tutti gli elementi dell'indicatore:
-Limite Disegni Sessione (1): Determina quante sessioni storiche mantenere sul grafico per ogni tipo di elemento. Valori più alti mostrano più cronologia ma possono rallentare le prestazioni
-Limite Timeframe (30): I disegni scompaiono su timeframe uguali o superiori per evitare sovraccarico visivo
-Fuso Orario: Seleziona il fuso di riferimento per le sessioni. America/New_York si regola automaticamente per l'ora legale, le opzioni GMT sono fisse
-Dimensione Etichette: Controlla la dimensione globale di tutte le etichette (da Minuscola a Enorme)
-Orario Limite Disegni: Ferma l'estensione di tutti i pivot all'orario specificato (utile per fine giornata di trading)
KILLZONES
Gestisce le sessioni di trading critiche con riquadri colorati e linee pivot:
Controlli Generali
-Mostra Riquadri/Testo: Abilita visualizzazione e testi nei riquadri delle sessioni
-Trasparenza: Controlla opacità di riquadri e testo (0=opaco, 100=trasparente)
Sessioni Disponibili
Cinque sessioni configurabili con controlli individuali per abilitazione, testo personalizzato, orari e colori:
Asia (18:00-00:00): Blu di default
London (02:30-05:30): Rosso di default
N.Y. AM (07:00-11:30): Verde di default
Lunch (11:30-13:00): Giallo dorato, abilitata di default
N.Y. PM (13:00-16:00): Viola di default
PDH / PDL
Gestisce i livelli Previous Day High e Previous Day Low:
-Mostra PDH/PDL: Abilita massimo/minimo del giorno precedente
-Estensione: "Fino a Mitigazione" (si ferma quando rotto) o "Candela Più Recente" (continua sempre)
-Colori/Spessore: Personalizzazione visiva delle linee (viola scuro di default, spessore 1px)
-Etichette: Mostra testi "PDH"/"PDL" con colore personalizzabile (bianco di default)
PWH / PWL
Gestisce i livelli Previous Week High e Previous Week Low:
-Mostra PWH/PWL: Abilita massimo/minimo della settimana precedente
-Estensione: Controllo indipendente dell'estensione delle linee
-Colori/Spessore: Arancione di default per entrambi, spessore 2px
-Etichette: Testi "PWH"/"PWL" configurabili
PMH / PML
Gestisce i livelli Previous Month High e Previous Month Low:
-Mostra PMH/PML: Abilita massimo/minimo del mese precedente utilizzando security()
-Estensione: Controllo indipendente come gli altri sistemi
-Colori/Spessore: Blu di default per entrambi, spessore 1px
-Etichette: Testi "PMH"/"PML" personalizzabili
MIDNIGHT PRICE LEVEL
Sistema avanzato per prezzi di mezzanotte multipli:
Controlli Base
-Mostra Midnight Price: Abilita linea al prezzo di chiusura pre-00:00 (strategia ICT)
-Midnight -2/-3 Giorni: Estende il sistema a 2 e 3 giorni precedenti
-Estensione/Mitigazione: "Fino a Mitigazione" o "Candela Più Recente" con modalità "Una Volta" o "Multipla"
Personalizzazione
-Colori separati: D-1, D-2, D-3 con trasparenza progressiva (giallo oro di default)
-Stile/Spessore: Linee personalizzabili (Solida, Punteggiata, Tratteggiata)
-Etichette: Testi configurabili (🌙1, 🌙2, 🌙3) con colori sfondo/testo personalizzabili
-Avvisi: Alert quando mitigati durante killzones attive
KILLZONE LEVEL
Controlla linee pivot e etichette delle killzones:
Controlli Linee
-Mostra Linee: Abilita linee orizzontali sui massimi/minimi delle killzones
-Avvisi Rottura: Alert quando pivot vengono superati
-Punti Medi: Linee tratteggiate al centro del range con opzione di stop dopo mitigazione
-Offset Etichette: Sposta etichette avanti di 5 candele (0-20 configurabile), ricongiungendole quando mitigate
Controlli Etichette
-Personalizzazione Testi: Etichette configurabili per ogni sessione (Asia_H/L, London_H/L, ecc.)
-Sfondo/Colori: Etichette trasparenti o visibili con colori personalizzabili
-Etichette Rotte: Testo aggiuntivo (❌ di default) e colori speciali quando pivot mitigati
-Estensione: "Fino a Mitigazione" o "Oltre Mitigazione" con filtro sessioni ("Più Recente" o "Tutte")
STILI ETICHETTE
Tre sezioni dedicate per personalizzare la forma grafica delle etichette:
-Stili Etichette Linee Killzones: Controlli separati per High/Low delle killzones
-Stili Etichette PDH/PDL: Forme personalizzabili per Previous Day levels
-Stili Etichette PWH/PWL: Forme personalizzabili per Previous Week levels
-Stili Etichette PMH/PML: Forme personalizzabili per Previous Month levels
Ogni sezione offre 15+ opzioni di forma (Frecce, Centro, Cerchio, Quadrato, Diamante, Triangoli, Croci, Bandiere, ecc.)
LINEE MEZZANOTTE
Sistema per linee verticali alle ore 00:00:
-Mostra Linee/Etichette: Linee verticali con etichette freccia verso l'alto
-Personalizzazione: Colore (grigio di default), stile, spessore delle linee verticali
-Etichette: Testo configurabile ("00:00" di default) con colore testo personalizzabile (nero di default)
-Offset Etichette: Controllo percentuale (-10000% a +10000%) per posizionamento verticale
-Estensione: Direzioni configurabili (Nessuna, Sopra, Sotto, Entrambe)
-Limite: Numero massimo linee mantenute (4 di default, max 50)
L'indicatore offre controllo granulare su ogni aspetto visivo e funzionale, rendendo possibile adattarlo a qualsiasi strategia di trading ICT o setup personale.
Rolling Correlation BTC vs Hedge AssetsRolling Correlation BTC vs Hedge Assets
Overview
This indicator calculates and plots the rolling correlation between Bitcoin (BTC) returns and several key hedge assets:
• XAUUSD (Gold)
• EURUSD (proxy for DXY, U.S. Dollar Index)
• VIX (Volatility Index)
• TLT (20y U.S. Treasury Bonds ETF)
By monitoring these dynamic correlations, traders can identify whether BTC is moving in sync with risk assets or decoupling as a hedge, and adjust their trading strategy accordingly.
How it works
1. Computes returns for BTC and each asset using percentage change.
2. Uses the rolling correlation function (ta.correlation) over a configurable window length (default = 12 bars).
3. Plots each correlation as a separate colored line (Gold = Yellow, EURUSD = Blue, VIX = Red, TLT = Green).
4. Adds threshold levels at +0.3 and -0.3 to help classify correlation regimes.
How to use it
• High positive correlation (> +0.3): BTC is moving together with the asset (risk-on behavior).
• Near zero (-0.3 to +0.3): BTC is showing little to no correlation — neutral/independent moves.
• Negative correlation (< -0.3): BTC is moving in the opposite direction — potential hedge opportunity.
Practical strategies:
• Watch BTC vs VIX: a spike in volatility (VIX ↑) usually coincides with BTC selling pressure.
• Track BTC vs EURUSD: stronger USD often puts downside pressure on BTC.
• Observe BTC vs Gold: during “flight to safety” events, gold rises while BTC weakens.
• Monitor BTC vs TLT: rising yields (falling TLT) often align with BTC weakness.
Inputs
• Window Length (bars): Number of bars used to calculate rolling correlations (default = 12).
• Comparison Timeframe: Default = 5m. Can be changed to align with your intraday or swing trading style.
Notes
• Works best on intraday charts (1m, 5m, 15m) for scalping and short-term setups.
• Use correlations as context, not standalone signals — combine with volume, VWAP, and price action.
• Correlations are dynamic; they can switch regimes quickly during macro events (CPI, NFP, FOMC).
This tool is designed for traders who want to manage risk exposure by monitoring whether BTC is behaving as a risk-on asset or hedge, and to exploit opportunities during decoupling phases.

[blackcat] L1 Value Trend IndicatorOVERVIEW
The L1 Value Trend Indicator is a sophisticated technical analysis tool designed for TradingView users seeking advanced market trend identification and trading signals. This comprehensive indicator combines multiple analytical techniques to provide traders with a holistic view of market dynamics, helping identify potential entry and exit points through various signal mechanisms. 📈 It features a main Value Trend line along with a lagged version, golden cross and dead cross signals, and multiple technical indicators including RSI, Williams %R, Stochastic %K/D, and Relative Strength calculations. The indicator also includes reference levels for support and resistance analysis, making it a versatile tool for both short-term and long-term trading strategies. ✅
FEATURES
📈 Primary Value Trend Line: Calculates a smoothed value trend using a combination of SMA and custom smoothing techniques
🔍 Value Trend Lag: Implements a lagged version of the main trend line for cross-over analysis
🚀 Golden Cross & Dead Cross Signals: Identifies buy/sell opportunities when the main trend line crosses its lagged version
💸 Multi-Indicator Integration: Combines multiple technical analysis tools for comprehensive market view
📊 RSI Calculations: Includes 6-period, 7-period, and 13-period RSI calculations for momentum analysis
📈 Williams %R: Provides overbought/oversold conditions using the Williams %R formula
📉 Stochastic Oscillator: Implements both Stochastic %K and %D calculations for momentum confirmation
📋 Relative Strength: Calculates relative strength based on highest highs and current price
✅ Visual Labels: Displays BUY and SELL labels on chart when crossover conditions are met
📣 Alert Conditions: Provides automated alert conditions for golden cross and dead cross events
📌 Reference Levels: Plots entry (25) and exit (75) reference lines for support/resistance analysis
HOW TO USE
Copy the Script: Copy the complete Pine Script code from the original file
Open TradingView: Navigate to TradingView website or application
Access Pine Editor: Go to the Pine Script editor (usually found in the chart toolbar)
Paste Code: Paste the copied script into the editor
Save Script: Save the script with a descriptive name like " L1 Value Trend Indicator"
Select Chart: Choose the chart where you want to apply the indicator
Add Indicator: Apply the indicator to your chart
Configure Parameters: Adjust input parameters to customize behavior
Monitor Signals: Watch for golden cross (BUY) and dead cross (SELL) signals
Use Reference Levels: Monitor entry (25) and exit (75) lines for support/resistance levels
LIMITATIONS
⚠️ Potential Repainting: The script may repaint due to lookahead bias in some calculations
📉 Lookahead Bias: Some calculations may reference future values, potentially causing repainting issues
🔄 Parameter Sensitivity: Results may vary significantly with different parameter settings
📉 Computational Complexity: May impact chart performance with heavy calculations on large datasets
📊 Resource Usage: Requires significant processing power for multiple indicator calculations
🔄 Data Sensitivity: Results may be affected by data quality and market conditions
NOTES
📈 Signal Timing: Cross-over signals may lag behind actual price movements
📉 Parameter Optimization: Optimal parameters may vary by market conditions and asset type
📋 Market Conditions: Performance may vary significantly across different market environments
📈 Multi-Indicator: Combine signals with other technical indicators for confirmation
📉 Timeframe Analysis: Use multiple timeframes for enhanced signal accuracy
📋 Volume Analysis: Incorporate volume data for additional confirmation
📈 Strategy Integration: Consider using this indicator as part of a broader trading strategy
📉 Risk Management: Use signals as part of a comprehensive risk management approach
📋 Backtesting: Test parameter combinations with historical data before live trading
THANKS
🙏 Original Creator: blackcat1402 creates the L1 Value Trend Indicator
📚 Community Contributions: Recognition to TradingView community for continuous improvements and contributions
📈 Collaborative Development: Appreciation for collaborative efforts in enhancing technical analysis tools
📉 TradingView Community: Special thanks to TradingView community members for their ongoing support and feedback
📋 Educational Resources: Recognition of educational resources that helped in understanding technical analysis principles

Auto Fib V2Auto Fib V2 — Advanced Fibonacci Mapping Tool
Introduction
Auto Fib V2 is an advanced Fibonacci retracement indicator that automatically adapts to recent market ranges. Rather than manually drawing Fibonacci lines, this script dynamically maps them based on the most recent highs and lows, allowing traders to see the chart as if it were a "navigation map." Its primary purpose is to help identify potential buy and sell zones with greater clarity.
Key Concept
The script is built on a simple but powerful interpretation of Fibonacci retracement:
When the price moves below the 0.236 level, it suggests an oversold zone, where buyers may step in and market reversal potential increases.
When the price rises above the 0.764 level, it highlights an overbought zone, where sellers may become more active and risk of reversal grows.
Between these extremes, the Golden Pocket (0.382–0.618 zone) is highlighted as the area where institutional traders and algorithms often react. Historically, this is one of the most respected Fibonacci areas in technical analysis.
Features & Customization
Automatic Range Detection: The indicator automatically finds the recent high/low (based on user-defined lookback bars) and applies Fibonacci levels.
Flexible Direction Setting: Traders can use Auto Mode to let the script decide direction from price movement, or manually choose upward/downward mapping.
Multiple Levels Display: Beyond the standard levels, extra fractional retracements (0.146, 0.309, 0.441, etc.) are included for more precise mapping.
Golden Pocket Highlighting: Visually emphasizes the 0.382–0.618 retracement zone for quick recognition.
Custom Styles: Switch between line-based and dot-based plotting, with adjustable colors and transparency for improved readability.
Practical Use
Auto Fib V2 is not intended as a direct buy/sell signal generator, but as a contextual guide. Traders can use it to:
Confirm whether the current price area is closer to an overbought or oversold condition.
Combine it with oscillators (RSI, MACD) or trend indicators (EMA, ADX) to strengthen trading decisions.
Identify confluence zones where Fibonacci levels overlap with key supports/resistances.
Quickly adapt to market shifts without the need to redraw Fibonacci retracement lines repeatedly.
Why Use Auto Fib V2?
Manual Fibonacci drawing can be subjective, often depending on the swing points a trader chooses. Auto Fib V2 reduces that subjectivity by using consistent logic, creating a more systematic approach. For intraday traders, it provides rapid context to assess whether the market is stretched or balanced. For swing traders, it offers a map of reaction zones across higher timeframes.

CHoCH Reversal Hunter🔥 CHoCH Reversal Hunter — Detect Bearish CHoCH Patterns & Fibonacci Golden Zone For Precision Reversal Setups
📈 Overview
CHoCH Reversal Hunter is a Pine Script™ indicator for structured bearish market analysis.
It combines major/minor pivot detection, Change of Character (CHoCH) filtering, and logarithmic Fibonacci retracements into one framework.
The goal: identify Small LL → CHoCH → Golden Zone setups with higher precision.
🧠 Core Logic
1. 📊 Market Structure Backbone
Tracks the 4 most recent major highs (H0–H3) and 3 major lows.
These pivots form the basis for trend evaluation.
2. 🔻 Bearish Background Conditions
A bearish market context is confirmed when:
// Bearish Background Condition
isBearish = (High 3 < High 2) and (
(High 2 > High 1 and High 2 < High 0) or
(High 2 <= High 1)
)
// Reset to neutral if High 2 < High 3
This ensures that only a true lower-high structure activates the bearish framework.
3. 🎯 Hunt for Small Lower Low (LL)
Monitors minor pivot lows with a smaller lookback period.
A valid Small LL must break below the third major low (Low 2).
This Small LL becomes the 0% Fibonacci anchor.
4. 🔄 Change of Character (CHoCH) Selection
The indicator scans recent bars for three possible CHoCH patterns:
// CHoCH Type Definitions in CHoCH Hunter
// Inside → current bar inside previous bar
isInsideBar = high < high and low > low
// Smarty → short-term reversal clue
isSmartyBar = low > low and low < low
// Pivot → minor swing high (small swing detection)
isSmallPivotHigh = ta.pivothigh(high, small_swing_period, small_swing_period)
Filter rules for validity:
CHoCH must occur before the Small LL bar.
Its high must be greater than the Small LL bar’s high (dominance criterion).
5. ⚡ Confirmation & Fibonacci Activation
Once price crosses above the selected CHoCH → setup confirmed.
Fibonacci retracements (logarithmic scale) are calculated:
100% → current high (dynamic, updates before breach).
65% → Golden Zone upper boundary.
50% → Golden Zone lower boundary.
0% → Small LL anchor.
6. 📈 Dynamic Management & Reset Rules
Before 50% breach → Fibo High auto-updates with new highs.
After breach → Levels freeze.
Setup resets if:
Price drops below Small LL.
Price breaks beyond frozen levels.
New Small LL formation detected.
✨ Key Features
📍 Automatic detection of major & minor pivots.
🔍 Clear definitions for Inside, Smarty, Pivot CHoCHs.
📐 Logarithmic Fibonacci retracements for exponential markets.
🎯 Golden Zone highlighting (50%–65%).
🔄 Built-in reset logic to invalidate weak setups.
🎨 Visualization
Pivot markers for Major (📕) & Minor (📘) swings.
Labels for CHoCH points with type (“Inside”, “Smarty”, “Pivot”).
Golden Zone highlighted between 50%–65%.
Optional structure labels for clarity.
⚙️ Inputs & Customization
Major Structure Period (default: 4) — sensitivity for big swings.
Minor Structure Period (default: 2) — sensitivity for small swings.
Toggle display of pivots, structure labels, and Golden Zone.
📚 Educational Value
CHoCH Reversal Hunter is designed to help traders learn:
How bearish structures are objectively defined.
Different CHoCH types and how to filter them.
Applying Fibonacci retracements in structured setups.
⚠️ Risk Disclaimer
🚨 This indicator is for educational purposes only and does not constitute financial advice.
Trading involves significant risk — always backtest and apply sound risk management.
🆕 Release Notes v1.0
Bearish structure detection logic added.
CHoCH type classification (Inside, Smarty, Pivot).
Logarithmic Fibonacci retracement with Golden Zone.
Automatic reset & invalidation rules.
💡 Pro Tip: Watch for the sequence Bearish Background → Small LL → CHoCH → Golden Zone — this is the core hunting pattern of CHoCH Reversal Hunter.

AI Fib Strategy (Full Trade Plan)This indicator automatically plots Fibonacci retracements and a Golden Zone box (61.8%–65% retracement) based on the 4H candle body high/low.
Features:
Auto-detects session breaks or daily breaks (configurable).
Draws standard Fib retracement levels (0%, 23.6%, 38.2%, 50%, 61.8%, 78.6%, 100%).
Highlights the Golden Zone for high-probability trade entries.
Optional Take Profit extensions (TP1, TP2, TP3).
Fully compatible with Pine Script v6.
Usage:
Best applied on intraday charts (15m, 30m, 1H).
Use the Golden Zone for entry confirmations.
Combine with candlestick patterns, order blocks, or volume for stronger signals.
