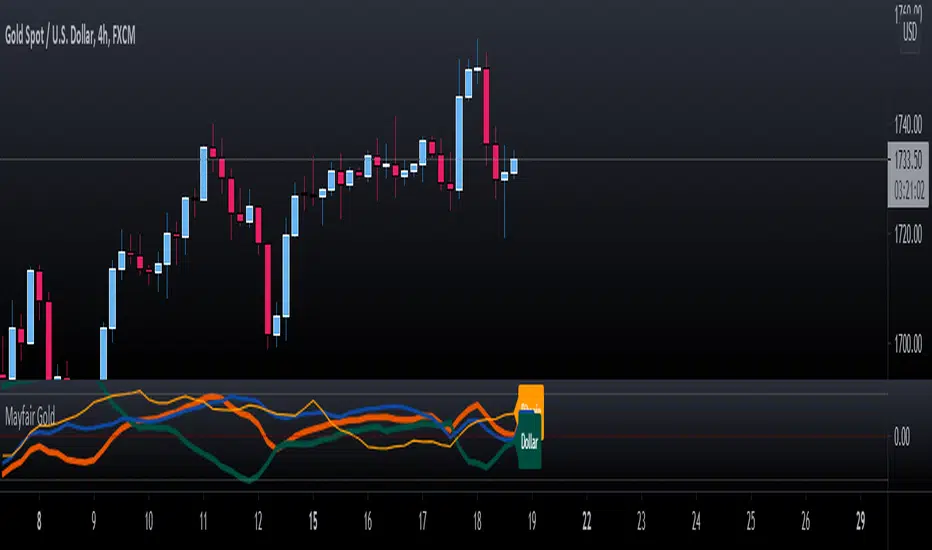
Mayfair GoldGold Oscillator using SPX & DXY to measure the moving average cross of the 3.
Gold in Orange
DXY in Green
SPX in Blue
To use this indicator, you need to see the strength (Orange above the 50%) line, use your own configurations and settings for the two MA's as a cross.
The idea is not to enter trades but to know when either SPX or/and DXY is getting stronger or weaker to help with profit-taking of gold positions.
As per any Oscillator - look for patterns, cross-overs and momentum shifts. (Treat like a MACD, RSI or Stochastic).
在腳本中搜尋"GOLD"
gold price levels denominated in usd/gramsPlots the gold price (USD) for the quantities (grams) identified as support or resistance in the indicator settings. Default values are:
75 gold grams
300 gold grams
500 gold grams
1000 gold grams
5000 gold grams
More context: The purchasing power of Bitcoin

Gold-Stocks RatioA historic risk-off flag.
When the Gold-Stocks Ratio is above the 200 week moving average, investors may fair better holding gold and avoiding equities, as was the case for the last 20 years.

Gold/Silver 30m Only Strategy Buy/Sell SignalsIn my free time I felt like coding this strategy, and after backtesting it, it appears that the 30m time frame is the most profitable.
I only have been working on it for gold, but it should work similarly for silver as well.
This includes no pyramiding, and with pyramiding orders of 5, this strategy is upwards of 100% profitable.
Buy order - when price is above the 162 day EMA and RSI is less than 35
Sell order - when price is below the 162 day EMA and RSI is greater than 65
I will probably be adjusting it to increase the profitability and %success rate.

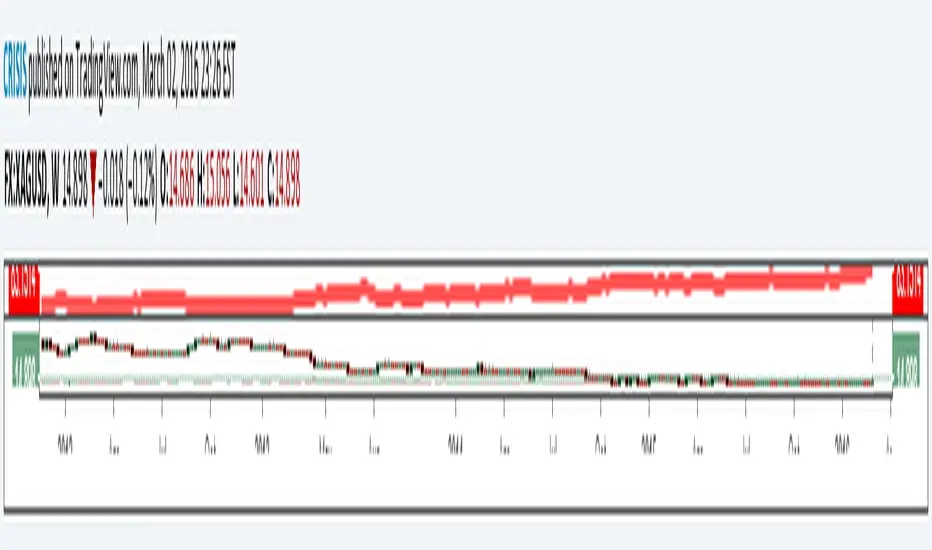
[RS]Gold to Custom Currency V0Request for: sankar2389
Gold conversion from dollar to INR and to grams.
MATA GOLD RATIOMata Gold Instrument: User Guide
The Instrument to Gold Oscillator is a technical analysis tool that normalizes the ratio of an instrument's price (e.g., BTC/USD) to the price of gold (XAU/USD) into a 0-100 scale. This provides a clear and intuitive way to evaluate the relative performance of an instrument compared to gold over a specified period.
---
How It Works
1. Calculation of the Ratio:
The ratio is calculated as:
\text{Ratio} = \frac{\text{Instrument Price}}{\text{Gold Price}}
2. Normalization:
The ratio is normalized using the highest and lowest values over a user-defined period (length), typically 14 periods:
\text{Normalized Ratio} = \frac{\text{Ratio} - \text{Min(Ratio)}}{\text{Max(Ratio)} - \text{Min(Ratio)}} \times 100
3. Overbought/Oversold Levels:
Above 80: The instrument is relatively expensive compared to gold (overbought).
Below 20: The instrument is relatively cheap compared to gold (oversold).
---
How to Use the Oscillator
1. Identify Overbought and Oversold Levels:
If the oscillator rises above 80, the instrument may be overvalued relative to gold. This could signal a potential reversal or correction.
If the oscillator falls below 20, the instrument may be undervalued relative to gold. This could signal a buying opportunity.
2. Track Trends:
Rising oscillator values indicate the instrument is gaining value relative to gold.
Falling oscillator values indicate the instrument is losing value relative to gold.
3. Crossing the Midline (50):
When the oscillator crosses above 50, the instrument's value is gaining strength relative to gold.
When it crosses below 50, the instrument is weakening relative to gold.
4. Combine with Other Indicators:
Use this oscillator alongside other technical indicators (e.g., RSI, MACD, STOCH) for more robust decision-making.
Confirm signals from the oscillator with price action or volume analysis.
---
Example Scenarios
1. Trading Cryptocurrencies Against Gold:
If BTC/USD's oscillator value is above 80, Bitcoin may be overvalued relative to gold. Consider reducing exposure or looking for short opportunities.
If BTC/USD's oscillator value is below 20, Bitcoin may be undervalued relative to gold. This could be a good time to accumulate.
2. Commodities vs. Gold:
Analyze the relative strength of commodities (e.g., oil, silver) against gold using the oscillator to identify periods of overperformance or underperformance.
---
Advantages of the Oscillator
Relative Performance Insight: Tracks the performance of an instrument relative to gold, providing a macro perspective.
Clear Visual Representation: The 0-100 scale makes it easy to identify overbought/oversold conditions and trend shifts.
Customizable Periods: The user-defined length allows flexibility in analyzing short- or long-term trends.
---
Limitations
Dependence on Gold: As the oscillator is based on gold prices, any external shocks to gold (e.g., geopolitical events) can influence its signals.
No Absolute Buy/Sell Signals: The oscillator should not be used in isolation but as part of a broader analysis strategy.
---
By using the Instrument to Gold Oscillator effectively, traders and investors can gain valuable insights into the relative valuation and performance of assets compared to gold, enabling more informed trading and investment decisions.

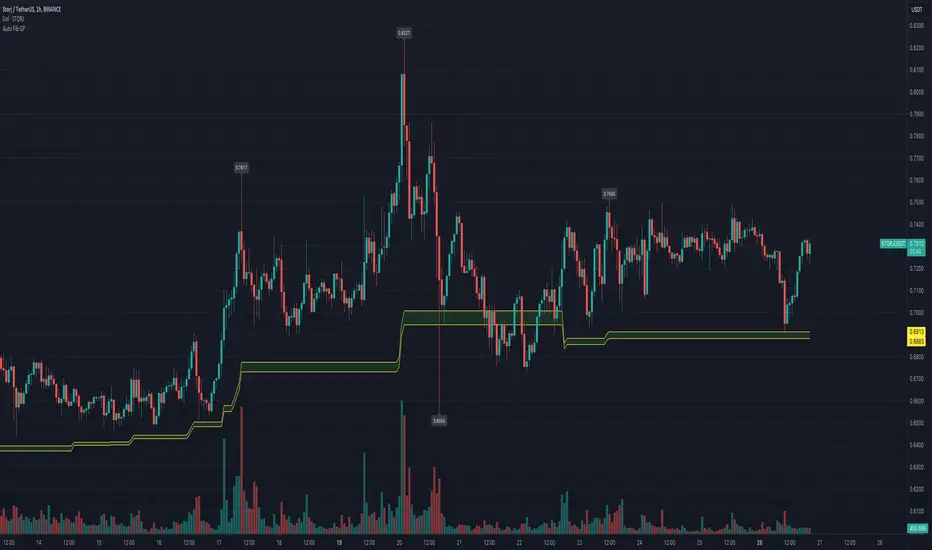
Automatic Fibonacci Retracement Golden Pocket (GP)Main info
This script automatically draws you the Fibonacci retracement level called golden pocket from the latest detected pivot point to the actual price. This level is very popular among traders because the price tends to reverse on this level pretty often. You should use this on higher timeframes 15m+.
It is good to keep in mind that this level alone is not enough, you should still have another level there to enter the trade, for example golden pocket in combination with a demand zone is pretty solid. :)
Settings
The length for pivot point calculation is available in the script settings.
You can enable inverted golden pocket (for shorts)
You can hide/show the pivot point labels
If you want any updates, just feel free to write me :)
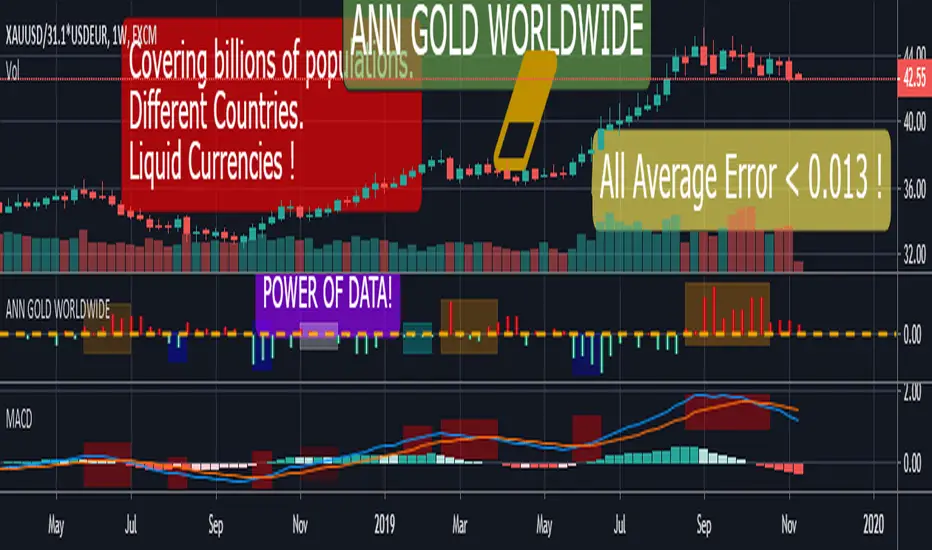
ANN GOLD WORLDWIDE This script consists of converting the value of 1 gram and / or 1 ounce of gold according to the national currencies into a system with artificial neural networks.
Why did I feel such a need?
Even though the printed products in the market are digitally circulated, only precious metals are available in full or near full.
Silver is difficult to carry because you have to buy too much because the unit price is low.
Platinum is very difficult to find and used in industry.
Gold is both practical and has less volatile movements, even more balanced than dollars, to preserve the value of money.
Uncertainty and tensions benefit gold.
Obviously this is my own opinion and is not worth the investment advice:
If there is to be an economic crisis, it is obvious that the dollar will rise against the emerging currencies, but I expect a crisis where gold and the dollar will rise together.
The world has been on a mercantilist line more than ever!
Spot gold can be bought from goldsmiths and banks.
I think this command will benefit people everywhere but in economies that are subject to developing currencies.
Now we can look at the details:
All you have to do is load the appropriate chart and select it from the menu.
Thus, the system will adjust itself to that instrument.
MENU and Tickers :
"GOLD" : XAUUSD or GC1! or GOLD (Average error = 0.0128)
"GOLDSILVER" : XAUXAG or GOLDSILVER (Gold Silver Ratio ) ( Average error : 0.01 )
"GOLD CZK " : XAUUSD/USDCZK ( 1 Ounce Gold Czech Koruna) ( Average error = 0.010879 )
"GOLD NZD " : XAUUSD/USDNZD ( 1 Ounce Gold New Zealand Dollar ) (Average error = 0.010736 )
"GOLD EURO" : XAUUSD/USDEUR ( 1 Ounce Gold Euro) ( Average error = 0.010000 )
"GOLD HUF " : XAUUSD/USDHUF ( 1 Ounce Gold Hungarian Forint ) ( Average error = 0.010000 )
"GOLD INR " : XAUUSD/USDINR (1 Ounce Gold Indian Rupee ) (Average error = 0.010458 )
"GOLD DKK" : XAUUSD/USDDKK (1 Ounce Gold Danish Krone) (Average error = 0.010671 )
"GOLD CHF" : XAUUSD/USDCHF (1 Ounce Gold Swiss Franc ) (Average error = 0.010967 )
"GOLD CNH" : XAUUSD/USDCNH(1 Ounce Gold Offshore RMB) (Average error = 0.012017 )
"GOLD MXN" : XAUUSD/USDMXN(1 Ounce Gold Mexican Peso) (Average error = 0.010000 )
"GOLD PLN" : XAUUSD/USDPLN (1 Ounce Gold Polish Zloty ) (Average error = 0.010173 )
"GOLD ZAR" : XAUUSD/USDZAR (1 Ounce Gold South African Rand (Average error = 0.010484 )
"GOLD NOK" : XAUUSD/USDNOK (1 Ounce Gold Norwegian Krone ) (Average error = 0.010842 )
"GOLD TRY" : XAUUSD/USDTRY (1 Ounce Gold Turkish Lira ) (Average error = 0.010000 )
"GOLD THB" : XAUUSD/USDTHB (1 Ounce Gold Thai Baht ) (Average error = 0.011747 )
Important note : XAUUSD/USDCUR = 1 Ounce Gold , XAUUSD/31.1*USDCUR = 1 gram Gold (CUR = Currency )
If you want to physically hold it, look gram value, because as far as I know, all goldsmiths and jewelleries in the world are selling gram gold.
I think that this command is the most useful and the concrete one that I have ever written.
I end my sentences with this anonymous proverb :
"Even if gold falls into the mud, it's still gold ! "
Fibonacci Retracement (S)-GoldThe Automatic Fib Retracement-Gold script indicates the 38.2%, 50%, 61.8% and 65% pullback regions.
The lines of the upper and lower pivots , the support and resistance areas are also highlighted as well as the Golden Pocket.
Customisable Fib Length - Time period over which max and min pivots are chosen.
Offsetfib - Automatically offsets the pivots and sell zone as your entry position
will be some time after the upper and lower pivots are set.
Works well when used in combination with an oscillator which highlights Divergence.
A strategy based off buying the 50-618 with a defined stop loss the other side of the 65 can easily be formulated. This tool will automatically plot those points but a defined Risk Management strategy will always be needed.
The 382 region can also be plotted, allowing for lesser retracements coinciding with wave 4 pullbacks (Elliott Wave Traders).
Works best in Bearish trends but will work on all timeframes ( Bearish correction in an uptrend also possible).
Previous pivots shown but be careful to identify which of the several pivots you are using.
Start at a larger timeframe and move down. (Entries consistent on several timeframes are golden)
Pivots and retracements are dynamic. Be sure to note your entry and targets.

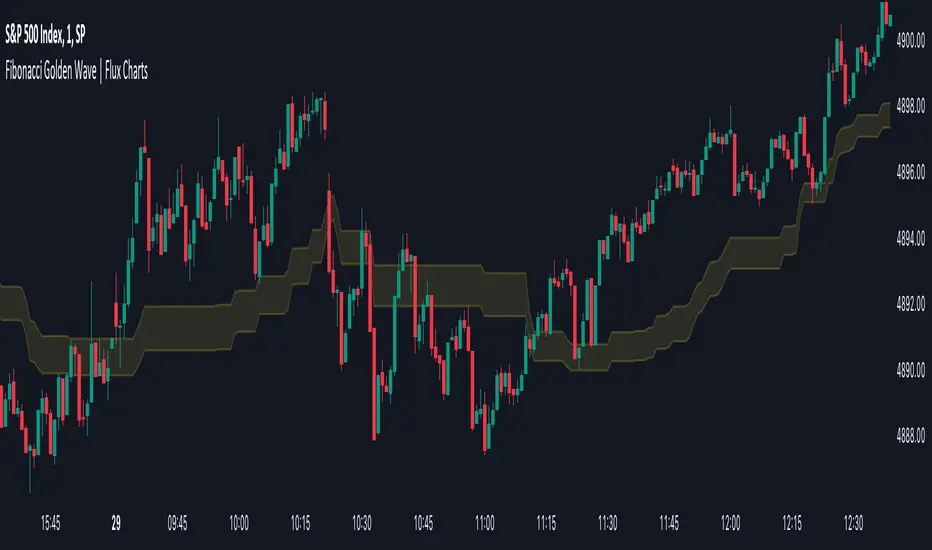
Fibonacci Golden Wave | Flux Charts💎 GENERAL OVERVIEW
Introducing the new Fibonacci Golden Wave indicator! This indicator plots the Fibonacci golden zone from the last highs / lows instead of the pivots so that the resulting zone is shaped like a "wave". We believe this will help you to see the latest trend of the Fibonacci retracement levels easier. For more information of the working progress of the indicator, check the "How Does It Work" section of the description.
Features of the new Fibonacci Golden Wave Indicator :
Plots Fibonacci Golden Zone Based On Highs / Lows
A Different Approach To Fibonacci Retracement Levels
Customizable Swing Range & Retracement Levels
Customizable Visuals
🚩UNIQUENESS
The Fibonacci Golden Zone is a widely used concept in trading. To achieve the golden zone, the Fibonacci retracement levels are generally placed between pivot high / lows, resulting in a rectangular zone. However, this indicator will place the Fibonacci retracement levels between the last highest / lowest points going back from the current bar, resulting in a "wave" shape. This will help traders understand the latest trend of the Fibonacci golden zone. The ability to change the Fibonacci retracement levels to your liking in the settings is another unique function of this indicator.
📌 HOW DOES IT WORK ?
To calculate the Fibonacci wave, first of all we need to place a line at the lowest low and the highest high of the last 20 bars (can be changed from the settings)
Then, Fibonacci retracement levels are placed between those lines.
For the next step, put two points in the (1.0 - 0.618) = 0.382 and (1.0 - 0.5) = 0.5 (can be changed from the settings) levels of the Fibonacci retracement.
Repeat this step for each bar in the chart, then connect all the points.
Instead of a pivot approach to the Fibonacci retracement levels, this approach will not need a new pivot point to form before calculating the new Fibonacci golden zone, thus indicating the latest trend of the current golden zone.
🚨HOW YOU CAN USE THIS INDICATOR
Fibonacci retracement tool is typically used to find entries after a pullback in an uptrend or downtrend. The Fibonacci Golden Wave can be used in the same way. It can be used to find entries after markets retrace. In this example, the Fibonacci Golden Wave is able to catch 2 pullback opportunities to enter long in the market with the trend.
⚙️SETTINGS
1. General Configuration
Swing Range -> This setting determines how the highest high / lowest low levels are calculated. This essentially means that the script will look back X bars before the current bar in calculation to find the highest / lowest wick points.
2. Golden Zone
Here you can select which range of the Fibonacci retracement levels should be considered as the golden zone. The default value is 0.5 - 0.618.
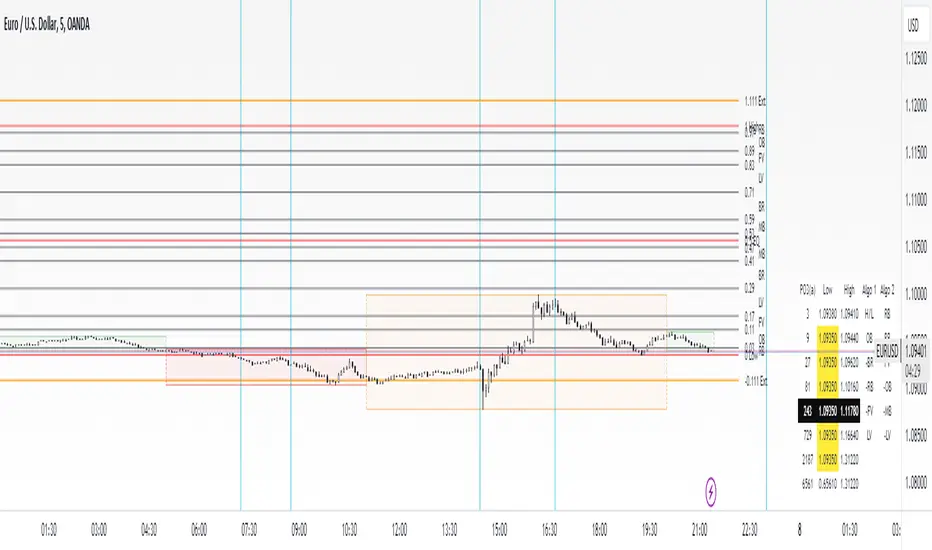
dmn's ICT AMD-Goldbach█ OVERVIEW
This script is built on ICT time & price theory and the theory of algorithmic market maker models, and visualizes the intraday divided using powers of three into accumulation, manipulation and distribution cycles.
It also includes an automatically calculated and plotted Goldbach level (a.k.a. IPDA level or Huddleston level) overlay, to help visualize where in the current market maker profile price is in relation to the AMD cycles, and where it might trade to.
█ CONCEPTS
Accumulation, Manipulation, Distribution Cycles
A 24 hour day, with the default set to start at 20:00 CET (the start of the Forex CLS Settlement operational timeline) is split in three parts - 9, 6 and 9 hours for the three cycles (roughly corresponding with Asia, London Open and New York + London Close sessions).
Since charts are fractals, there's also intra-cycle time fibs available in the script, to highlight the smaller fractal equivalents in each cycle.
These cycles are used to visualize the three phases (AMD) for easier identification of the current daily profile by analyzing during what cycle highs and lows of the day are made.
An example of a bullish day could be price rallying before making a low during the accumulation cycle, being manipulated higher and retracing to form an optimal trade entry during the manipulation cycle, expanding and creating the high of the day before selling off during the distribution cycle, with a potential reversal before it ends.
Goldbach levels
The Goldbach levels are based on the size of a price range (or price swing, if you will) expressed as a factor of power of three (3^n).
To decide what number to tell the script to use for the calculation, we look at what 3^n number best fits an average swing on the preferred timeframe we're trading.
For example; PO3 27 (3^3)might be fit for scalping, while PO3 243 (3^5) may correspond to the daily or weekly range, depending on the asset.
The script then calculates a range high and a range low using a power of three formula based on the current price and divides it into levels using Goldbach numbers.
At these levels one might expect to see price form various "blocks" as defined in concept by Michael J. Huddleston.
The blocks that correspond to the Goldbach levels are labeled with abbreviations as follows:
Ext = External range
Low = Range low
High = Range high
FVG = Fair value gap
RB = Rejection block
OB = Order block
LV = Liquidity void
BR = Breaker
MB = Mitigation block
Using these levels and said blocks we identify where in the current running market maker profile price is offered, and trade the preferred timeframe in line with the AMD cycles accordingly.
█ FEATURES
Custom AMD time cycles session times.
Custom time fib for fractal cycles.
Color and style customization.
Show only current or also historical cycles.
Equilibrium mode for Goldbach levels (show only high/low and midpoint)
Autodetection of asset type, with manual override.
█ NOTE
The default timings for the AMD cycles are set up for Forex pairs. For other asset types, such as indices, other timings are nessecary for optimal results.
Goldbach levels requires the correct symbol type setting for the calculation to work properly. Disable the script's autodetection and enable/disable the Forex option according to the type of chart if it fails.
Golden Duck Runner With TargetsGolden Duck Runner With Targets - Advanced EMA Pullback Strategy with Dynamic Risk Management
The "Golden Duck Runner With Targets" is a sophisticated technical analysis indicator designed for active traders seeking precise entry and exit points in fast-moving markets. This indicator combines dual EMA trend analysis with pullback detection and implements a comprehensive risk management system based on candle size calculations with automatic position cleanup functionality.
Key Features
Dual EMA System
- Fast EMA (18-period): Golden line (linewidth=2) that tracks short-term price momentum
- Trend Filter EMA (111-period): Extra thick line (linewidth=4) for major trend identification
- Blue: Bullish trend (Fast EMA > Slow EMA)
- Red: Bearish trend (Fast EMA < Slow EMA)
Advanced Signal Generation
The indicator employs a sophisticated pullback detection algorithm that ensures high-probability entries:
Long Signal Requirements:
- Market must be in uptrend (18 EMA > 111 EMA)
- Price must pull back below the 18 EMA while staying above the 111 EMA
- Price must then close back above the 18 EMA with bullish momentum
- No duplicate signals until position is closed
Short Signal Requirements:
- Market must be in downtrend (18 EMA < 111 EMA)
- Price must pull back above the 18 EMA while staying below the 111 EMA
- Price must then close back below the 18 EMA with bearish momentum
- No duplicate signals until position is closed
This methodology ensures traders enter positions only after proper trend confirmation and healthy pullback completion. Dynamic Risk Management System
Unlike static risk management approaches, this indicator calculates Stop Loss and Take Profit levels based on the actual volatility of the entry candle, providing adaptive risk management:
Risk Levels (Based on Entry Candle Size):
- Stop Loss: 2x entry candle size (providing adequate breathing room)
- Take Profit 1: 3x entry candle size (1.5:1 reward-to-risk ratio)
- Take Profit 2: 5x entry candle size (2.5:1 reward-to-risk ratio)
- Take Profit 3: 8x entry candle size (4:1 reward-to-risk ratio)
Automatic Position Management
Clean Chart Technology:
- Positions automatically close when TP3 or Stop Loss levels are hit
- All risk management lines are automatically removed upon trade completion
- Charts remain clean and focused on active opportunities only
- Maximum holding period of 20 bars prevents stale signals
Visual Elements
- Golden Entry Level: Clearly marks your exact entry price
- Color-Coded Risk Lines: Dark red for stop loss, blue for take profits
- Golden Arrow Signals: Easy-to-spot entry points with BUY/SELL labels
- Entry Candle Highlighting: Gold-colored candles mark signal bars
- Information Dashboard: Real-time display of trend direction, position status, entry price, and bars held
- Professional Color Scheme: Consistent golden theme throughout
Trading Applications
Best Suited For:
- Scalping: Short-term trades in liquid markets (1-5 minute charts)
- Day Trading: Intraday momentum plays (15-minute to 1-hour charts)
- Swing Trading: Multi-day position holding (4-hour to daily charts)
- Forex Markets: Major currency pairs with good liquidity
- Stock Trading: High-volume equities and indices
- Cryptocurrency: Bitcoin, Ethereum, and major altcoins
- Commodities: Gold, Silver, Oil, and other liquid futures
Optimal Market Conditions:
- Trending Markets: Works best when clear trend direction is established
- Moderate Volatility: Candle-based risk management adapts to market conditions
- Liquid Markets: Ensures accurate execution at calculated levels
- Session Overlaps: Forex majors during London/New York overlap
- News-Driven Moves: Captures momentum after fundamental catalysts
Risk Management Philosophy
This indicator implements a position sizing approach that adapts to market volatility through several key principles:
Adaptive Risk Calculation:
- Risk levels scale with actual market volatility (candle size)
- Larger candles = wider stops and targets
- Smaller candles = tighter risk management
- Maintains consistent risk-reward ratios across all market conditions
Professional Exit Strategy:
- Multiple take profit levels allow for position scaling
- Automatic cleanup prevents chart clutter
- Real-time monitoring of all risk levels
- Maximum 20-bar holding period prevents overholding
Market-Neutral Approach:
- Works equally well in bull and bear markets
- Trend-following methodology captures major moves
- Pullback timing ensures favorable entry prices
Usage Instructions
Setup Phase:
1. Apply to Chart: Add indicator to your preferred timeframe
2. Verify Settings: Confirm EMA periods (18 and 111) suit your style
3. Enable Alerts: Set up TradingView alerts for entry signals
4. Plan Position Size: Determine risk per trade before signals appear
Signal Identification:
1. Trend Confirmation: Monitor EMA colors and positioning
- Bullish Setup: 18 EMA (golden) above 111 EMA (blue)
- Bearish Setup: 18 EMA (golden) below 111 EMA (red)
2. Wait for Pullback: Price must retrace to 18 EMA level
- Long: Price pulls back below 18 EMA but stays above 111 EMA
- Short: Price pulls back above 18 EMA but stays below 111 EMA
3. Entry Confirmation: Golden arrow appears when conditions are met
- BUY signal: Price closes back above 18 EMA with momentum
- SELL signal: Price closes back below 18 EMA with momentum
Position Management:
1. Entry Execution: Enter trade at signal candle close price
2. Risk Placement: Use provided stop loss level (dark red line)
3. Profit Taking: Scale out at blue TP levels (TP1: 3x, TP2: 5x, TP3: 8x)
4. Position Monitoring: Watch dashboard for trade status and duration
Exit Management:
- Automatic Cleanup: Lines disappear when TP3 or SL is hit
- Time Exit: Position closes after 20 bars if targets not reached
- Manual Override: Traders can exit earlier based on discretion
Advanced Features
Pullback Quality Control
The indicator uses sophisticated logic to ensure only high-quality setups:
- Trend Structure Validation: Pullbacks must respect major trend EMAs
- Momentum Confirmation: Requires decisive close through 18 EMA
- No Whipsaw Protection: Prevents signals during choppy conditions
- Duplicate Prevention: Only one signal per trend move
Real-Time Monitoring System
- Live Position Tracking: Dashboard shows current status
- Automatic Level Updates: Lines adjust to current bar position
- Alert Integration: Built-in notifications for all signal types
- Performance Metrics: Entry price and duration tracking
Customization Options
Display Controls:
- Toggle Fast EMA visibility
- Toggle Trend Filter EMA visibility
- Enable/disable signal arrows
- Show/hide information dashboard
Parameter Adjustment:
- Modify Fast EMA period (default: 18)
- Adjust Trend Filter EMA period (default: 111)
- Customize alert messages
Market Analysis Benefits
Trend Following Advantage:
- Captures major directional moves early
- Avoids counter-trend trades in strong markets
- Adapts to changing market conditions automatically
Timing Optimization:
- Enters after healthy pullbacks for better prices
- Avoids chasing momentum at extremes
- Provides multiple profit-taking opportunities
Risk Control:
- Volatility-adjusted stop losses prevent random exits
- Excellent risk-reward ratios (up to 4:1)
- Automatic position management reduces emotional decisions
Educational Value
This indicator serves as an excellent learning tool for understanding:
Technical Analysis Concepts:
- EMA crossover strategies and trend identification
- Pullback trading methodology and timing
- Support and resistance level recognition
- Momentum confirmation techniques
Risk Management Principles:
- Position sizing based on market volatility
- Multiple take profit level strategies
- Stop loss placement using market structure
- Time-based exit rules
Trading Psychology:
- Systematic approach reduces emotional trading
- Clear rules for entry and exit decisions
- Patience waiting for quality setups
- Disciplined risk management practices
Performance Optimization Tips
Timeframe Selection:
- Lower Timeframes (1-15m): More signals, requires faster execution
- Higher Timeframes (1h-4h): Fewer but higher quality signals
- Daily Charts: Swing trading with excellent risk-reward ratios
Market Selection:
- High Liquidity: Ensures accurate execution at calculated levels
- Trending Assets: Maximizes strategy effectiveness
- Volatile Periods: Provides larger profit targets
- Session Timing: Trade during active market hours
Risk Management:
- Never risk more than 1-2% of account per trade
- Use position sizing that allows for multiple concurrent trades
- Consider correlation between instruments when trading multiple markets
- Maintain trading journal to track performance
Backtesting and Validation
Historical Performance Analysis:
Users are encouraged to conduct thorough backtesting across different:
- Market conditions (trending vs. ranging)
- Volatility environments (high vs. low)
- Time periods (various years and seasons)
- Asset classes (forex, stocks, crypto, commodities)
Forward Testing Recommendations:
- Start with paper trading to understand signal timing
- Use small position sizes during learning phase
- Track all trades for performance analysis
- Gradually increase position size as confidence builds
Technical Specifications
Pine Script Details:
- Version: Pine Script v5
- Chart Type: Overlay indicator
- Resource Limits: max_lines_count=500, max_labels_count=500
- Repainting: Non-repainting signals (confirmed on bar close)
- Real-time Updates: Yes, with live dashboard
- Alert Compatibility: Full TradingView alert support
System Requirements:
- TradingView account (Basic or higher recommended)
- Stable internet connection for real-time data
- Compatible with all TradingView supported markets
- Works on desktop, mobile, and web platforms
Disclaimer and Risk Warning
IMPORTANT: This indicator is designed for educational and analytical purposes only.
Risk Acknowledgment:
- No Guarantee of Profits: Past performance does not predict future results
- Substantial Risk of Loss: Trading involves risk and is not suitable for all investors
- Market Volatility: Cryptocurrency and forex markets can be extremely volatile
- Technical Analysis Limitations: No indicator is 100% accurate
- Leverage Warning: Using leverage amplifies both profits and losses
User Responsibilities:
- Personal Research: Always conduct independent analysis
- Risk Assessment: Only trade with money you can afford to lose
- Position Sizing: Use appropriate risk management for your account size
- Market Knowledge: Understand the markets you're trading
- Professional Advice: Consult financial advisors when needed
Legal Disclaimer:
- This tool provides analysis, not investment advice
- Users are solely responsible for trading decisions
- No warranty is provided regarding accuracy or profitability
- Historical results do not guarantee future performance
- Seek professional guidance for investment decisions
Support and Development
Continuous Improvement:
This indicator is actively maintained and updated to ensure:
- Compatibility with TradingView platform changes
- Bug fixes and performance optimizations
- Feature enhancements based on user feedback
- Documentation updates and educational content
Conclusion
The "Golden Duck Runner With Targets" represents a comprehensive approach to technical analysis that combines trend following, pullback timing, and adaptive risk management. Its automatic cleanup functionality and professional visual design make it suitable for traders of all experience levels who demand precision and reliability in their analytical tools.
By focusing on high-probability setups with excellent risk-reward ratios, this indicator helps traders develop disciplined trading habits while providing the flexibility to adapt to various market conditions and trading styles.
Remember: Successful trading requires patience, discipline, and continuous learning. This tool provides the analysis - the trading decisions and their consequences remain entirely with the user.
Developed for serious traders who demand precision, reliability, and professional-grade risk management with clean, clutter-free chart visualization.

Precision Trading Strategy: Golden EdgeThe PTS: Golden Edge strategy is designed for scalping Gold (XAU/USD) on lower timeframes, such as the 1-minute chart. It captures high-probability trade setups by aligning with strong trends and momentum, while filtering out low-quality trades during consolidation or low-volatility periods.
The strategy uses a combination of technical indicators to identify optimal entry points:
1. Exponential Moving Averages (EMAs): A fast EMA (3-period) and a slow EMA (33-period) are used to detect short-term trend reversals via crossover signals.
2. Hull Moving Average (HMA): A 66-period HMA acts as a higher-timeframe trend filter to ensure trades align with the overall market direction.
3. Relative Strength Index (RSI): A 12-period RSI identifies momentum. The strategy requires RSI > 55 for long trades and RSI < 45 for short trades, ensuring entries are backed by strong buying or selling pressure.
4. Average True Range (ATR): A 14-period ATR ensures trades occur only during volatile conditions, avoiding choppy or low-movement markets.
By combining these tools, the PTS: Golden Edge strategy creates a precise framework for scalping and offers a systematic approach to capitalize on Gold’s price movements efficiently.

Marcel's Dynamic Profit / Loss Calculator for GoldOverview
This Dynamic Risk / Reward Tool for Gold is designed to help traders efficiently plan and manage their trades in the volatile gold market. This script provides a clear visualisation of trade levels (Entry, Stop Loss, Take Profit) while dynamically calculating potential profit and loss. It ensures gold traders can assess their positions with precision, saving time and improving risk management.
Key Features
1. Trade Level Visualisation:
Plots Entry (Blue), Stop Loss (Red), and Take Profit (Green) lines directly on the chart.
Helps you visualise and confirm trade setups quickly which is good for scalping and day trades.
2. Dynamic Risk and Reward Calculations:
Calculates potential profit and loss in real time based on user-defined inputs such as position size, leverage, and account equity.
Displays a summary panel showing risk/reward metrics directly on the chart.
3. Customisable Settings:
Allows you to adjust key parameters like account equity, position size, leverage, and specific price levels for Entry, Stop Loss, and Take Profit.
Defaults are dynamically generated for convenience but remain fully adjustable for flexibility.
How It Works
The script uses gold-specific conventions (e.g., 1 lot = 100 ounces, 1 pip = 0.01 price change) to calculate accurate risk and reward metrics.
It dynamically positions Stop Loss and Take Profit levels relative to the entry price, based on user-defined or default offsets.
A real-time summary panel is displayed in the bottom-right corner of the chart, showing:
Potential Profit: The monetary value if the Take Profit is hit.
Potential Lo
ss: The monetary value if the Stop Loss is hit.
How to Use It
1. Add the script to your chart on a gold trading pair (e.g., XAUUSD).
2. Input your:
Account equity.
Leverage.
Position size (in lots).
Desired En
try Price (default: current close price).
3. Adjust the Stop Loss and Take Profit levels to your strategy, or let the script use default offsets of:
500 pips below the Entry for Stop Loss.
1000 pips above the Entry for Take Profit.
4. Review the plotted levels and the summary panel to confirm your trade aligns with your risk/reward goals.
Why Use This Tool?
Clarity and Precision:
Provides clear trade visuals and financial metrics for confident decision-making.
Time-Saving:
Automates the calculations needed to evaluate trade risk and reward.
Improved Risk Management:
Ensures you never trade without knowing your exact potential loss and gain.
This script is particularly useful for both novice and experienced traders looking to enhance their risk management and trading discipline in the Gold market. Enjoy clearer trades at speed.

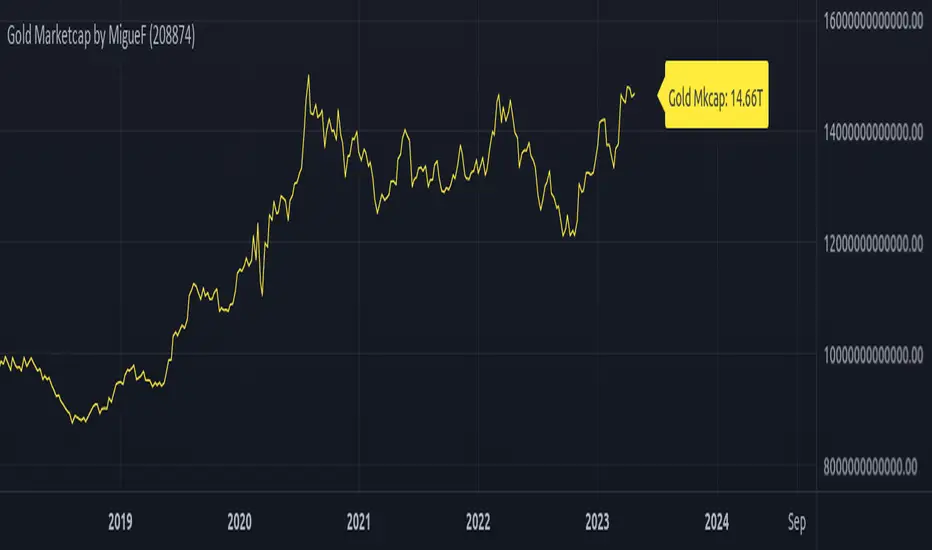
Total Gold Market Capitalization by MigueFinanceThis is the Current Market Capitalization and Historical Chart of Gold
There might be discrepancies in the future in the current market cap of gold due to the number of gold ever mined which is always increasing, so as to update it when necessary, you can go and check the site: "https://www.gold.org/goldhub/data/how-much-gold" and edit the amount of tonnes on the settings of this indicator
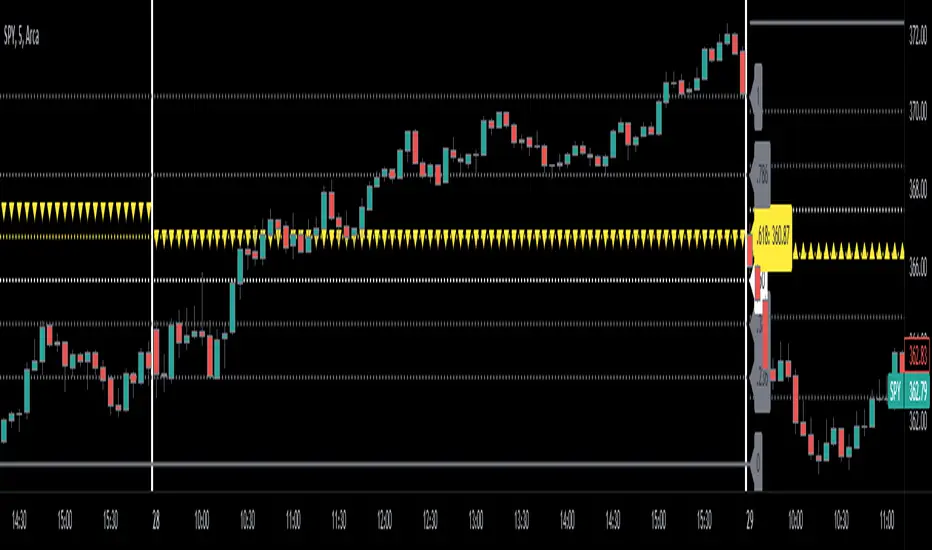
Automatic Fibonacci Retracement + Golden Ratio | by Octopu$👑 Automatic Fibonacci Retracement on Specific Timeframes + Golden Ratio | by Octopu$
Fibonacci Retracement is a method of technical analysis for determining support and resistance levels.
It is named after the famous Fibonacci sequence of numbers: 23.6%, 38.2%, 61.8%, and 78.6%
These ratios provide price levels to which markets tend to retrace a portion of a move.
Also used as a potential spot before a trend continues (or reverses) original direction.
While not officially a Fibonacci ratio, 50% is also used.
Fibonacci Levels can be drawn between any two significant price points or time frames.
(Such as a High and a Low or also on Daily and Weekly charts)
The indicator will then Automatically create the levels between those selected points.
Golden ratio, also known as the divine proportion, in mathematics, is the irrational number:
(1 + Square root of√5)/2, often denoted by the Greek letter ϕ or τ
Which is approximately equal to 1.618.
(Two quantities are in the golden ratio if their ratio is the same as the ratio of their sum to the larger of the two quantities.)
That's The Magic of the Fibonaccis, as well the Golden Ratio itself.
And this is exactly where this Indicator by Octopu$ kicks in:
This indicator Automatically sets all the Fibonacci Levels within the Retracement selected.
On top of that, it Highlights the Golden Ratio for the Fibonacci Levels drawn.
Additionally, it sets the Golden Ratio as possible Support or Resistance level,
Doing so by having visual identification to the Up or Down side.
This changes the game! Along with Price Action, Trend Direction, Chart Analysis and other Indicators as well.
(The combination relies on your own knowledge about Confluence Factors along with your Due Diligence)
www.tradingview.com
SPY
ANY Ticker. ANY Timeframe.
(SPY 5m as an example only)
Features:
• Multiple Timeframes
• Automatic Lines
• Fibonacci Setup
• Golden Ratio
• S/R Highlight
Options:
• Timeframe Selection
• Fibonacci Rates
• Line Customization
• Color Pickers
• Toggle On/Off
Notes:
v1.0
Indicator release.
Changes and updates can come in the future for additional functionalities or per requests. Follow and Stay Tuned!
Did you like it? Please Support and Shoot me a message! I'd appreciate if you dropped by to say thanks! Thank you.
- Octopu$
🐙
Bitcoin Golden Pi CyclesTops are signaled by the fast top MA crossing above the slow top MA, and bottoms are signaled by the slow bottom MA crossing above the fast bottom MA. Alerts can be set on top and bottom prints. Does not repaint.
Similar to the work of Philip Swift regarding the Bitcoin Pi Cycle Top, I’ve recently come across a similar mathematically curious ratio that corresponds to Bitcoin cycle bottoms. This ratio was extracted from skirmantas’ Bitcoin Super Cycle indicator . Cycle bottoms are signaled when the 700D SMA crosses above the 137D SMA (because this indicator is closed source, these moving averages were reverse-engineered). Such crossings have historically coincided with the January 2015 and December 2018 bottoms. Also, although yet to be confirmed as a bottom, a cross occurred June 19, 2022 (two days prior to this article)
The original pi cycle uses the doubled 350D SMA and the 111D SMA . As pointed out this gives the original pi cycle top ratio:
350/111 = 3.1532 ≈ π
Also, as noted by Swift, 111 is the best integer for dividing 350 to approximate π. What is mathematically interesting about skirmanta’s ratio?
700/138 = 5.1095
After playing around with this for a while I realized that 5.11 is very close to the product of the two most numerologically significant geometrical constants, π and the golden ratio, ϕ:
πϕ = 5.0832
However, 138 turns out to be the best integer denominator to approximate πϕ:
700/138 = 5.0725 ≈ πϕ
This is what I’ve dubbed the Bitcoin Golden Pi Bottom Ratio.
In the spirit of numerology I must mention that 137 does have some things going for it: it’s a prime number and is very famously almost exactly the reciprocal of the fine structure constant (α is within 0.03% of 1/137).
Now why 350 and 700 and not say 360 and 720? After all, 360 is obviously much more numerologically significant than 350, which is proven by the fact that 360 has its own wikipedia page, and 350 does not! Using 360/115 and 720/142, which are also approximations of π and πϕ respectively, this also calls cycle tops and bottoms.
There are infinitely many such ratios that could work to approximate π and πϕ (although there are a finite number whose daily moving averages are defined). Further analysis is needed to find the range(s) of numerators (the numerator determines the denominator when maintaining the ratio) that correctly produce bottom and top signals.

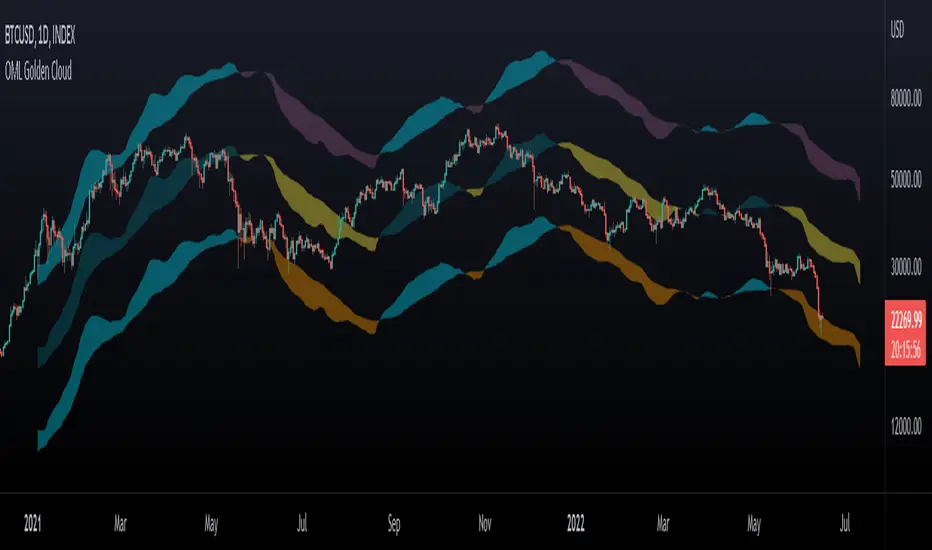
OhManLan Golden CloudThis indicator is a modification of the popular Ichimoku indicator, build high/low channels using the Golden Ratio, Volume-weighted average price allows smoother components.
high/low channels moves based on Fibo Levels (Golden Ratio: 1.618).
- Settings -
The indicator can be adjusted to your needs.
- How to use -
OhManLan Golden can be used a Support/Resistance , Stop loss, Trailing stop and Price target.
Volume-weighted average price allows smoother components.
Can be used with other indicators such as Moving Average Convergence Divergence (MACD).
KayipAdisyon - ATH / ATL - EMA - Golden / Death Cross - RSI50-167-200 EMA , ATH/ATL information widget, Golden & Death Cross lines and RSI bands...

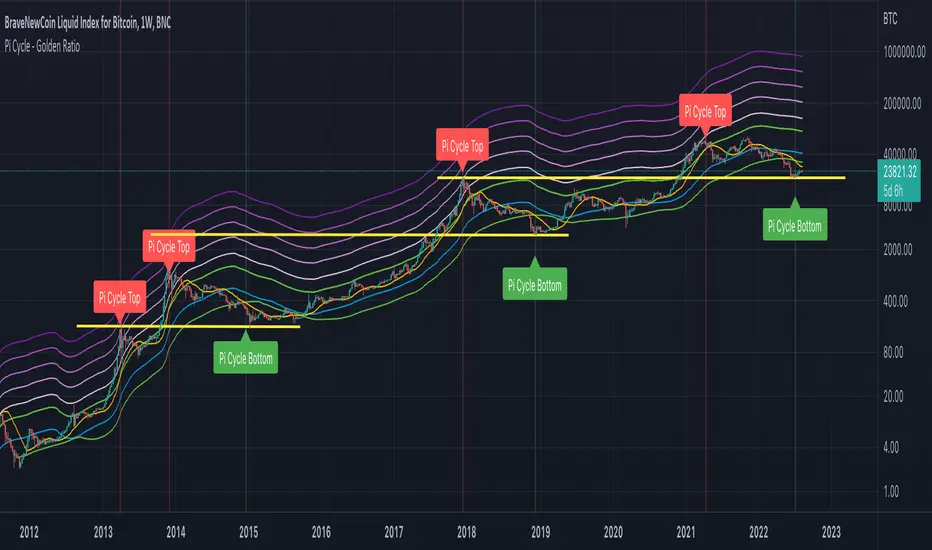
CryptoSignalScanner - Pi Cycle - Golden Ratio MultiplierDESCRIPTION:
All credits are going to Philip Swift who has written an article on Medium about the PI Cycle Top and The Golden Ratio Multiplier .
Based on the article this indicator has been created to display and indicate the Bitcoin PI Cycle Top which has historically been effective in picking out the market cycle highs within 3 days. It also displays the Golden Ratio Multiplier which explores Bitcoin's adoption curve and market cycles.
• The PI Cycle Top is based on the 350DMA (Daily Moving Average) multiplied by 2 and the 111DMA (Daily Moving Average)
• The Golden Ratio Multiplier is based on the 350DMA (Daily Moving Average) the The Golden Ratio which is defines as 350DMA * 1.61803398875 and the Fibonacci Sequence which is defined as 350DMA * 2, 350DMA * 3, 350DMA * 5, 350DMA * 8, 350DMA * 13 and 350DMA * 21
HOW TO USE:
• The PI Cycle Top is picking the market cycle tops within 3 days.
When the 350DMA x2 crosses below the 111DMA Bitcoin price peaks in its market cycle. This indicates that the market is overbought and it is time to take profit.
• The Golden Ratio Multiplier pics the top on every market cycle in Bitcoin’s history and forecasts when Bitcoin will top in the coming market cycle.
In 2011 the top was at 350DMA * 21
In 2013 the top was at 350DMA * 13
In 2014 the top was at 350DMA * 8
In 2018 the top was at 350DMA * 5
If we look at the results above the forecast for next top should be at 350DMA * 3
FEATURES:
• You can change the Long Moving Average which is by default 350
• You can change the Short Moving Average which is by default 111
• You can show/hide the Pi Cycle Top labels
• You can show/hide the Pi Cycle Bottom labels
• You can show/hide the Pi Cycle Moving Averages
• You can show/hide the Golden Ratio
• You can show/hide the Fibonacci Sequence
• You can set an alert when the Pi Cycle Top is reached
REMARKS:
• This advice is NOT financial advice.
• We do not provide personal investment advice and we are not a qualified licensed investment advisor.
• All information found here, including any ideas, opinions, views, predictions, forecasts, commentaries, suggestions, or stock picks, expressed or implied herein, are for informational, entertainment or educational purposes only and should not be construed as personal investment advice.
• We will not and cannot be held liable for any actions you take as a result of anything you read here.
• We only provide this information to help you make a better decision.
• While the information provided is believed to be accurate, it may include errors or inaccuracies.
HOW TO GET ACCESS TO THE SCRIPT:
• Access to this script is free of charge
• You can drop me a message to get access to the script
Good Luck,
SEOCO
Easy Loot Golden CrossGolden/Death Cross Moving Average Indicator
30, 100 & 200 period Simple Moving Average (SMA).
30 = Yellow
100 = Green
200 = Black
Black crosses mark the 'golden crosses' as well as the 'death crosses'. These black crosses appear when the 30 crosses the 100 & when the 100 crosses the 200. These black crosses don't tell you when to buy/sell, but simply indicate interest in the market.
This code is open-source so feel free to add this indicator to your chart and play around with the different moving average timeframes & color schemes.
Golden Cross
The golden cross occurs when a short-term moving average crosses over a major long-term moving average to the upside and is interpreted by analysts and traders as signaling a definitive upward turn in a market. Basically, the short-term average trends up faster than the long-term average, until they cross.
There are three stages to a golden cross:
A downtrend that eventually ends as selling is depleted
A second stage where the shorter moving average crosses up through the longer moving average
Finally, the continuing uptrend, hopefully leading to higher prices
Death Cross
Conversely, a similar downside moving average crossover constitutes the death cross and is understood to signal a decisive downturn in a market. The death cross occurs when the short term average trends down and crosses the long-term average, basically going in the opposite direction of the golden cross.
The death cross preceded the economic downturns in 1929, 1938, 1974, and 2008.

Long only strategy VWAP with BB and Golden Cross EMA50/200
This is strategy, mainly designed for stock markets
It makes uses of the EMA 50/ 200 ( Golden cross) and VWAP and Bollinger bands.
It only takes long positions. It can be adapted to all time frames, but preferably to be used with longer timeframes 1h +
The rules for entry are the next ones :
1. EMA50 > EMA 200
2. if current close > vwap session value
3. check if price dipped BB lower band for any of last 10 candles
EXIT RULE
1. price closes above BB upper
STOP LOSS EXIT
1. As configured --- default is set to 1%
