RiskCalc FX & GoldRiskCalc FX & Gold is a multi-market position sizing tool designed to help you manage risk quickly and accurately. With this script, simply enter your account capital, the percentage of risk you wish to take, and your stop in ticks. Depending on the selected market—Forex or XAUUSD—the script automatically adjusts its calculations:
Forex: Assumes 1 lot equals 100,000 units.
XAUUSD: Assumes 1 lot equals 100 ounces.
The script calculates your risk in dollars and, using a fixed value of 1 USD per tick per lot, determines the ideal position size in both lots and total contracts. Results are displayed in a clear, centralized table at the top of the chart for real-time decision-making.
Perfect for traders operating across multiple markets who need an automated and consistent approach to risk management.
在腳本中搜尋"GOLD"

Sovereign Gold Hodlers Script for comparing nations and their gold, with options including:
Default Comparing the Price of Gold
Use Relative Valuations price / prior price
Measure Reserves/Price
GDP/Gold Price
GDP/Gold Reserves
Given the state of the world I thought it'd be good do see where countries stand, how much real money they hold. I think gold is going to play an increased role in trade between economies in the near future.

Gold Silver SpreadGold silver Spread
Different Between Gold & Silver Price
Find Spread Opportunity
Gold Vs Silver Strength Strategy

Gold Reader by MarketReaderGold Reader is an indicator created for gold trading only. It is the result of deeplearning and cluster 2 step analysis. These analysis highligth specific intra-days patterns.
Pattern 1 is a full bearish day, pattern 4 a full bullish day.
Pattern 2 is an accumulation - manipulation - and bearish impulsion day
Pattern 3 is an accumulation - manipulation - and bullish impulsion day
The indicator draws 6 boxes.
-The orange box (high of pattern 1) correspond to the time and price where the high of the day is likely to form if we are in a pattern 1.
-The purple box (low of pattern 4) correspond to the time and price where the low of the day is likely to form if we are in a pattern 4.
-The red box (high of pattern 2) correspond to the time and price where the high of the day is likely to form if we are in a pattern 2.
-The blue box (low of pattern 3) correspond to the time and price where the low of the day is likely to form if we are in a pattern 3.
The 2 gray box correspond to the high probability of high of a bull day and low of a bear day. It is good area for a end of the day reversal.
ORZ= optimal reversal zone. It is a specific pattern for New York continuation of London session in case of pattern 1 and 4.

Full Swing Gold Vwap Macd SMO StrategyThis is a full strategy designed for gold market using 12h timeframe chart.
Its components are:
VWAP monthly
SMO oscillator
MACD histogram
Rules for entry:
For long: when enter when close of the candle is above vwap monthly, current histogram is higher than the previous one and SMO oscillator is above 0
For long: when enter when close of the candle is below vwap monthly, current histogram is lower than the previous one and SMO oscillator is below 0
Rules for exit:
We exit the trade if we get a reverse condition.
We also exit the trade based on a risk management system, both for SL and TP using % movements.
If you have any questions let me know !

{Gunzo} Stock to Flow (Gold, Silver, Dollar, Bitcoin)This indicator displays the Stock to Flow (S2F) ratio for popular commodities (Gold, Silver, Dollar, Euro, Bitcoin, Ethereum) in order to
compare them and determine which ones could be a good Store of Value (SoV).
OVERVIEW :
Stock to Flow is a popular indicator used to predict commodities scarcity. It evaluates the total stock of a commodity against the total amount that can be produced during a year. This model supposes that if scarcity is increasing, the price is going to increase.
This model has been used over the last years on Bitcoin to determine if the asset was undervalued or overvalued, and even make prediction models on the future price.
This script is going to focus on the Stock to Flow ratio (total stock/amount produced) to compare the following assets over time :
Mining resources (mined) for Gold and Silver
Cryptos assets (mined) for Bitcoin and Ethereum
FIAT currencies (banknotes printed) for Dollar and Euro
CALCULATION :
The calculation of the Stock to Flow ratio evaluates the total stock of a commodity produced against the production made for a specific year. The data is calculated on a yearly basis, then interpolated to get monthly or daily values.
DATA ORIGIN :
The main information needed to calculate the Stock to Flow ratio is the "yearly production" of a commodity. I tried to retrieve that information from the most reliable sources :
for Gold from research on www.gold.org
for Silver from research on www.silverinstitute.org
for Ethereum from research on etherscan.io
for Bitcoin from data source "QUANDL:BCHAIN/TOTBC" from www.quandl.com
for Dollar from research on www.federalreserve.gov
for Euro from research on www.ecb.europa.eu
SETTINGS :
Smoothing for interpolated data : Smoothing factor for assets that are calculated yearly and then interpolated (Gold, Silver, Dollar, Euro, and Ethereum)
Smoothing for non interpolated data : Smoothing factor for assets that are calculated daily and not interpolated (Bitcoin)
Display asset names : Display assets names in a colored rectangle on the right side of the chart
Display asset values : Display assets Stock to Flow ratio in a colored rectangle on the right side of the chart
Display key events for assets : Display important events for the assets at the bottom of the chart using the same color as the assets lines (for example Orange diamond is a Bitcoin halving). Please refer to the script code for the details of all events.
USAGE :
This script can be used on any asset available on TradingView as the data used is either static or external.
However I recommend using it the Gold asset from currency.com as the depth of the chart will be bigger (since 1980s).
It is recommended to used this script on the monthly timeframe as the chart data is calculated yearly and then interpolated.

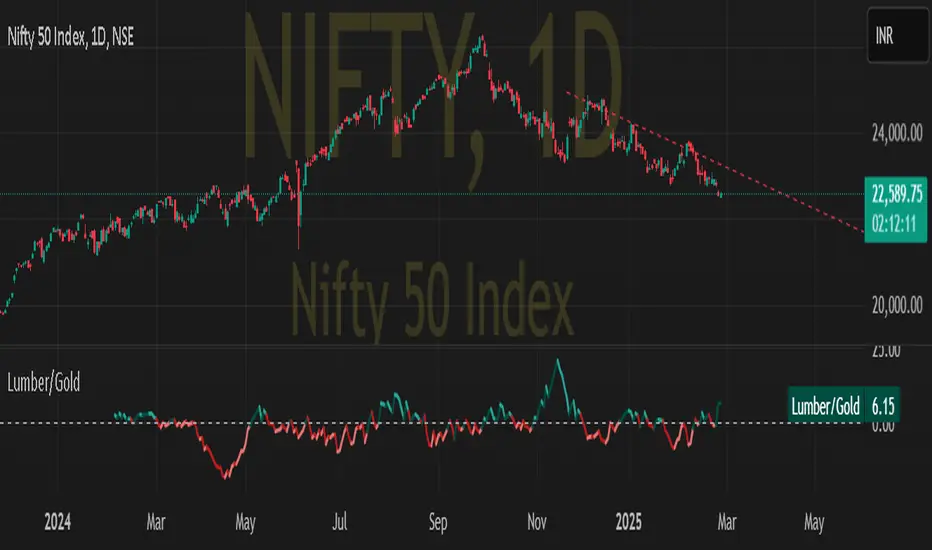
Lumber to Gold ratioDISCRIPTION:-
Lumber to gold ratio helps to predict up upcomming market correction as investors are flocking towards safe heaven.
USE CASE SCENARIO:-
If the ratio is above the zero horizontal line it is a risk of scenario
If the ratio plunge below zero it might show imminent market correction.
Swing or scalping GOLD [RickAtwood] Swing or scalping - automatically determine the currently active trends. Various moving averages are used. It is also designed for any type of trader from scalping to swing.
The key 3 moving averages are designed to identify support and resistance. If the price bounces off them, boldly open and place a stop of 10-20 pips(currency pairs)
Functional
buy ---> green candles
sell ----> red candles
There are alerts for buy and sell based on crossovers
If the price is above the cloud then buy. If the price is below the cloud then sell. The main thing is to open deals only at the very beginning when the price starts to leave the cloud. Also, your stops will be minimal.
When testing this system, we opened 750 trades manually. Success rate of 71% for currency pairs and for gold
P.s If you have any questions about how to open, how to close deals. Always write to me, I will help you) Success to all.

Portfolio and Risk Management: Gold Based Net Growth CoefficientHello, if our topic is stocks, whatever signal we get, we have to divide and reduce the risk.
Apart from the risk, we need inflation-free figures to detect a clear growth.
Gold is one of the most successful tools to beat inflation in this regard in the historical context.
When the economy is good, we have to beat both commodities and inflation.
For this purpose, I found it appropriate to develop a net growth factor free from gold growth.
Investors need several stocks with a high growth rate and as much risk-free as possible.
Personally, I think that the science of portfolio and risk management will last a lifetime and should continue.
I think this subject is a research and development subject.(R & D)
My research and publications on this matter will continue publicly.
I wish everyone a good day.
NOTE : You can determine the return in the time period you want to look back by adjusting the period in the rate you want from the menu.
The standard value is 200 days. (1 year)

Deviation from the futures market for GOLDThis indicator shows the deviation from the gold futures market.
ANN MACD GOLD (XAUUSD)This script aims to establish artificial neural networks with gold data.(4H)
Details :
Learning cycles: 329818
Training error: 0.012767 ( Slightly above average but negligible.)
Input columns: 19
Output columns: 1
Excluded columns: 0
Training example rows: 300
Validating example rows: 0
Querying example rows: 0
Excluded example rows: 0
Duplicated example rows: 0
Input nodes connected: 19
Hidden layer 1 nodes: 5
Hidden layer 2 nodes: 1
Hidden layer 3 nodes: 0
Output nodes: 1
Learning rate: 0.7000
Momentum: 0.8000
Target error: 0.0100
NOTE : Alarms added.
And special thanks to dear wroclai for his great effort.
Deep learning series will continue . Stay tuned! Regards.


Goldclay movement (TF H1) for Trading Gold(XAUUSD)I test this scripts in Gold , mainly I use in Timeframe 15 min
( I try to use with other pairs , It is Ok after I finish test more parameter will post again)
This script will alarm when buy and exit buy , sell and exit sell.
Background :
Dark Green : Buy
Dark Red : Sell
Pink : may sell but not recommend or must use small lot size
Green : may buy but not recommend or must use small lot size
Blue : Interest zone for movement but not confirm buy or sell.
For position sizing I use Stoploss from Daily ATR with %Risk as shown.
you must try many parameter in TP SL %Risk ,....
But I think default value is Ok.

Gold CorrelationsGold has correlations with many trading pairs such as silver, oil, euro, yen, usd, aud, spx, nekkai and many more to go.
In this script i have added GOLD, SILVER, currency of US, EUROPE and JAPAN.
NOTE : More corelations will be added soon.
The corelations will ranged from 0 to 100 denoting the strength.
It is an modified indicator. To be more precise, the raw data is converted to unbounded range according to their strength and then converted to bounded range of 0 to 100.
HOW TO USE
As we can see in the first vertical black line, US started going up and after the second vertical black line, Gold, silver, Europe, Japan started to go downwards.
We can see a nice correlation and call it a nice short.
In future will be adding more correlations.

Gap finder (gold minds)This tool highlights where gaps happens and outlines in the chart where the gap zones are. If there is a gap up there is a green line, a gap down it is red. The gap zone is highlighted in blue. You can choose the size of your gap with the input menu to the desired size. Feel free to ask comment below. Made for the Gold Minds group


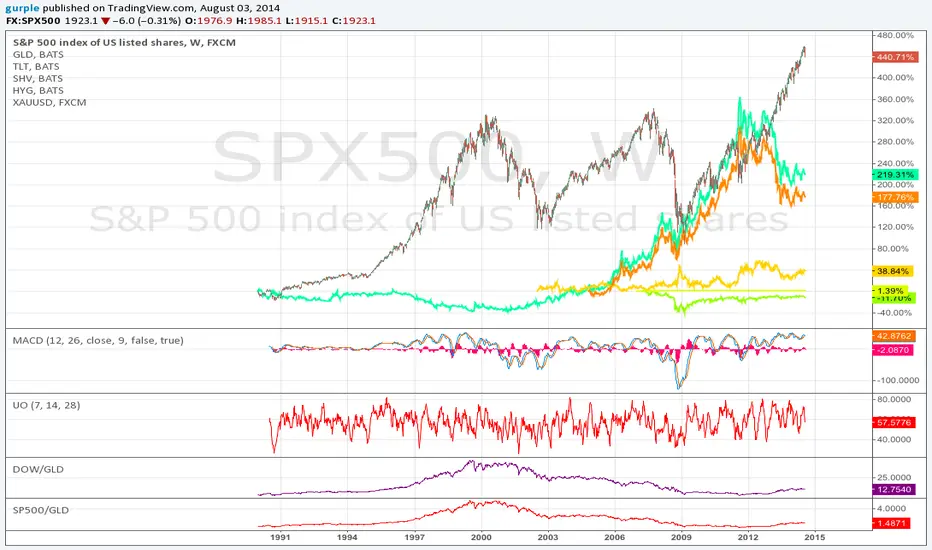
DOW / GOLD RatioHere's a new version with color goodness and using CL1! as the gold spot source (longer history).
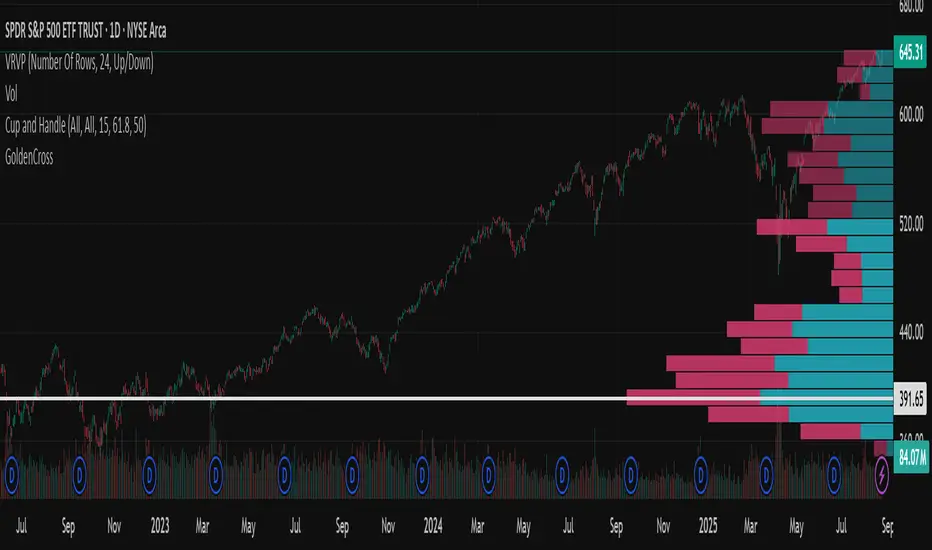
GoldenCrossLibrary "GoldenCross"
get_signals(short_len, long_len)
Parameters:
short_len (int)
long_len (int)
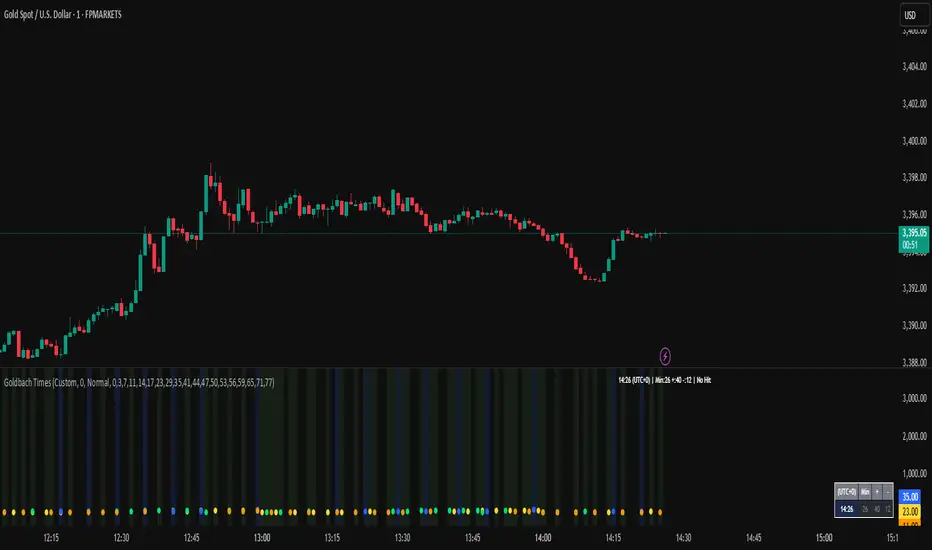
Goldbach Time Indicator🔧 Key Fixes Applied:
1. Time Validation & Bounds Checking:
Hour/Minute Bounds: Ensures hours stay 0-23, minutes stay 0-59
Edge Case Handling: Prevents invalid time calculations from causing missing data
UTC Conversion Safety: Better handling of timezone edge cases
2. Enhanced Value Validation:
NA Checking: Validates all calculated values before using them
Goldbach Detection: Only flags valid, non-NA values as Goldbach hits
Plot Safety: Prevents plotting invalid or NA values that could cause gaps
3. Improved Plot Logic:
Core Level Colors: Blue for core levels (29,35,71,77), yellow/lime/orange for regular hits
Debug Mode Enhanced: Shows all calculations with gray dots when enabled
Better Filtering: Only plots positive, valid values for minus calculations
4. Background vs Dots Issue:
The large green/blue background you see suggests the indicator is detecting Goldbach times correctly, but the dots weren't plotting due to validation issues. This should now be fixed.
Gold Trade Setup Strategy
Title: Profitable Gold Setup Strategy with Adaptive Moving Average & Supertrend
Introduction:
This trading strategy for Gold (XAU/USD) combines the Adaptive Moving Average (AMA) and Supertrend, tailored for high-probability setups during specific trading hours. The AMA identifies the trend, while the Supertrend confirms entry and exit points. The strategy is optimized for swing and intraday traders looking to capitalize on Gold’s price movements with precise trade timing.
Strategy Components:
1. Adaptive Moving Average (AMA):
• Reacts dynamically to market conditions, filtering noise in choppy markets.
• Serves as the primary trend indicator.
2. Supertrend:
• Confirms entry signals with clear buy and sell levels.
• Acts as a trailing stop-loss to protect profits.
Trading Rules:
Trading Hours:
• Only take trades between 8:30 AM and 10:30 PM IST.
• Avoid trading outside these hours to reduce noise and low-volume setups.
Buy Setup:
1. Trend Confirmation: The Adaptive Moving Average (AMA) must be green.
2. Signal Confirmation: The Supertrend should turn green after the AMA is green.
3. Trigger: Take the trade when the high of the trigger candle (the candle that turned Supertrend green) is broken.
Sell Setup (Optional if included):
• Reverse the rules for a short trade: AMA and Supertrend should both indicate bearish conditions (red), and take the trade when the low of the trigger candle is broken.
Stop-Loss and Targets:
• Place the stop-loss at the low of the trigger candle for long trades.
• Set a 1:2 risk-reward ratio or use the Supertrend line as a trailing stop-loss.
Timeframes:
• Recommended timeframes: 1H, 4H, or Daily for swing trading.
• For intraday trading, use 15-minute or 30-minute charts.
Why This Strategy Works:
• Combines trend-following (AMA) with momentum-based entries (Supertrend).
• Focused trading hours filter out low-probability setups.
• Provides precise entry, stop-loss, and target levels for disciplined trading.
Conclusion:
This Gold Setup Strategy is designed for traders seeking a structured approach to trading Gold. Follow the rules strictly, backtest the strategy extensively, and share your results. Let’s master the Gold market together!
Tags: #Gold #XAUUSD #SwingTrading #Intraday #Supertrend #AMA #TechnicalAnalysis #GoldStrategy

Wda Elite Sniper (Golden Duck Runner)Golden Duck Runner With Targets - Professional Trading Indicator
Overview
The "Golden Duck Runner With Targets" is a sophisticated technical analysis indicator designed for active traders seeking precise entry and exit points in trending markets. This indicator combines dual EMA trend analysis with pullback detection and implements a comprehensive fixed-tick risk management system with automatic position cleanup functionality.
Key Features
Dual EMA System
- Fast EMA (18-period): Golden line that tracks short-term price momentum
- Trend Filter EMA (111-period): Thick line for major trend identification
- Teal Color: Bullish trend (Fast EMA > Trend Filter EMA)
- Orange Color: Bearish trend (Fast EMA < Trend Filter EMA)
Advanced Signal Generation
The indicator employs a sophisticated pullback detection algorithm that ensures high-probability entries:
Long Signal Requirements:
- Market must be in uptrend (18 EMA > 111 EMA)
- Price must pull back below the 18 EMA while staying above the 111 EMA
- Price must then close back above the 18 EMA with bullish momentum
- No duplicate signals until position is closed
Short Signal Requirements:
- Market must be in downtrend (18 EMA < 111 EMA)
- Price must pull back above the 18 EMA while staying below the 111 EMA
- Price must then close back below the 18 EMA with bearish momentum
- No duplicate signals until position is closed
Fixed-Tick Risk Management System
The indicator uses predefined tick values for consistent risk management across all instruments:
Risk Levels (Fixed Tick Values):
- Stop Loss: 36 ticks (customizable)
- Take Profit 1: 30 ticks (1:0.83 risk-reward)
- Take Profit 2: 50 ticks (1:1.39 risk-reward)
- Take Profit 3: 75 ticks (1:2.08 risk-reward)
Automatic Position Management
Clean Chart Technology:
- Positions automatically close when TP3 or Stop Loss levels are hit
- All risk management lines are automatically removed upon trade completion
- Charts remain clean and focused on active opportunities only
- Maximum holding period of 20 bars prevents stale signals
Real-Time Monitoring:
- Live position tracking via information dashboard
- Hit detection for all take profit and stop loss levels
- Automatic line cleanup upon position exit
- Visual confirmation of level hits with checkmarks/X marks
Visual Elements
- Golden Entry Level: Clearly marks exact entry price
- Color-Coded Risk Lines: Dark red for stop loss, teal for TP1/TP2, gold for TP3
- Golden Arrow Signals: Easy-to-spot entry points with BUY/SELL labels
- Entry Candle Highlighting: Gold-colored candles mark signal bars
- Information Dashboard: Real-time display of trend, position, entry price, and duration
- Professional Color Scheme: Consistent golden theme throughout
Trading Applications
Best Suited For:
- Scalping on 1-5 minute charts
- Day trading on 15-minute to 1-hour charts
- Swing trading on 4-hour to daily charts
- All liquid markets: Forex, Stocks, Crypto, Commodities
Optimal Market Conditions:
- Trending markets with clear directional bias
- Moderate to high volatility environments
- Liquid instruments with tight spreads
- Active trading sessions with good volume
Technical Specifications
Pine Script Details:
- Version: Pine Script v5
- Chart Type: Overlay indicator
- Non-repainting signals (confirmed on bar close)
- Real-time updates with live dashboard
- Full TradingView alert support
- Resource optimized for smooth performance
Customizable Parameters:
- Fast EMA period (default: 18)
- Trend Filter EMA period (default: 111)
- Stop Loss ticks (default: 36)
- Take Profit levels in ticks (30, 50, 75)
- Display toggles for all visual elements
Usage Instructions
Setup
1. Apply indicator to your preferred timeframe
2. Verify EMA periods suit your trading style
3. Adjust tick values if needed for your instrument
4. Enable TradingView alerts for signal notifications
#Signal Identification
1. Trend Confirmation: Monitor EMA positioning and colors
2. **Pullback Recognition: Wait for price to test 18 EMA level
3. Entry Signal: Golden arrow confirms valid setup completion
Position Management
1. Enter at signal candle close
2. Use provided stop loss level (dark red line)
3. Scale out at take profit levels (teal and gold lines)
4. Monitor dashboard for trade status
Educational Value
This indicator serves as an excellent learning tool for:
Technical Analysis:
- EMA trend following strategies
- Pullback trading methodology
- Support and resistance concepts
- Risk-reward optimization
Trading Discipline:
- Systematic entry and exit rules
- Patient setup selection
- Proper risk management practices
- Emotional control through automation
Performance Features
Signal Quality Control:
- Trend structure validation
- Momentum confirmation requirements
- Anti-whipsaw protection
- Duplicate signal prevention
Risk Management:
- Consistent tick-based calculations
- Multiple profit-taking opportunities
- Automatic position cleanup
- Time-based exit rules (20 bars maximum)
Alert Integration
Built-in alert conditions for:
- Long entry signals
- Short entry signals
- Take Profit 1 hits
- Take Profit 2 hits
- Take Profit 3 hits
- Stop Loss hits
Customization Options
Display Controls:
- Toggle EMA visibility
- Show/hide signal arrows
- Enable/disable information dashboard
Parameter Adjustment:
- Modify EMA periods
- Adjust risk levels in ticks
- Customize visual styling
Important Considerations
Market Suitability:
- Works best in trending market conditions
- Less effective in sideways/choppy markets
- Requires adequate volatility for tick-based targets
Risk Management:
- Always use appropriate position sizing
- Consider instrument characteristics when setting tick values
- Monitor correlation when trading multiple signals
- Maintain detailed trading records
Backtesting Recommendations
Users should conduct thorough testing across:
- Different timeframes
- Various market conditions
- Multiple asset classes
- Extended historical periods
Disclaimer
Educational Purpose: This indicator is designed for educational and analytical purposes. It provides technical analysis signals based on moving average relationships and pullback patterns.
Risk Warning: Trading involves substantial risk of loss. Past performance does not guarantee future results. Users should conduct their own analysis and risk assessment before making trading decisions.
No Investment Advice: This tool provides technical analysis, not investment advice. Users are solely responsible for their trading decisions and outcomes.
Conclusion
The Golden Duck Runner With Targets offers a comprehensive approach to trend-following with precise entry timing and systematic risk management. Its clean visual design, automatic cleanup features, and educational value make it suitable for traders seeking a professional-grade analytical tool.
The fixed-tick risk management system provides consistency across different instruments while the dual EMA framework ensures trades align with the prevailing trend direction. Combined with sophisticated pullback detection, this indicator helps traders develop disciplined approaches to market analysis and position management.
Developed for traders who demand precision, reliability, and professional-grade technical analysis with clean, automated chart management.
