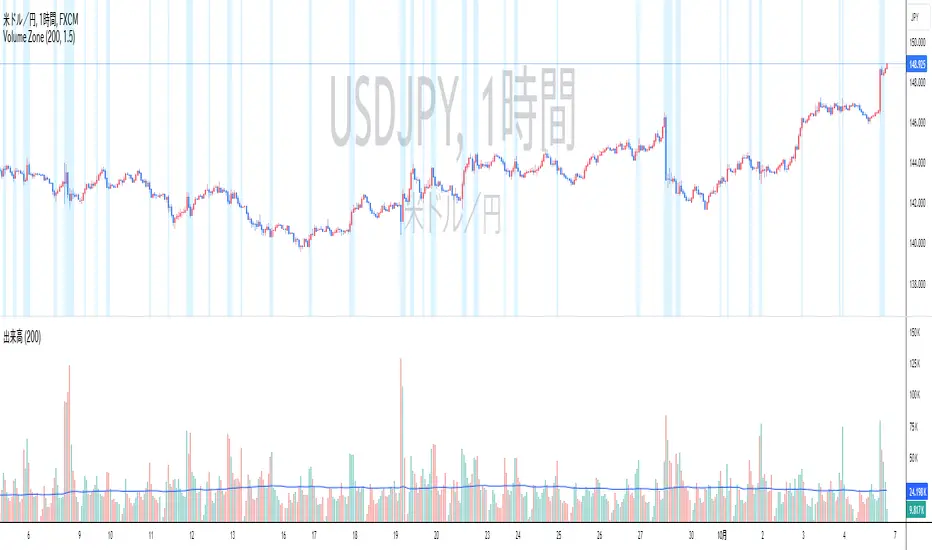
High Volume Zone HighlightDescription:
The High Volume Zone Highlight highlights areas on the chart where the volume exceeds a user-defined threshold based on a moving average. This helps traders visually identify zones of high trading activity.
The moving average period and volume threshold are fully customizable.
Background color highlights appear when the current volume is greater than a specified multiple of the volume moving average.
Ideal for traders who want to spot significant volume changes relative to historical averages.
Inputs:
Volume MA Length: The number of periods for calculating the volume moving average.
Volume MA Factor: A multiplier to define the threshold. For example, setting this to 1.5 will highlight when the volume is 150% of the moving average.
Style Customization:
Users can adjust the color and transparency of the highlighted zones from the settings.
説明:
ハイ・ボリューム・ゾーン・ハイライトは、出来高が移動平均に基づいたユーザー定義の閾値を超えたエリアをチャート上で強調表示します。
移動平均期間と出来高閾値は自由にカスタマイズ可能です。
現在の出来高が出来高移動平均の指定した倍数を超えた場合、背景色が強調表示されます。
過去の平均と比較して重要な出来高の変化を検出したいトレーダーに最適です。
設定項目:
出来高移動平均期間: 出来高移動平均を計算する際の期間。
出来高MA係数: 閾値を定義するための係数。たとえば、1.5に設定すると、出来高が移動平均の150%を超えたときにハイライトされます。
スタイルカスタマイズ:
設定からハイライトされたゾーンの色や透明度を調整できます。
在腳本中搜尋"zone"
Bull Trade Zone IndicatorThe BULL TRADE ZONE INDICATOR is a powerful trading tool designed to help traders identify optimal entry and exit points in the market. This script uses a combination of two Exponential Moving Averages (EMA) and the Average True Range (ATR) to generate buy and sell signals, making it ideal for traders looking to enhance their trading strategy with precise and timely alerts.
Key Features:
Dynamic Buy and Sell Signals: The indicator generates buy signals when the 14 EMA crosses above the 150 EMA and the price is trading above the 150 EMA. Sell signals are generated when the 14 EMA crosses below the 150 EMA and the price is below the 150 EMA, providing clear guidance on potential market trends.
Built-In Stop-Loss Levels: Automatic stop-loss levels are calculated based on the ATR, helping traders manage risk effectively by setting realistic stop-loss points based on market volatility.
Minimal Chart Clutter: To maintain a clean and focused trading environment, the 14 EMA and 150 EMA values are privately used within the script without being visibly plotted on the chart, ensuring that the focus remains on actionable signals.
Clear Visual Alerts: Buy and sell signals are highlighted directly on the chart with intuitive labels, making it easy to spot trading opportunities at a glance.
Who Is This For?
This indicator is suitable for traders of all levels—whether you are a beginner looking for a straightforward trading tool or an experienced trader seeking to add an additional layer of confirmation to your strategy. The BULL TRADE ZONE INDICATOR helps you stay ahead of the market by precisely identifying key trading zones.
How to Use:
Add the indicator to your chart.
Monitor the buy and sell signals generated by the script.
Use the plotted stop-loss levels to manage your trades effectively.
Customize your trading strategy using the indicator’s signals to align with your risk appetite and market view.
Disclaimer:
This indicator is a technical analysis tool designed to assist with decision-making. It should be used alongside other analyses and strategies, not as the sole basis for trading decisions. Always perform your due diligence and risk management when trading.

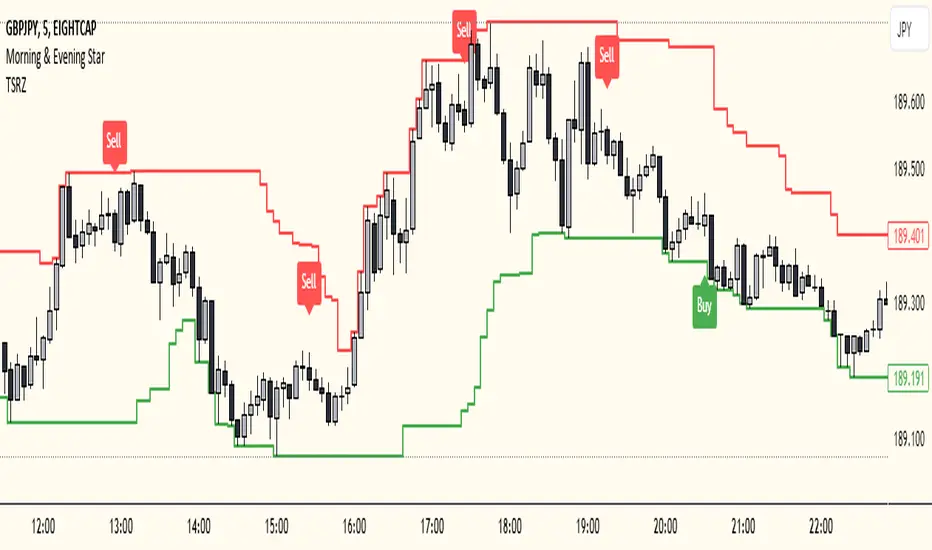
Trailing Support and Resistance Zones
This Script code is used to plot support and resistance levels on a chart. Here's how it works:
Input Parameters: The code starts by defining an input parameter lookback_period, which determines the number of bars to look back when calculating support and resistance levels. You can adjust this parameter based on your preferences or trading strategy. I recommend 50 for longer trends and larger profits.
Calculate Support and Resistance Levels: The calculateSR() function is defined to calculate the support and resistance levels based on the lowest low and highest high prices within the specified lookback period. It uses the ta.lowest() function to find the lowest low price and the ta.highest() function to find the highest high price over the specified number of bars.
Plotting: The function calculateSR() is called to compute the support and resistance levels, and the results are stored in the variables support_level and resistance_level, respectively. These levels are then plotted on the chart using the plot() function. The support levels are plotted in green, while the resistance levels are plotted in red. Both lines are drawn with a specified line width and style (plot.style_stepline).
By visualizing these support and resistance levels on the chart, you can identify potential price levels where the market might find buying or selling pressure. These levels are crucial for making trading decisions, such as setting entry and exit points, defining stop-loss and take-profit levels, and assessing the overall market sentiment.
I recommend using this indicator together with my morning & Evening Star Indicator to find entry zones.
Time Range zoneThis TradingView script displays two time zones on the chart. The first zone starts at 8:00 AM and ends at 1:00 PM, while the second zone starts at 5:00 PM and ends at 10:00 PM. If the current time is within either of these two zones, a green or red background is drawn on the chart, respectively. This script is set by default for my personal XRP strategy.

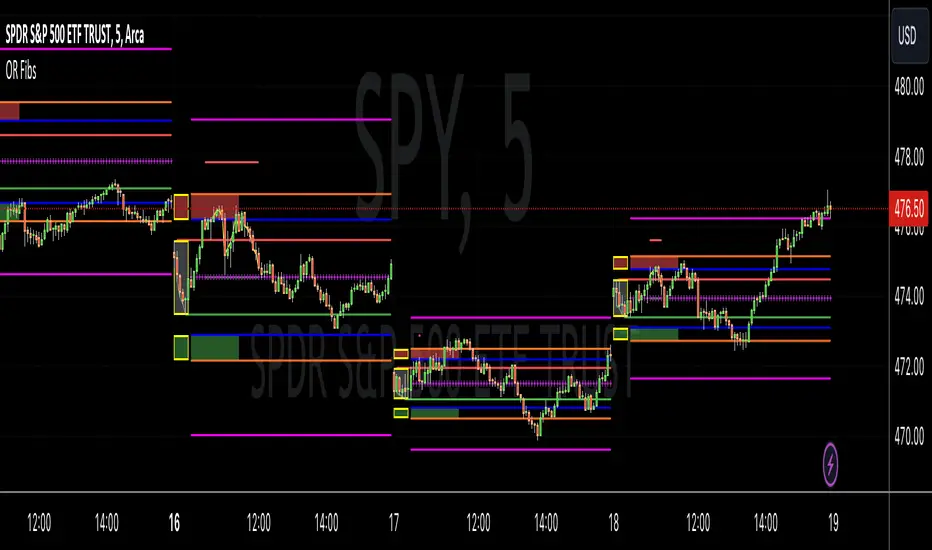
Opening Range Reversal ZonesThis script finds a reversal zone beyond the opening range for the selected period. I borrowed most of the opening range script itself from asenski.
I added a few things:
Trade Entry Times -- this restricts the "alert times."
Shading for the above mentioned times for the two "reversal" zones
A couple of other visuals for lines for the hi, mid, low of the opening range and lines for the fibs
Alerts while in the trading entry time session for fibbonacci crossovers.
I use this on NDX, SPY, and QQQs and have found buying "at the money" 0DTE puts in the "red zone" or 0DTE calls in the "green zone" frequently wins.
I have no statistics, as I am very methodical when I choose to enter, paying attention to the news, recent momentum, etc, and am not blindly entering when alert comes, but when one does, I do research and enter a trade.
In any case, thought I would share.
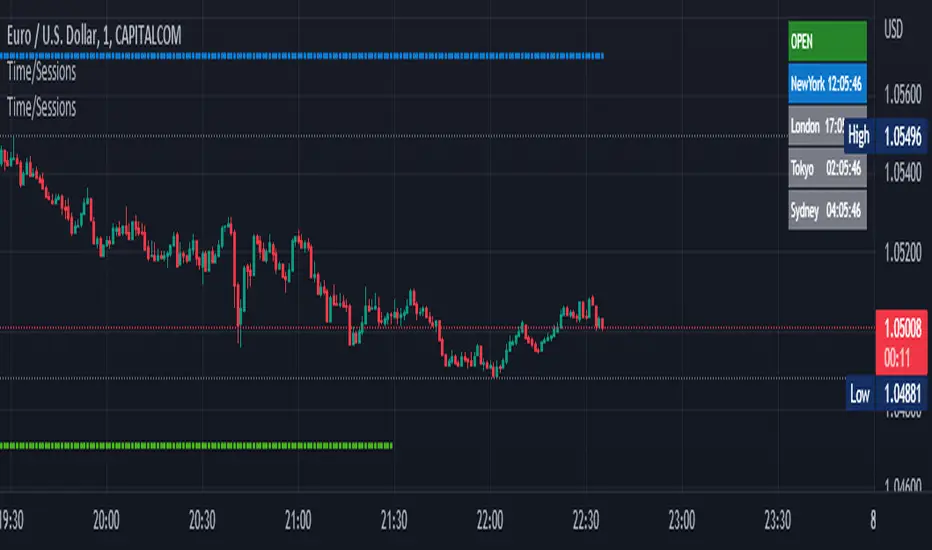
Time Zone / Market SessionsTime Zone / Market Sessions indicator is a handy tool to display current major Market Open / Close condition along with present time at that Exchange. Sydney, Tokyo, London, New York market sessions are included. Clear display of Overlap Zones and Kill Zones.. Can be used to estimate market Pumping and Dumping. Alerts can be set when a market opens.
Time is Displayed in Table Layout
Active Market is displayed as Dots on top and bottom
You can select as Timeline or Table display
Overlap is clearly displayed on top and bottom without any mess
Gray color in Table layout Shows Closed Markets
You are free to reuse this code No Limitations.
Kill Zones are indicated in Table format. When some of the markets are closed
Alerts included for market openings
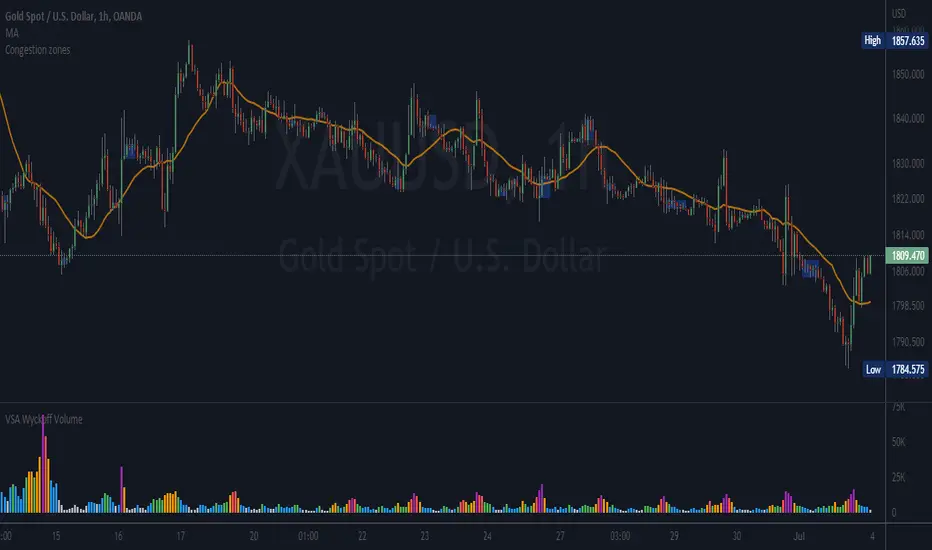
5kto1M - Congestion ZonesCongestion zone include at least 3 candle sticks that the next candle has an opening and closing price within the previous candle
When the price returns to the congested zone there is a possibility of a reversal
The congestion zone is used as a support-resistance area and is used by price action traders.
This script will highlight congestion zones, this will help PA Traders find out them easily.
You can configure the minimum number of candles
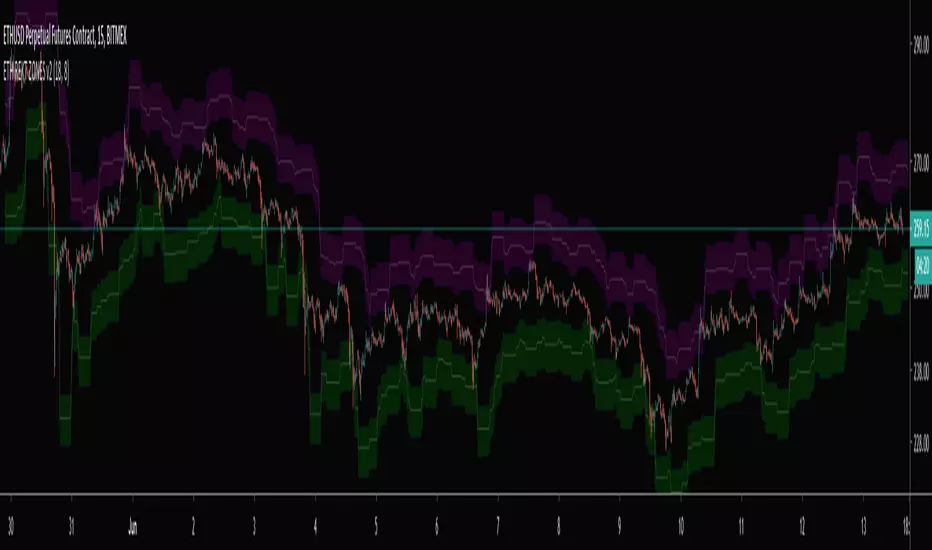
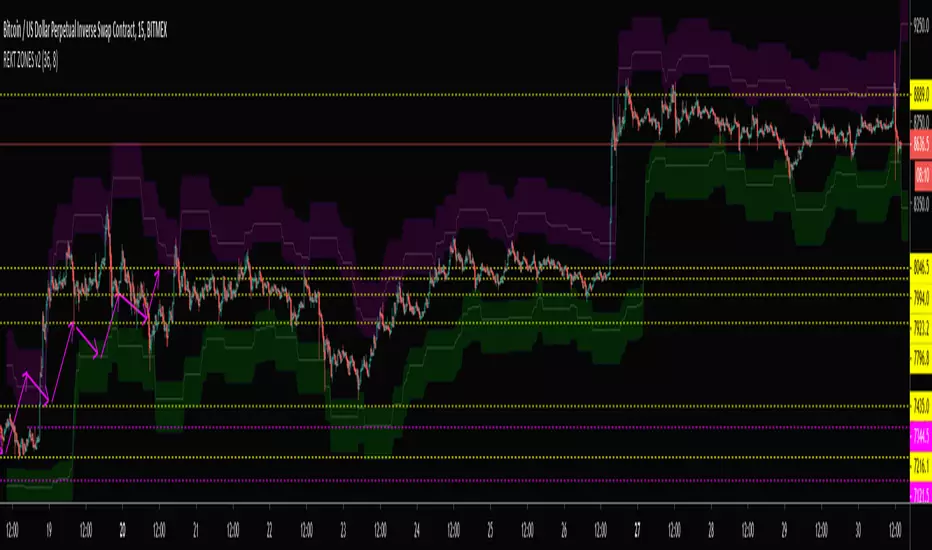
Titans Engulfing Retracement ZonesThe Titan Engulfing Retracement Zones indicator detects Engulfing Candlesticks on a higher user defined timeframe, and uses that event to plot retracement and extension levels on the chart for ease of users' chart reading and trade execution. The four retracement levels, two of which delimit the target entry zone, and another two delimiting the target exit zone, are also user defined.
The user of this indicator is advised that the default levels provided are unoptimized. The user of this indicator is advised to use this indicator at his or her own risk.
To further filter out the results of Engulfing Candlestick detection, a long wick condition has been included into the detection mechanics.

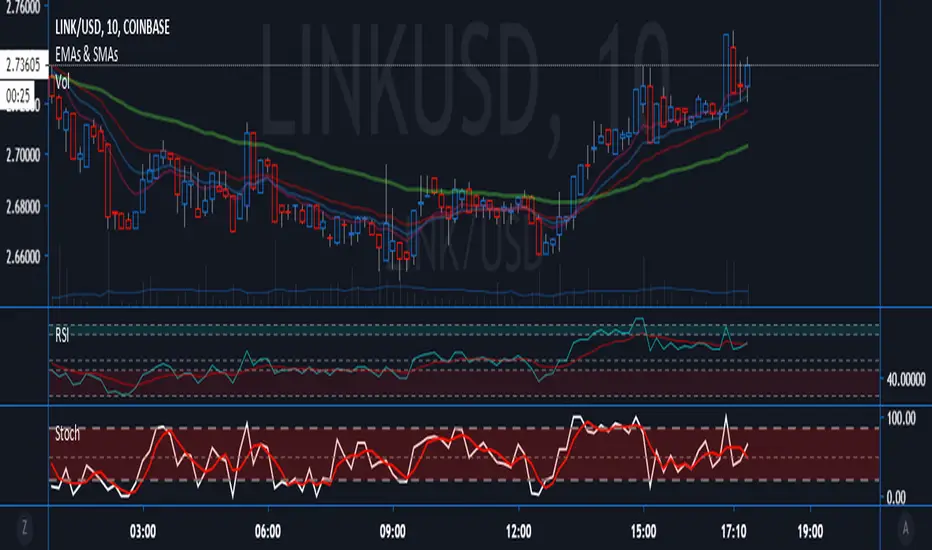
VWAP with 7EMA with ZonesThis is a script with 7 EMAs for every type of trades. This indicator also has the daily weekly and monthly zones. 20,50,100,200 EMAs being the best EMAs of all.
RSI with Divergences, Reverse Formulas, and Bull/Bear ZonesRegular RSI indicator that can underline divergences, turn green or red specifying user specified bull/bear zones, and with a label showing the price needed to turn bull/bear!
Specify the inputs:
+ RSI Length
+ Bull Threshold
+ Bear Threshold
+ Panel Position Offset
Also with toggle-able:
+ Bullish Divergence
+ Bearish Divergence
+ Hidden Bullish Divergence
+ Hidden Bearish Divergence
The zones included in the indicator are default and not meant to be used for all markets. The goal is to alter the bull/bear zones to find good breakout points and selloff points for your chosen security. Does not currently support automatic zone creation, or saving zones for each security (if that is even possible, may just need to create different layouts for each security).
Thanks!

Kill Zone SessionsKill Zone Sessions
Kill Zone Sessions is an indicator that allows you to highlight customizable backgrounds for specified time zones. The problem with 99% of all session indicators on TradingView is that they only plot real-time, sure this is good when you look back on the charts with loaded data. Looks pretty I guess, but having it in real-time with no forward plotting abilities is useless. It provides a trader with no preparedness or edge to trade within that time frame.
The solution is to plot the next 24 hours in advanced of the current time, that way you will always see when the sessions are in relation to your current time.
This will highlight the time zone 24 hours in advance so you always know when the session are and can plan TA around that!
15m USDCHF
1m GBPUSD
5m BTCUSD

Mayfair Supply & Demand Zones 1.0Identifying Supply and Demand zones can be tricky.
Just using price levels can mislead you, so why not include volume ramps to detect zones?
This indicator does it for you. It spots areas where volume has rapidly increased, measures the speed of the increase, and assigns three different levels of importance.
The red areas are the strongest zones, followed by amber, then green, like a traffic light.
The red areas are persisted longer than the amber, which are persisted longer than the green. As the persistence fades, the colour of the zone fades as well.
It is possible to set the levels of all three volume thresholds to suit yourself, as well as the lookback period the script uses to detect volume increases.
In this chart, only very large volume increases are used:
As you can see, the bands are narrower, but we feel the defaults give the best results.

Ishiki ZoneOANDA:USDJPY
Ishiki Zone is drawn to the conscious price range and functions as a very strong resistance zone.
The strength of the resistance band is indicated by color. The strongest is the red zone, the second strongest is the yellow zone, and the third strongest is the blue zone.
In the vicinity of Ishiki Zone, create a chart pattern at the Day bar or more of the time axis, it is often to new trend formation.
currency pair:USDJPY, EURUSD
意識ゾーンは市場全体に意識されているであろう価格帯に引いており、非常に強い抵抗帯として機能します。
色別で抵抗帯の強さを表しており、1番強いのがレッドゾーン、2番目に強いのがイエローゾーン、そして3番目がブルーゾーンとなっています。
意識ゾーン付近では、日足以上の時間軸でチャートパターンや何かしらの値動きを作り、そこからまた新たにトレンド形成することが多いです。
意識ゾーンは大きな時間軸の環境認識として利用するのが適しています。
対応通貨ペア:USDJPY, EURUSD

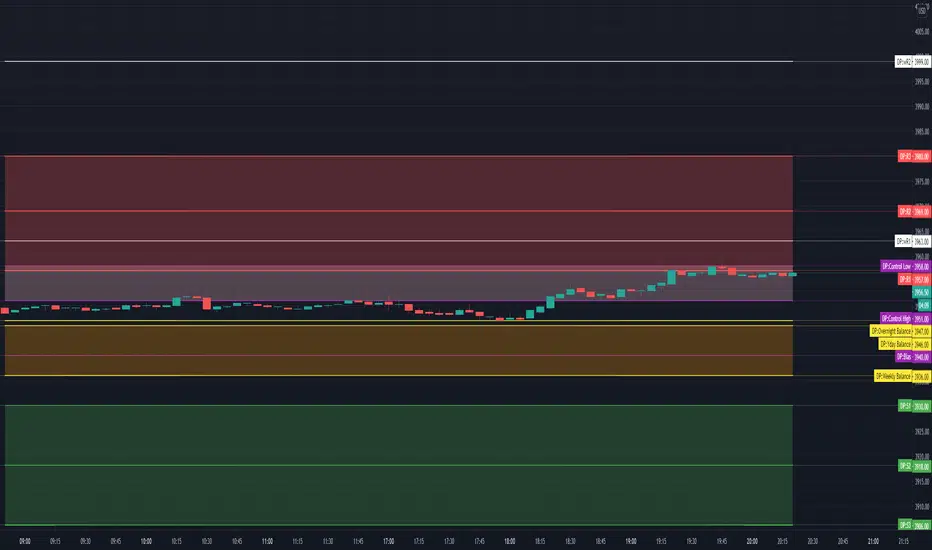
TV Day Plan Template 1This is a template for daytraders, swing traders, supply and demand traders, and even swing traders. As traders we are always scanning charts for levels and zones. This template makes it easy and convenient to find, change, and chart levels. As a daytrader, I will use this daily. I always have daily and weekly targets in mind. This will ensure I don't lose track of the bigger picture while trading the smaller moves. Levels in this chart are not auto calculated. They are manually input. This script is a quick and convenient way to chart multiple levels without having to go through each drawing, change the settings, and then redraw the level. Currently this will only save levels for one ticker. A workaround is to use multiple instances and then hide the ones not in use. Another way is to use the second part to this script, Day Plan Levels Template 2. If only using one instance, you can save the levels as default. This will save them. However, if saving levels as default while using multiple instances of this indicator, the other levels will erase. The way that I use this that I have daily levels for #ES in one instance and then daily levels for #NQ in another instance.
This script is very customizable
Options include
On/Off Toggles
Light/Heavy Versions - Light versions does not plot. Heavy version will plot and show levels in info bar and price axis
Balance Levels
Control Levels
3 Support and 3 Resistance levels for daily and weekly
2 Support and 2 Resistance Clouds
Balance and Control Clouds
"0" value disables and hides levels
WF ZonesSimple Zones. Indicator draws zero line (open price of the day), then +0.25% (-0.25%), +0.5% (-0.5%), +0.75% (-0.75%) and +1% (-1%).
Statistic say that zero -0.25 & zero +0.25 are the range of flat. Movement from 0.25 to 0.5 is 68% in average. 0.5-0.75% is about 70%. 0.75 - 1% less than 50%.


Futures time zoneMarks the different time zones of futures. The time zones are Globex, Kill zone, Pre market, Post market and lunch time

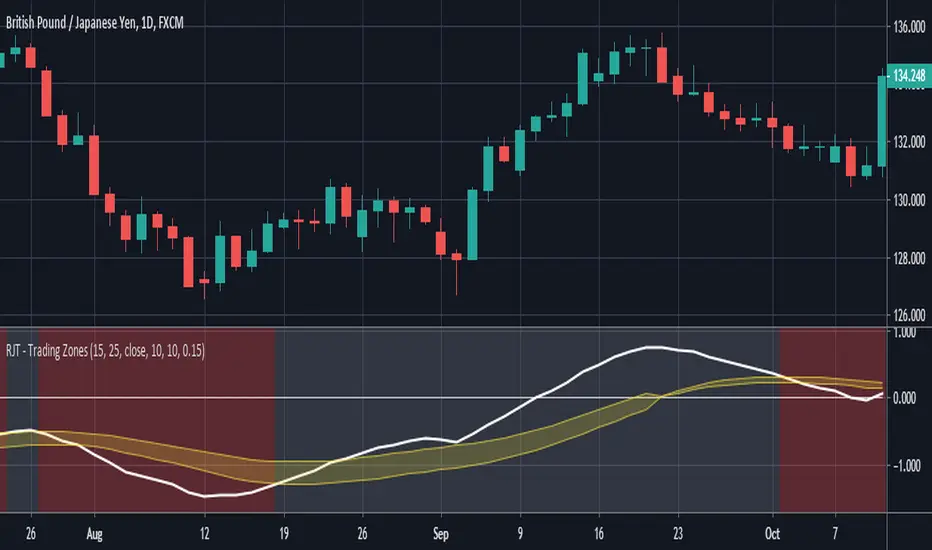
RJT - Trading ZonesThis is the Visual Indicator component of my Trading Zones System; other indicators are the Trade Visualiser and Trader Placer.
This indicator is based around a convergence and divergence of moving averages. As the signal line moves into the yellow "zone" from below a long position is opened. This position is closed and reversed when either the upper or lower boundary is crossed downwards by the signal line. This is all reversed for short trades.
The channel is created by adding a factor of previous values, from a configurable period, to an exponential moving average of the signal line.
Best used on the Daily timeframe of any Forex or Commodity market, but is successful on all timeframes.
Go Long when background turns from Red to Green.
Go Short when background changes from Green to Red.
Signal Smoothing = Length of signal period
Signal Look back period = Period of look back for highest value (when long, lowest value when short) to create channel width
Channel multiple= Multiple of highest value to be added to EMA of Signal to create zone (larger number = wider zone)
Relative Strength Index With EMA and Control ZonesThought this could be helpful since I couldnt find an RSI with an ema and Browns theory using control zones. Hope you all enjoy!
Selective Kill Zones for Crypto Market by 2tmHello Everyone.
This is Kill Zones for Crypto Market such as XBTUSD, ADABTC , other Scammie and Some the Other Scam.
I think You guys who find my kill zone script that you know almost every thing on about it.
Basically, the Timer of each chart in this great site teamveiwer is not moving in some united standard.
It just work on Exchanges timer.
It means there are so many various that to make a single scrypt.
For that reason I made a Kill zone Script for Crypto Market
I'll update some more logic on it soon.
Thnak you and hope your successful investment.

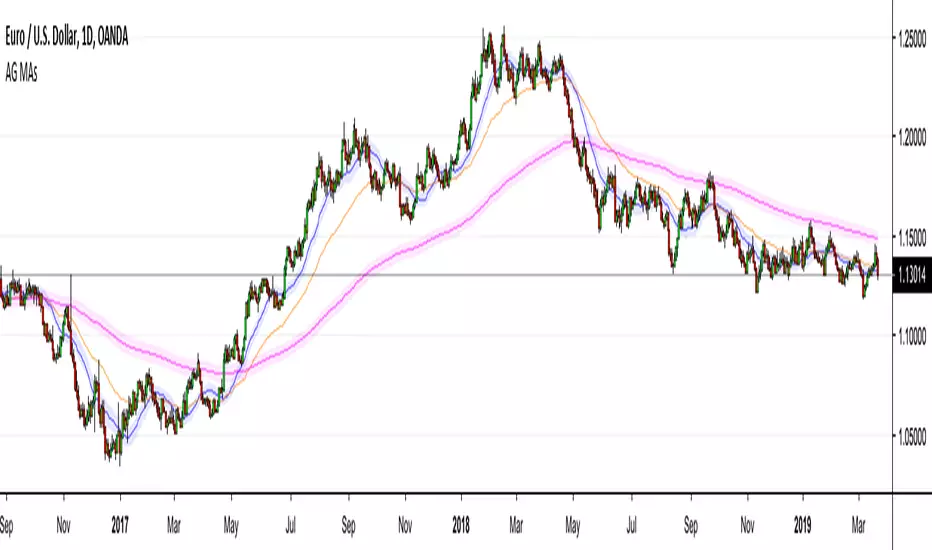
AG Moving Averages w/ BandsThis is an indicator that we built from a few simple ideas: display more than one Moving Average, display the Moving Average "Band" (more below) for each Moving Average, and allowing toggle between SMA/EMA - all in the one indicator.
The Moving Average "Band" is creating using Moving Averages (SMA/EMA) with High and Low as sources. The combination of the MA(Close), MA(High), MA(Low), creates a "Band" for each MA length - which we have found to be very helpful in our Moving Average studies.
The example in the chart above is EURUSD with 20SMA (with Bands), 55EMA (without Bands), 200EMA (with Bands). As you can see, the Bands do a better job than MAs alone for capturing price movement and acting as larger dynamic Support/Resistance zones.
Everything in this indicator is fully customizable, from which MAs to show, to those MA lengths, whether to use SMA/EMA for each individual MA, and whether to display the MA "Band" for each individual MA.
We hope you find it as useful as we have!