Sentiment Zone OscillatorHere's a (forgotten but still useful) Sentiment Zone Oscillator. The Sentiment Zone Oscillator takes a sum of positive price candles over a user-specified window length. Normally, a triple exponential moving average of the sum is used, but we opted to just go with a double EMA for the sake of more responsiveness. When the histogram is green it is bullish and red/pink means bears.
在腳本中搜尋"zone"


Kitti-Playbook Action Zone V4.2.0 FOR Stock MarketBasic CDC Action Zone + Last Price
For Stock Market src = close

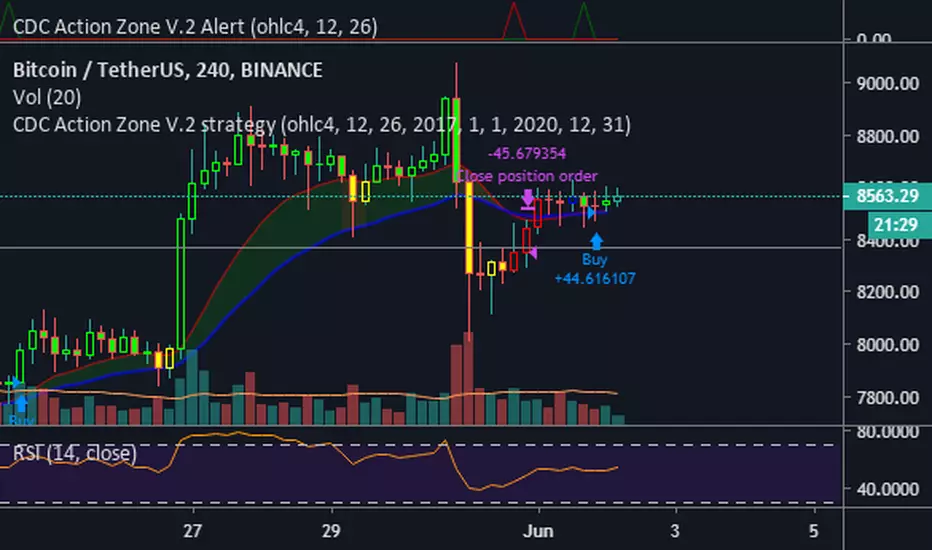
CDC Action Zone V.2 Alertวิธีใช้ให้ตั้งค่า ดังนี้
Condition = CDC Action Zone V.2 Alert
= Short หรือ Long (ขาย หรือ ซื้อ)
= Crossing Down
= Value
= 0.9
หมายเหตุ : ที่ต้องเลือก Crossing Down เพื่อให้มีการยืนยันแท่งเขียวแรกก่อน ซึ่งจะตรงกับ strategy ด้วย
Strategy Ref:
Chop Zone Strategy - Buy OnlyUses build-in indicator "Chop Zone" which measures angle of EMA-34.
Buy when there are 3 consecutive turquoise bar.
Close when there are 3 consecutive non-turquoise bar.

⚛WPZO - Wave Period Zone Oscillator by Cryptorhythms⚛WPZO - Wave Period Zone Oscillator by Cryptorhythms
Intro
Based upon Akram El Sherbini's article "Time Cycle Oscillators" published in IFTA journal 2018.
Companion indicator to the Wave Period Oscillator, this is simply a transformation to display in a familiar manner like an RSI. Occasionally WPO can exceed the upper and lower boundary lines in strong moves. With WPZO, it will never go below -80 or above +80.
Description
In the Authors words....
"The wave period zone oscillator (WPZO) is a bounded oscillator for the wave period oscillator (WPO) and calculates the period of the market’s cycle. In other words, the wave period refers to the time taken by buyers or sellers to complete one cycle. The oscillator moves within a range of -100 to 100 percent.
The WPZO has overbought and oversold levels at +40 and -40 respectively. At extreme periods, the oscillator may reach the levels of +60 and -60. The zero level demonstrates an equilibrium between the periods of bulls and bears. The WPZO oscillates between +40 and -40. The crossover at those levels creates buy and sell signals. In an uptrend, the WPZO fluctuates between 0 and +40 where the bulls are controlling the market.
On the contrary, the WPZO fluctuates between 0 and -40 during downtrends where the bears control the market. Reaching the extreme level of -60 in an uptrend is a sign of weakness. Mostly, the oscillator will retrace from its centerline rather than the upper boundary of +40. On the other hand, reaching +60 in a downtrend is a sign of strength, and the oscillator will not be able to reach its lower boundary of -40.
During an ideal uptrend, the WPZO does not reach the lower boundary of -40 and usually rebounds from a higher level than -40. This means that the bulls have taken control earlier. Hence, a zeroline crossover generates a buy signal. The WPZO crosses the upper boundary at +40, then pulls back again below +40 to generate a sell signal. During sideways, the WPZO fluctuates between the lower and upper boundaries of -40 and +40. This tactic is also used in an uptrend where corrections are strong enough to drive the WPZO line below the lower boundary. During downtrends, the WPZO fails to reach the upper boundary and oscillates between the 0 and -40 levels.
The bears enter early, indicating an obvious weakness in the market. Therefore, crossing the zero level generates a sell signal. The exit at weakness tactic is used during uptrend reversals and downtrends. The WPZO oscillates between the centerline and the lower boundary of -40. The bears are controlling the market and move in wide cycle periods, while the bull’s strength is almost absent. An exit signal is triggered once the WPZO crosses -40. When prices decline, the WPZO may cross its extreme lower boundary at -60. Therefore, a swift exit signal is triggered once the WPZO crosses -40.
The WPZO gives an insight about the relation between time and price movements. In this article, we used the oscillator to differentiate between the time taken by bulls and bears to complete one cycle. Due to the boundaries effect, the WPZO may diverge less than the WPO with prices."
TL:DR
More strategy discussed above, but heres the short version:
Bullish signals are generated when WPZO crosses over 0
Bearish signals are generated when WPZO crosses under 0
OverBought level is 40
OverSold level is -40
ExtremeOB level is 60
ExtremeOS level is -60
👍 Enjoying this indicator or find it useful? Please give me a like and follow! I post crypto analysis, price action strategies and free indicators regularly.
💬 Questions? Comments? Want to get access to an entire suite of proven trading indicators? Come visit us on telegram and chat, or just soak up some knowledge. We make timely posts about the market, news, and strategy everyday. Our community isn't open only to subscribers - everyone is welcome to join.
For Trialers & Chat: t.me


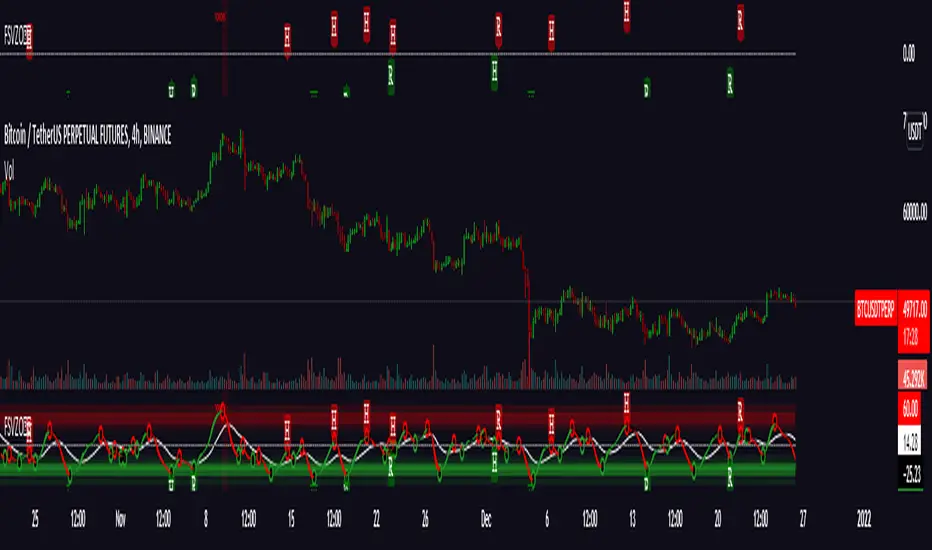
Regularized Volume Zone Oscillator FSVZORegularized VZO
Vanilla in link below
White noise and 1 confirm auto divs included

Volume Zone OscillatorOscillator is build on Walid Khalil's and David Steckler's concept for leading volume oscillator
All indicators core's dynamics is fully explained it two articles bellow , written by concepts fathers
Stocks & Commodities V. 29:5 (16-23, 28): In The Volume Zone by Walid Khalil and David Steckler
edmond.mires.co/GES816/14-In%20The%20Volume%20Zone.pdf
2008-IFTA journal-Volume Zone Oscillator (VZO) ~by Waleed Aly Khalil
capitalsynergy.com/resources/IFTA09VZO.pdf
//
Extreme conditions are visually intuitive
Momentum shift alerts
Candle printer for H/R Divergence pockets and confirmed divergences
Ehlers white noise indicator "branch" have wonderful confluences with VZO so its included as optional feature, its toggle button and settings are market with ⚠️to remind that its still heavily experimental
Every visual object group in script can be turned off separately from each other for customization freedom
V0.5

PPSignal PROBABILITY FIBONACCI ZONE ANALYSIS V2The ROBERT KRAUSZ'S HIGH PROBABILITY FIBONACCI ZONE ANALYSIS™ Indicator
(www.academia.edu)
www.fibonaccitrader.com
[ b]Setting
TF=Time Frame
If you are in:
From 1H to 1 W:
- TF 1W: set in 6M | 12M (best)
- TF 1D : set in 1M
- TF 1H : set in 1440 ( 24H)
F or 5 minutes
Forex
- TF 5: set in 720 (=12H)
Futures (es, sp, cl, etc.
-TF 5: set in 1D

HTF High/LowThis simple script draws the previous higher timeframe candle high/low to your chart.
You can also make the script paint the zone between the low/open and the high/close.

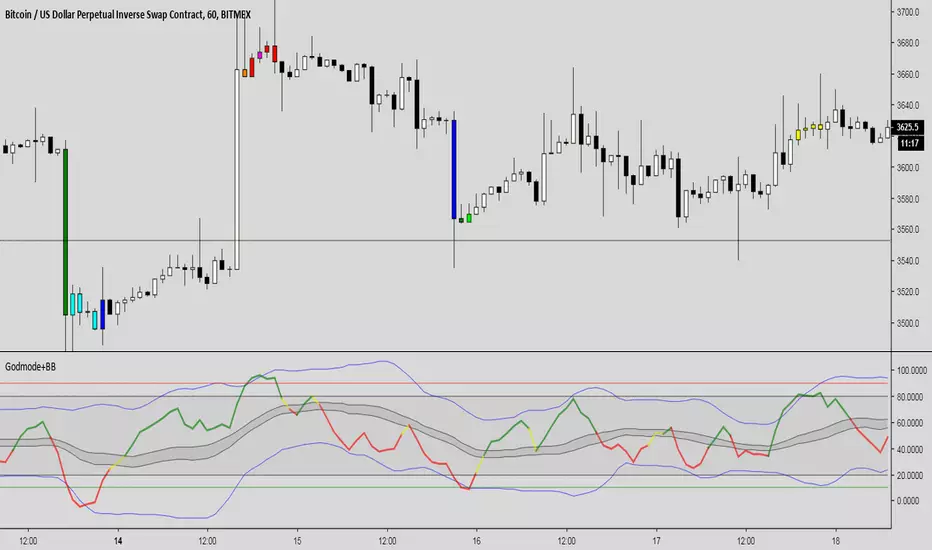
Godmode + BB + Dispersion ZoneThis is fully customizable Godmode signal line encapsulated into Bollinger band with plotted dispersion zone (aka "no man's land") with multiple candle coloring option for marking oversold/overbought condition + alerts for early (risky) and more safe entry.
PpSignal RSI Donchian Channels (Dynamic Zone Leo Zamansky)Rsi Donchian channel stoch based in teory of Dynamic Zone Leo Zamanky


SMART4TRADER-VOLATILITY ZONE oscillatorThis oscillator should be used in conjunction with indicators:
Этот осциллятор необходимо использовать совместно с индикаторам:

Two moving averages with zone coloringTwo EMA's with the zone between them colored based on the trend direction.

Multiple moving averages with zone coloringEMA's 20 to 200. The zone between EMA 20 and EMA 200 is colored based on the trend direction.


TRADE ZONEThe TRADE ZONE tool helps you look at the moment when the price is trading on a strong support or on strong resistance
