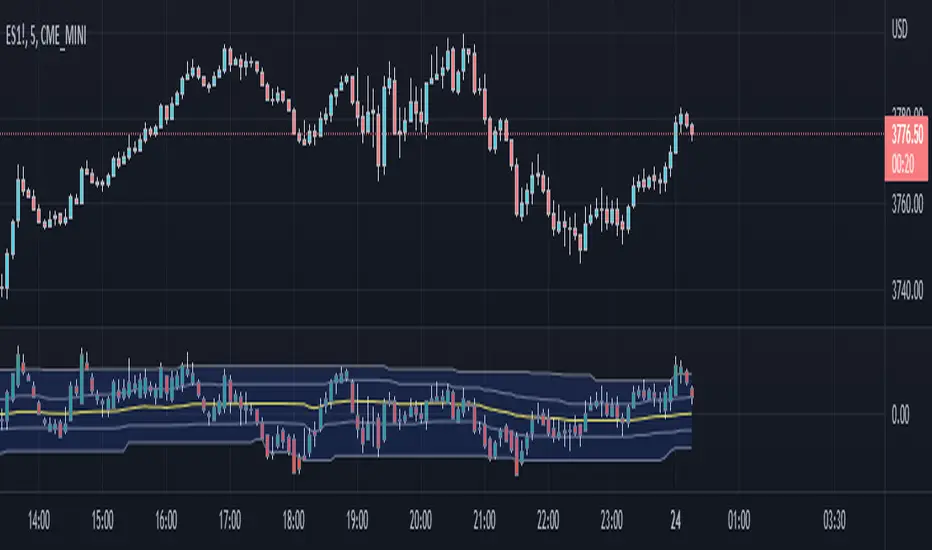
[QG] Dynamic Zones Value ChartThe classic value charts indicator has fixed overbought and oversold levels at 8 and 10 levels and the idea of adding dynamic zones around them instead of fixed levels is appealing.
During the strong trending movements, the overbought and oversold levels also dynamically move up or down.
I have used the dynamic zones code by @allanster.
The idea of using dynamic zones on value charts comes from a similar indicator available in mql4.
在腳本中搜尋"zone"
Asia Reversal ZoneThis indicator shows the most likely time Asia session reverses it direction.
Designed for US30 scalps 30-100 points.
Focus on price and time that is key.
Remove Plot line.
Also check out "Deluxo Kill zones" my other indicator.
-Enjoy

Flat Detect By Bollinger BandsThis simple script indicate the potential flat market zones, calculated based on the Bollinger Bands width.
It's showing the Bollinger Bands in red when the market is detected as flat.
You can adjust the Width Threshold with precision on the inputs settings.
Enjoy :)

Consolidation Zone Hunter NPR BasedThis script will search for zones where the range between the high and low is lower than avg % nearest rank of last X bars.
After X(=30) bars of consolidating range it will signal that the market is in a range and draw the top, bottom and middle of that range.
When price breaks the consolidating range the range is cleared, this is where you long/short the breakout. After this it will look for the next range and do the same.
Visual Explanation

Fibonacci Pivot ZonesFibonacci Pivot Zones make use of the average price between the high, low & close of the previous session, while adding deviations based on Fibonacci numbers to form support and resistance zones, which can be used as targets for intraday and swing trading.
You can select the timeframe for the zones, for example 12 hour pivots to trade in 15m timeframe, or even monthly pivots to trade on the daily timeframe.
You can choose the different fibonacci levels on the menu, by default these are:
0.382
0.618
0.782
1
Enjoy!
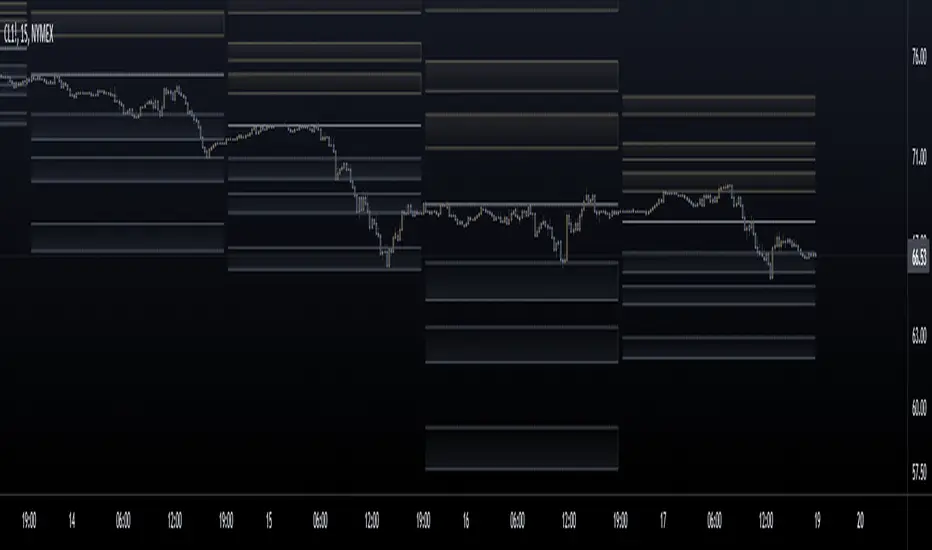
Initial Balance Markets Time ZonesThe below script is based on Initial Balance.
Initial Balance is based on the highest and lowest points of Price Action (PA) within the first 60 minutes of trading. There is so much information available online, reference Initial Balance, that I have not provided a reference.
Most indicators I have seen have been solely based on UTC 0000 Initial Balance. My aim with this indicator was to be able to visualize how other time zones market openings Initial Balance affect PA.
The three market openings I chose to code in are:
London 0800 to 0900
New York 1430 to 1530
Asia 0000 to 0100
Within the script I have given the user the option to select to see with a green or red background when PA is above all zones Initial Balance high (green) or PA is below all zones Initial Balance low (red).
Alerts are also coded in, to prompt the user that PA has gone above or below as per above.
The Initial Balance high and lows also offer another form of areas of confluence.
Below are some examples of IB in action:
LTC
NULS
UNFI
DEXE

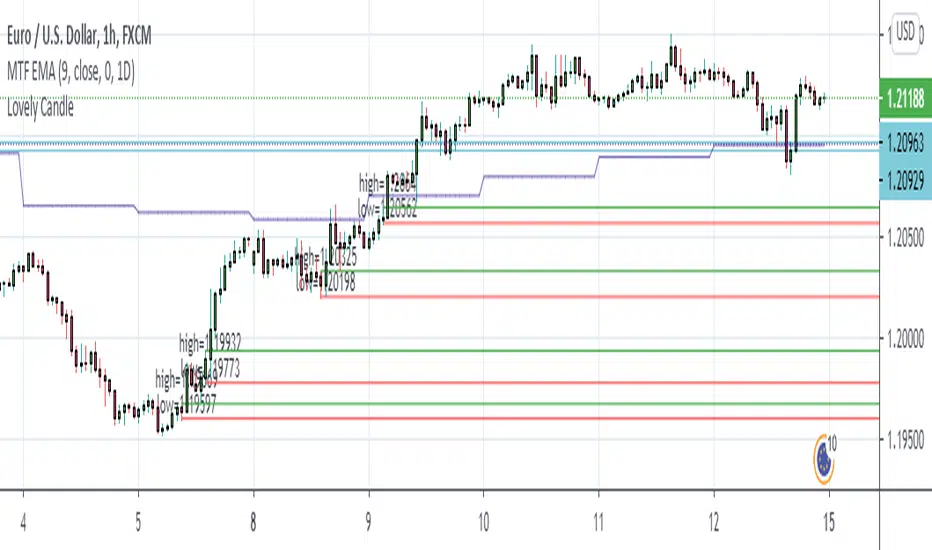
Lovely CandleThis is my Simple Project to make me confidence to take an entry
I always use it in H1 Chart
Add other Indicator like Multi Timeframe EMA Length 9 on 1 Day Period
Just set the sell limit or buy limit to the Lovely candle Zone that touch the EMA 9. Set RR to 1:3 minimum. don't forget to set BEP.
Japanese Candle Patterns Detector in Potential price zoneThis script would find the 8 famous "Japanese Candle Stick Patterns" in your chart.
Please be aware it find patterns in "Potential price zones" only, which help you to avoid none-important patterns during a price trend.
I used RSI and ATR in my codes to find best candle forms and price conditions.
Bellow patterns are detecting:
Hammer | ShootingStar | Engulfing Candle | Doji | Tweezers Top/Buttom | Three White Soldiers/Three Black Crows | Marubozu | Harami
* You can select your preferred patterns from indicator setting.
* Pattern names are abbreviated for better view on chart.
I hope it helps you to improve your trading.

Betelgeuse-Good entry/exit zoneHello everyone and welcome!
This is the my first indicator and also the first version of Betelgeuse script,I hope you will like it.
The indicator was designed to be used on cryptocurrencies
The idea is to be able to identify good entry and exit points in the market, traders often try to identify the minimum or maximum points and this is why Betelgeuse was born.
Betelgeuse should be combined with your analysis and other indicators to find good entry and exit zones and not a precise point.Obviously the more the indicator will be used
over long time frames the more accurate the signals will be.
You can decide to wait for a good signal from the RSI or from the MACD and add up
the Betelegeuse confirmation for a good entry or exit from the market.
The MA based indicator will give you an idea of the direction of the medium term trend.
Direct message me for acces.

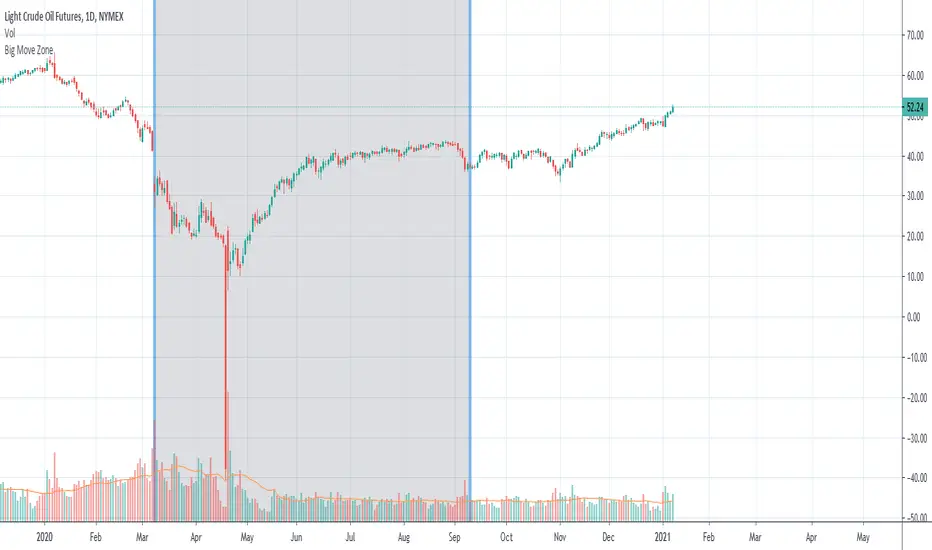
Big Move Finder Outlier ZoneA way to find if price made a big move in a user input given amount of time ago. If it made a move more than the given percent amount, a colored zone will be placed until a given amount of length finishes taking place, and then it will stop coloring the zone. This helps filter out or find stocks that are making or have made too big a price move or were too volatile in the past.
[MACLEN] HODL ZONE RENKO
PLEASE READ!
Trade at your own risk. Please read about renko charts before using this indicator. This indicator is for educational purposes only.
This Indicator is only valid in renko charts with 1 second timeframe. For BTCUSDT . With the traditional method and the size box of 80.
With this indicator we can detect zones of buy and sell. Even that is not recommended to use leverage, I use it to find an entry and use only small leverages. It could be also used to accumulate and HODL bitcoin .
Please, comment anything.
POR FAVOR LEER!
Tradea bajo tu propio riesgo. Por favor lee sobre las graficas renko antes de usar este indicador. Este indicador es solamente con fines educativos.
Este indicador es válido solamente en graficas renko con un timeframe de 1 segundo. Para BTCUSDT . Con cajas del método tradicional de un tamaño de 80.
Con este indicador podemos detectar zonas de compra y venta. A pesar de que no es recomendable usar apalancamiento, yo lo uso para encontrar entradas y solo uso apalancamientos pequeños. También podría usarse para acumular y holdear bitcoin .
Por favor, escríbeme cualquier duda o comentario.

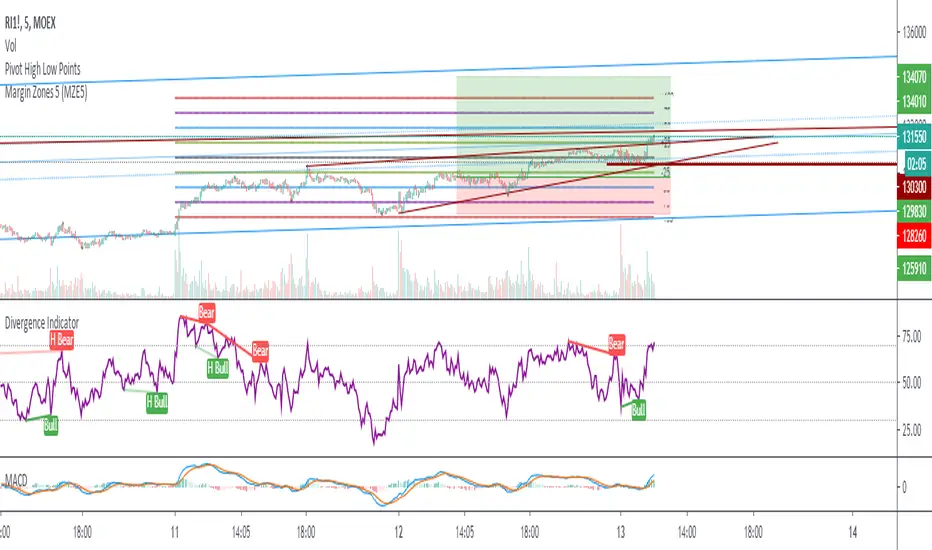
Margin Zones 5 (MZE5)Extended version of MZE script.
This indicator can be set up for 5 different tickers, so you can fill up your favourite tikers as fixed and switch between them without changing settings options of Tick Count, Margin and POC
Using option "Show default Zones if not Matched" - you can set up default options,
switching off "Show default Zones if not Matched" - will hide indicator for not matched tikers
By default option is Off
RUS:
Расширенная версия индикатора MZE, которая позволяет сделать настройки одновременно для 5 разных тикеров, соответственно переключаясь между отслеживаемыми тикерами не нужно каждый раз менять настройки. Достаточно один раз настроить базовые настройки к любимым тикерам и только корректировать значение Маржи и Обеспечения.
Используя Опцию "Show default Zones if not Matched" ("Показывать, когда нет совпадения") - индикатор будет отображаться для всех тикеров с настройками по умолчанию.
И наоборот (по умолчанию): при снятой галочке - индикатор будет отображаться только на тех тикерах, к которым привязан, и не будет мешать на остальных
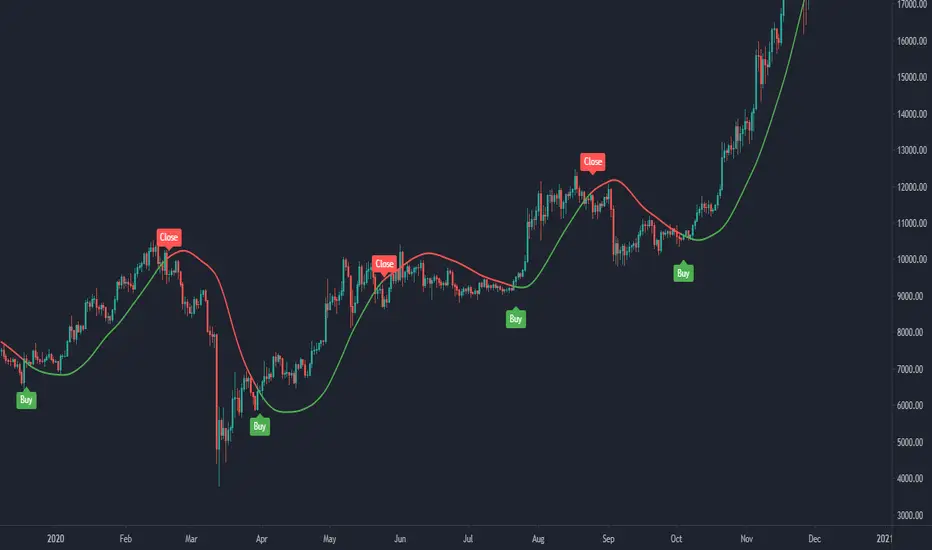
Target Zones & RibbonsTrend based on moving averages, indicated by ribbon, and profit zones based on re-tracement zones of Fibonacci.
Target Zones
- 38% is TP1 - first line break
- 62% is TP2 - second line break
Ribbon can be used to identify the trend:
-Price action below ribbon is bearish
-Price action above is bullish
-Price will likely bounce off ribbon once for a continuation of trend, unless trends breaks ribbon, signals for reversal.
Please PM me for use, testing only.
This indicator is meant to be used with the following.

🚀 Alpha_Century_X 🚀 - Hunting Zone - Silent Whale v12This indicator is very simple,
it shows where the liquidity is.
When it goes up more than 0.5,
that means a huge squeeze of the market is coming.
In other words, it's time to scalp for the big profit.
What you need to do is that focus on the red zone,
and give up the blank and black zone.
Easy to use.

Demand/Supply ZonesThis script will draw the supply and demand zone so you can always enter the best places. Cheap stop-loss and BIG Take Profits.
I will leave the scripts available during the weekend and if you want it, send me a message.
Leo Hermoso
Kill Zone Box ASIA LONDRES NYCBox of good time zones to make trade in each session of the market, I can set the time, colors. Mark the high and low of the day and leave the mark to review the day after.

[AU] Zones// Zones v1
//References:
//@chrysopoetics:
//@chrysopoetics:
v1 of Zones; Default lengths for Anchor Zones subject to change/refinement for specific timeframes in the future

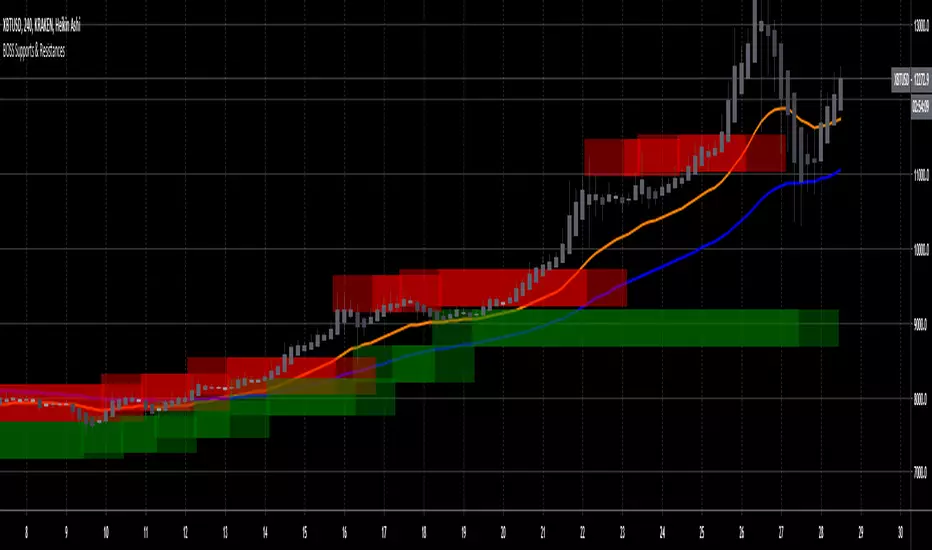
Boss Support and Resistance zonesTHE BEST FOREX, BINARY OPTIONS, AND CRYPTO INDICATORS FOR TRADINGVIEW.COM
Green = Support Zones
Red = Resistance Zones
The basic trading method for using support and resistance is to buy/long near support in uptrends, and to sell/short near resistance in downtrends.
Also included in this indicator are a Higher High, Lower High, Higher Low, and Lower Low indicator as well as Fast and Slow EMA'S
Available at bosscripts.com
Website bosscripts.com
Demand and Supply Zones indicatorThis Script automatically marks Demand and Supply Zone on the chart

Donochian zonesThis indicator give the ratio between the high and low of donochian channel and if we take ratio and add it to each other then we can calculate if it + meaning bullish trend or negative meaning bearish trend
using non repainting MTF we can see the zone of the channel at different time set
we can use this indicator to filter bad signal or make it stand alone
here example of amazon stock with 360 min mtf over one hour graph
here facebook 240min over 15 min graph

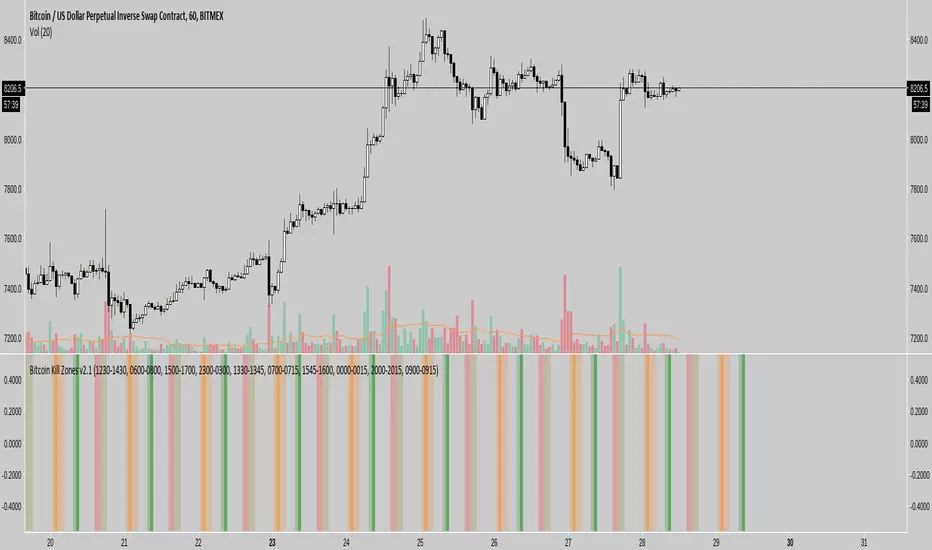
Bitcoin Kill Zones v2 [oscarvs] (UTC + 8)The Kill Zone script was modified to UTC + 8, Singapore to Beijing time.
