Ichimoku MTF Heatmap WITH ALERT meeting D and W conditionsThis is a version of the Ichimoku Cloud Heatmap but adds a can't miss alert when it meets Daily and Weekly conditions. The cloud metric is still being refined and the qualifier is ignoring just the cloud for now. As of 12/21/2025 GLD is meeting the conditions to set this flag.
Candlestick analysis

ORB 5 Min Break & Retest + Alerts By Khan 0.1 verORB 5-Minute Break & Retest Indicator
This indicator plots the high and low of the first 5-minute candle of the trading session (Opening Range). It then monitors price for a breakout above or below the ORB levels and triggers an alert when price retests the broken level and holds.
Designed to help identify high-probability ORB continuation setups with clear visual levels and TradingView alerts.

diy OKX:BTCUSDT26Z2025
diyBuy-sell signal
Visual display of indicators simplification
买卖信号显示
直观显示指标简化

Main line in K-line trend indicator
Main line in K-line trend indicator
The chart must be pinned. Otherwise, the chart coloring cannot be seen.
主线在k线染色趋势指标
图表必须置顶。不然看不到图表染色

JokerStyle 🤡 Joker Style Indicator
Welcome to Joker Style — where the market stops acting normal… and starts telling the truth.
This indicator is built for one purpose:
finding clean, repeatable opportunities when liquidity gets trapped and panic kicks in.
No clutter.
No guessing.
No overthinking.
Just one timeframe, one time of day, and clear rules.
⸻
🕘 How to Use It
• Timeframe: 1 minute
• Time: 9:45 AM (New York time)
• Track the first 15-minute range
• Let the market sweep liquidity
• When the 🤡 appears — that’s your signal
BUY and SL levels are drawn automatically.
You manage risk — the indicator handles structure.
⸻
💰 Opportunities & Risk
• Opportunities appear almost every trading day
• Some days you’ll see multiple setups
• Minimum target: 4:1 Risk–Reward
• 8:1 RR is realistic and often achievable when momentum expands
This isn’t about tiny scalps.
It’s about catching the real move.
⸻
🤡 What Makes It Different
• Combines liquidity sweeps, precision entries, and fair value gaps
• Bullish and bearish logic never fight each other
• One active setup at a time — clean, focused, intentional
• Built specifically for high-volatility open conditions

Automatic chart pattern recognition, channel, wedge, triangle. OKX:BTCUSDT26Z2025
Automatic chart pattern recognition, channel, wedge, triangle.
自动图表形态识别,通道、楔形、三角形

Volume package OKX:BTCUSDT26Z2025
Volumn heat map, can clearly see more than 1.5 times 2.5 or 3.5. The parameters can be changed by yourself Chinese version. Color customization. Added moving average filtering. When the volume is greater than 1.5 times, an alarm can be set. Explain that the volume is large
成交量热图,能明显看到大于1.5倍数2.5或者3.5。参数可以自行改。中文版本。颜色自定义。加了均线过滤。当成交量大于1.5倍时,可以警报。说明成交量大

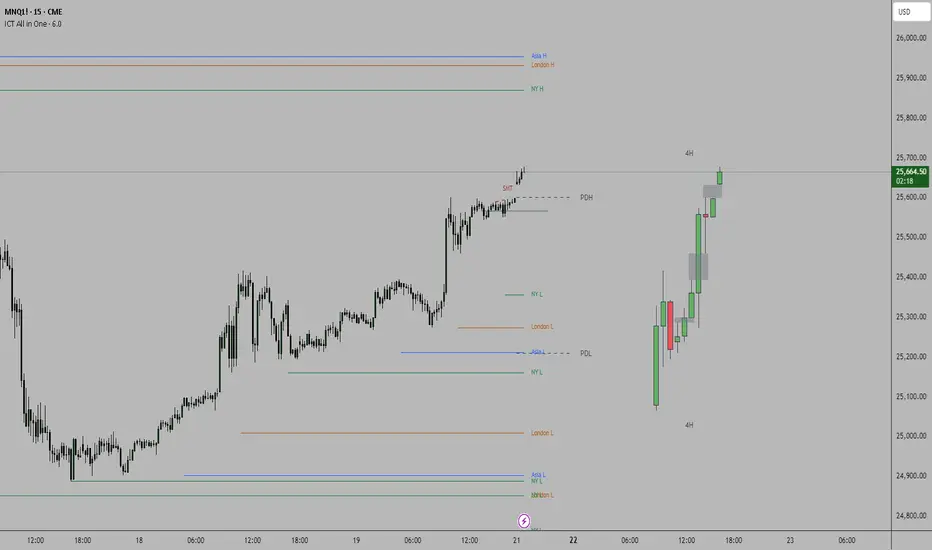
ICT all in oneSessions, PDH, PDL, High Time Frame Candles and Inversion Fair Value gap detector.
This indicator helps detect FVG's on the higher time frame for you to mark with the HTF candles.
Helps see Session sweeps, Small SMT's, Previous day high and low and one Inversion closes to price on the current time frame for possible entry.
Body Close Continuity & failure Backtesting @MaxMaseratiThis indicator, is a highly advanced institutional-grade tool designed to track the "lifespan" of a trend based on Body Close (BC) sequences.
Unlike basic indicators that just show direction, this script analyzes the structural integrity of a trend by monitoring how many candles continue the move before a "Touch" (retest) or a "Break" (failure) occurs.
The Continuity & Failure Stats indicator tracks sequences of Bullish Body Closes (BuBC) and Bearish Body Closes (BeBC). It measures three critical phases: Building (pure momentum), Touching (price retesting the low/high of the sequence), and Resumption (price continuing the trend after a retest). It provides a statistical distribution of how long these "buildings" typically last before failing, allowing traders to know exactly when a trend is overextended.
This comprehensive analysis blends the statistical breakdown of the Continuity & Failure Stats indicator to provide a deep understanding of the structural momentum for the S&P 500 E-mini (ES1!) on a 4-hour timeframe.
1. Extensive Table Breakdown
A. Building Distribution (Left Table): The Fatigue Gauge
This table acts as a histogram of momentum, tracking the "Building Count"—the number of consecutive candles closing in a trend without price returning to its origin.
Count Column: Represents the streak length (e.g., 1, 2, or 3 candles).
Touch Column: Shows how many times a streak was interrupted by a retest ("touch") but remained structurally intact.
Break Column: Counts total structural failures where price closed beyond the sequence's anchor.
Data Insight: For BuBC, 92 sequences reached Count 1, but only 28 remained by Count 4. This reveals a steep momentum decay after the 3rd candle, establishing a "Statistical Wall" where only 2 sequences in history reached a count of 9.
B. MMM Summary Stats (Top Right): The Mathematical DNA
This table provides the "Expected Value" and behavior of a trend over the lookback period.
Avg Building (2.39 for BuBC): On average, a bullish move lasts ~2.4 candles of pure momentum before a retest or reversal occurs.
Avg Touches (0.8): This low number indicates "clean" trends that rarely wobble back to retest levels multiple times before reaching a conclusion.
Avg R Cycles (0.55): This suggests that once a bullish trend is interrupted, it only successfully resumes its momentum about half the time.
Max R Count (1): Typically, once a trend is "touched," it only manages one more push before failing.
C. Multi-Timeframe (MTF) Quick Stats (Bottom Right): Trend Weight
This compares the 4H chart against other layers of the market to identify "global" alignment.
Sample Comparison: There are 3,594 tracked BuBC sequences on the 4H compared to only 142 on the Weekly chart.
Fractal Law: The Avg Building (2.4) is consistent across several timeframes, implying that the "Rule of Three" (momentum fading after 3 candles) is a fractal characteristic of this asset.
2. Table Comparison: Synthesizing the Data
To trade effectively, you must compare Distribution (timing) against Summary Stats (averages):
Continuity vs. Failure: The Summary Stats show an average building of 2.39. When checking the Distribution table at Count 2, the "Break" count (58) is already high relative to the "Total". This confirms that the risk of failure increases exponentially the moment you exceed the average.
Momentum vs. Mean Reversion: Distribution tells you when a trend is "tired". If the 4H is at a "Building Count 4" (statistically overextended) while the Weekly chart is at "Building Count 1" (fresh momentum), you may choose to prioritize the higher timeframe's strength despite the local overextension.
3. Strategic Summary & Application
This indicator proves that market momentum follows a predictable "Building" cycle rather than an infinite streak.
The "Rule of Three" for ES1! 4H:
The Entry Zone (Momentum Start): The most profitable entries occur at Building Count 1. Statistically, you have a high probability of reaching a count of 2 or 3.
The Exit Zone (Momentum Limit): Take profits or tighten stops at Count 3. The data shows the sample size drops by nearly 50% between Count 3 and Count 4.
The "Touch" Rule (Retest Reliability): If price returns to the sequence low (a "Touch"), do not expect a massive continuation. The Max R Count of 1 tells us that resumptions are usually short-lived.
Danger Zone: Entering at Building Count 4 or higher is statistically dangerous, as the "Break" probability significantly outweighs the "Touch" or continuation probability.

Daily Candle Bias Backtesting Stats @MaxMaserati This indicator, is a powerful backtesting and probability tool designed to quantify the "follow-through" of specific candle types across different market sessions.
It identifies specific price action setups and tracks whether price hits a "Target" (continuation) or an "Invalidation" (reversal) first, providing real-time win rates for your favorite sessions.
The Candle Bias Stats indicator automatically categorizes every candle based on the MMM candle bias and tracks their historical success rate. It calculates how often a candle's high/low is broken before its opposite end is touched. By breaking this data down into sessions (Asian, London, NY), it identifies high-probability "time-of-day" windows where specific price action setups are most reliable.
MMM CANDLE LOGIC
Bullish Expansion & Breakout Signatures
Bullish Body Close Plus (BuBC Plus): Represents strong bullish momentum where price closes above the previous high and near its own top, signaling that buyers are in complete control.
Bullish Body Close Minus (BuBC Minus): Indicates weak bullish momentum; while the price closes above the previous high, a long top wick shows sellers pushed back, suggesting a potential retest of the previous high.
Bearish Expansion & Breakout Signatures
Bearish Body Close Plus (BeBC Plus): A very strong bearish signal where price closes below the previous low and near its own bottom, indicating sellers are dominant.
Bearish Body Close Minus (BeBC Minus): Signifies weak bearish momentum; the price breaks the previous low but finishes with a long bottom wick as buyers push back, often leading to a retest of the old ceiling.
Bullish Reversal & Trap Signatures (Affinity)
Bullish Affinity Plus (BuAF Plus): A strong bullish reversal where a new low is made, but sellers hit a wall and get trapped, causing price to finish near its top with a long bottom wick.
Bullish Affinity Minus (BuAF Minus): A weak bullish bounce where a new low is made and price finishes back inside the previous range, but buyers lack the energy for a significant move.
Bearish Reversal & Trap Signatures (Affinity)
Bearish Affinity Plus (BeAF Plus): A strong bearish reversal; buyers are trapped after making a new high, and price finishes near its bottom with a long top wick.
Bearish Affinity Minus (BeAF Minus): A weak bearish drop where sellers stop the rise but lack the energy to push price significantly lower.
Neutral & Volatility Signatures
Close Inside Bullish (CI•BuAF): Bullish neutral state where price stays inside the previous candle’s range but finishes in the top half, indicating buyers are slightly more active.
Close Inside Bearish (CI•BeAF): Bearish neutral state where price remains inside the previous box and finishes in the bottom half.
Seek & Destroy Bullish (S&D•BuAF): Bullish volatility characterized by price moving above and below the previous candle before buyers win the battle and close price near the top.
Seek & Destroy Bearish (S&D•BeAF): Bearish volatility where sellers win a high-chaos battle, closing price near the bottom after sweeping both sides of the previous candle.
H4 CANDLE EXAMPLE
Deep Dive: Analysis of the 4H Statistics
The image presents a comprehensive backtest of 4,999 total candles from September 2022 to December 2025. Here is the breakdown of what the interface is telling us:
1. The Strategy: Target vs. Invalidation
The indicator tracks BuBC (Bullish Body Close) and BeBC (Bearish Body Close).
The Target: For a Bullish candle, the target is the High. For a Bearish candle, it is the Low.
The Invalidation: The opposite end of the candle (the Low for Bullish, the High for Bearish).
The Goal: To see which level is touched first in the subsequent bars.
2. Global Performance (The Top Right Table)
Looking at the BuBC (1402 samples) section:
Target First (67.8%): In nearly 7 out of 10 cases, once a 4H candle closes "bullish" (breaking the previous high), the price continues higher to break its own high before it ever returns to take out its own low.
Both Hit (17.7%): This is a critical metric. It represents "Stop Runs" or "Wicks" where price hits the target but also hits the invalidation within the same tracking period.
Efficiency (1.3 Bars): This tells us the "follow-through" is almost immediate. If the trade doesn't work within 1 or 2 candles, the statistical edge drops off significantly.
3. The Session Breakdown (The Bottom Left Table)
This is where the "Edge" is found. Not all hours of the day are created equal.
Asian Late (02:00-06:00) – The "Star" Performer: With a 72.9% Target rate, this is labeled "BEST." It has the lowest "Both%" (6.5%), meaning moves during these hours are incredibly "clean." If a setup forms here, price usually moves directly to the target without looking back.
London Open & Overlap (06:00-14:00): These sessions maintain a high win rate (approx. 70%). This suggests that the European session provides reliable trend continuation for the S&P 500.
NY Session (14:00-18:00) – The "Trap" Zone: This is labeled "WORST" for a reason. While the win rate is basically a coin flip (49.6%), the Both% spikes to 36.7%. This means that even if you are right about the direction, the market is highly likely to "sweep" your stop loss before going to the target. It is the most volatile and "fake-out" prone time for this specific setup.
Summary of the Data
The statistics show that the S&P 500 4H Candle Bias is a highly reliable trend-following indicator, provided you trade it at the right time.
The data suggests a clear three-step logic:
Directional Edge: Both Bullish and Bearish body closes have a natural ~67% probability of continuation.
Timing is Everything: Trading during the Late Asian and London sessions increases your probability of success to over 70% with very low risk of a "fake-out."
Risk Warning: Avoid "Body Close" breakout strategies during the NY Mid-day (14:00-18:00). The statistics prove that this window is dominated by "Seek and Destroy" price action, where price is mathematically likely to hit both your target and your stop, usually hitting the stop first.

SMC SNI LAP ULTRA This indicator is a multi-tool market-structure and confluence signal assistant designed for EDUCATIONAL PURPOSES ONLY. It combines Smart Money Concepts (SMC) and classic technical confirmations to help visualize context, zones, and potential trade ideas.
What it shows
• Market Structure: Swing/Internal pivots, BOS / CHoCH / MSS labels and structure lines
• Liquidity Concepts: EQH/EQL style areas and liquidity sweep detection (when enabled)
• Zones & Areas of Interest: Supply/Demand, Order Blocks (OB), Fair Value Gaps (FVG) and key levels (depending on settings)
• Confirmation Tools: Pin bar / engulfing patterns, RSI-based filters and optional divergence
• Confluence Scoring (AI-like): A rule-based scoring system that weights multiple conditions (trend alignment, momentum strength, volume spike, sweep, zone location, RR quality, etc.)
• Risk Visualization: Optional Entry / TP / SL guide lines based on selected TP/SL modes and RR settings
• Alerts: Optional alerts that can be used for notifications or webhook integrations (signals only)
About “AI” / Scoring
The “AI” features in this script are NOT machine learning and do NOT predict the future. They are rule-based calculations that assign a score from multiple factors and track simple win/loss statistics based on user-defined TP/SL logic. Results depend on market conditions and your settings.
Important Disclaimer
This indicator does NOT provide financial advice and does NOT guarantee profits. Trading involves risk and you can lose money. Any signals, scores, or projections are informational and for research/testing only. Always do your own analysis, manage risk properly, and consider using a demo account for evaluation.
Recommended Use
Use it as a context tool:
1) Identify structure (BOS/CHoCH) and trend bias
2) Mark zones (OB/FVG/Supply-Demand)
3) Wait for confirmation (candle patterns, RSI/divergence, volume, etc.)
4) Use the scoring as a filter—not as a guarantee
If you need automated execution, connect alerts to your own external system at your own responsibility. This script itself is an indicator (not an auto-trading system).

Sigma Levels😎 How to Use Sigma Levels (Gold & Crude Only)
Sigma Levels are not magic buttons.
If you click Buy or Sell the moment price touches a line…
Congratulations — you’ve just donated liquidity to the market.
⚠️ Works ONLY for Gold (XAUUSD) and Crude Oil (WTI / USOIL / CL)
🧠 The Right Way (Sigma Way)
These levels are waiting zones, not entry alarms.
When price reaches a Sigma Level:
Sit on your hands
Watch the candles
Wait for price to speak first
Only consider an entry AFTER you see proper confirmation, such as:
Hammer or Inverted Hammer saying “nope, not going further”
Bullish or Bearish Engulfing that actually engulfs (not politely taps)
Morning Star / Evening Star waking the market up
Strong rejection wicks screaming “wrong direction”
❌ What NOT to Do
No blind entries
No guessing
No “it feels like it will reverse”
No revenge trades because the last one hurt your feelings
✅ Sigma Rule
Levels tell you where to look
Candles tell you when to act
No pattern = no trade
Patience = profit potential
Trade calm. Trade disciplined.
Let Sigma Levels do the waiting — not your stop-loss.

PSP 4H USD Divergence Highlighter (EURUSD + GBPUSD vs DXY)PSP indicator for the 4H chart. This compares the divergence between the EURUSD, GBPUSD, & DXY

Overnight Gap - Close to Open - TF PascalCalculates the percentage change in the opening price of the candle above relative to the closing price of the previous candle.
Not available for S&P500 CFDs.
Can be used for cash prices such as TVC's SPX for the S&P500.

Manipulation Candle (RIC) V0.2Interpretation and Trading Use
Boxed Candles: Represent 15-minute periods with unusually high range relative to daily volatility. These may signal:
Market manipulation (e.g., stop hunts or fakeouts).
Breakouts, reversals, or high-impact news.
Entry/exit points in strategies focusing on volatility expansion.
No Boxes: Indicates normal or low-volatility candles (range < threshold).
Multi-Timeframe Analysis: On lower timeframes (e.g., 5-min), boxes encompass multiple bars. On higher (e.g., 1-hour), they highlight specific 15-min segments.
Example: On a volatile stock like TSLA, a 0.2 multiplier might highlight candles during earnings releases, aiding in spotting trading opportunities.
Limitations and Considerations
Drawing Limits: TradingView caps drawing objects at ~500 per script. On long histories, older boxes may not load—zoom in or reduce chart bars.
Data Availability: Requires 15-minute and daily data; may not work on illiquid symbols or non-standard charts (e.g., Renko).
Real-Time Delays: Boxes appear only after 15-min closes; no intra-bar drawing.
No Alerts Built-In: Add custom alerts via TradingView's alert system (e.g., on condition changes).
Performance: Efficient, but on very low timeframes with long history, it may use more resources due to persistent boxes.
Customization: For extensions (e.g., labels, multiple timeframes), modify the code carefully in Pine Script® v6 to avoid errors.
Version History
V0.2: Added persistent historical boxes; refined new candle detection.
Future Updates: Potential additions like box limits or multi-multiplier support. Check for updates in the script comments.
If you encounter issues or need customizations, refer to TradingView's Pine Script® documentation or community forums. For error-free extensions in Pine Script® v6, ensure proper variable scoping, type declarations, and testing on historical data.

The Apex01This is a proprietary technical indicator developed by The Apex Trading Firm. It utilizes a custom trend-following logic based on momentum filtering. This script is strictly for internal use by authorized firm personnel only. Unauthorized distribution is prohibited."

High Vol Big Move (Up or Down)Nine million EP with 4% stock moved up or down, and today's volume is more than yesterday's volume.

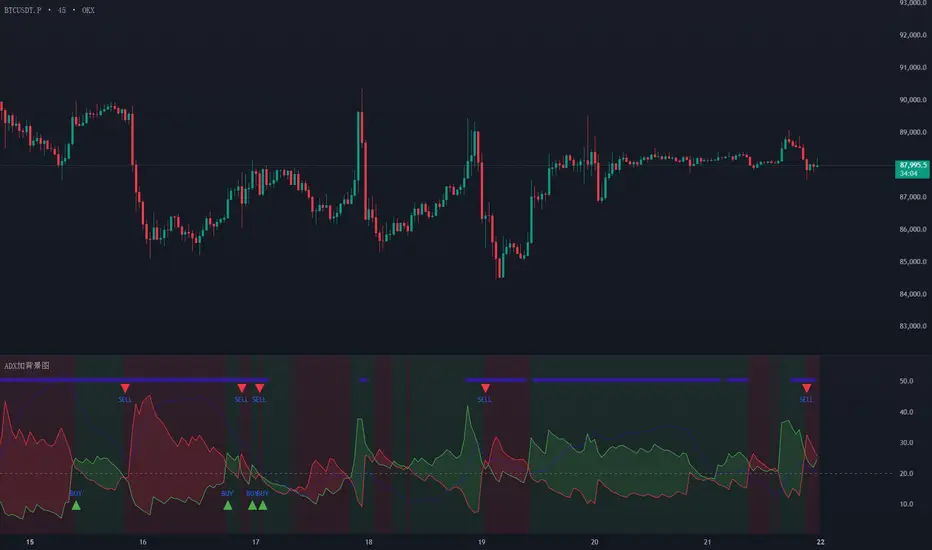
ADX has added a background image, which clearly shows the long a OKX:BTCUSDT26Z2025
ADX加了背景图,可以清楚的看到,多空信号
ADX has added a background image, which clearly shows the long and short signals
MACD deviation MACD deviation,MACD with divergence can be clearly seen, there is no need to draw it again
MACD带背离,可以很明显的看到背离,不用再画

EMA 1 & SALMA Intersection StrategyTrading Strategy: EMA 1 & SALMA Crossover System
This strategy is a Trend-Following system that focuses on the direct interaction between the price (represented by EMA 1) and a smoothed trendline (SALMA). Instead of relying on the color changes of the indicator, it uses mechanical crossover signals to enter and exit trades.
1. Indicators Used
EMA 1 (Exponential Moving Average): Since the period is 1, it effectively represents the Current Price. It reacts instantly to every market move.
SALMA v3.0 (Smoothed Adaptive Lattice Moving Average): A double-smoothed moving average that acts as the "Base Line" or "Trend Support/Resistance."
RSI (Relative Strength Index): Used as a Momentum Filter to ensure we don't trade against the market's strength.
2. Buy (Long) Entry Rules
You enter a Long position when the following conditions are met:
The Crossover: The EMA 1 (Price) crosses ABOVE the SALMA line. This indicates that the short-term momentum is shifting higher than the average trend.
The Filter (RSI): The RSI must be above 50. This confirms that the buyers are in control and the upward move has enough strength.
3. Sell (Short) Entry Rules
You enter a Short position when the following conditions are met:
The Crossunder: The EMA 1 (Price) crosses BELOW the SALMA line. This indicates a breakdown in price action.
The Filter (RSI): The RSI must be below 50. This confirms that the sellers are dominating and the downward momentum is real.
4. Key Advantages of This System
Objectivity: You don't guess based on the color of the line; you wait for a clear physical break (cross) of the line.
Precision: By using EMA 1, you get the earliest possible entry signal compared to slower moving averages.
False Signal Protection: The RSI 50 filter prevents you from entering "weak" trades where the price crosses the line but lacks the volume or momentum to continue.

Price Action High 2 + Risk/Reward VisualizerIntroduction: Price Action High 2 (Bull Flag) Setup
This script identifies the High 2 (H2) setup, a staple price action pattern popularized by Al Brooks. The High 2 is a high-probability continuation pattern designed to catch the resumption of a bull trend after a two-legged pullback (a "complex" bull flag).
In a strong uptrend, the first attempt to end a pullback often fails (High 1). The High 2 represents the second, and usually more reliable, attempt by bulls to take control, often forming a "double bottom" structure within the flag.
How the Logic Works
The indicator follows a strict state-machine logic to ensure the pattern is valid:
Trend Confirmation: The script filters for an established uptrend where price is above a rising EMA (adjustable in settings).
Pullback Identification: It looks for a sequence of bars making lower highs.
High 1 (H1): The first bar in the correction that breaks above the high of the prior bar.
The Second Leg: The script then waits for the price to again fail to break a high, confirming a second leg of the pullback.
High 2 (H2): The signal is triggered when a bar breaks the high of the previous bar for the second time.
Key Features
Signal Bar Quality Filter: Not all High 2s are equal. This script includes a filter ensuring the signal bar closes in the upper portion of its range (bullish conviction) to avoid "weak" breakouts.
Automated Risk/Reward Visualizer: Upon a signal, the script automatically projects a Stop Loss (at the signal bar low) and a Take Profit level based on a customizable R:R ratio.
Clean Visuals: Labeled "H2" markers and dashed trend lines keep the chart uncluttered.
How to Trade It
Entry: Place a buy-stop order 1 tick above the High 2 signal bar.
Stop Loss: Traditionally placed below the low of the signal bar or the most recent swing low.
Target: Common targets include a 1:2 Risk/Reward ratio or the previous major swing high.
Settings Guide
EMA Length: Adjust this to match your timeframe (e.g., 20 for intraday, 50 for daily).
Min Close %: Set this to 50% or higher to ensure you only take trades where the bulls finished the bar strong.
Risk:Reward Ratio: Customize your profit targets to align with your personal trading plan.

9:30 AM EST 5-Min Candle High/Low LinesThis will draw a horizontal line on the highs and lows of the first 5 min candle of the day. both lines will extend until 1 PM EST that same day.

ICT Liquidity Sweep/Swing Fail Pattern V.1# ICT Liquidity Sweep/Swing Fail Pattern V.1
## Indicator Description & User Guide
---
## 📊 Indicator Overview
**Name:** ICT Liquidity Sweep/Swing Fail Pattern V.1
**Type:** Support/Resistance & Liquidity Detection
**Trading Style:** ICT Concepts (Inner Circle Trader)
**Best Timeframes:** 1M, 5M, 15M, 1H
---
## 🎯 Core Features
### 1. **Support & Resistance Lines**
- Automatically draws key swing high and swing low levels
- Based on significant pivot points in price structure
- Updates dynamically as new swings form
### 2. **"X" Mark - Liquidity Sweep**
- **Symbol:** X marker on chart
- **Meaning:** Indicates a liquidity sweep (stop hunt)
- **What it shows:** Price briefly moved beyond a key level to trigger stops, then reversed
- **Trading significance:** High-probability reversal zones after liquidity is taken
### 3. **"SFP" Label - Swing Failure Pattern**
- **Symbol:** SFP text label
- **Meaning:** Swing Failure Pattern detected
- **What it shows:** Price attempted to make a new high/low but failed and reversed sharply
- **Trading significance:** Strong reversal signal - smart money rejecting the level
---
## 📈 How to Use This Indicator
### Entry Setup Strategy:
#### **For SHORT Trades (Sell):**
1. Wait for **SFP** to appear at a swing high
2. Look for **X marker** confirming liquidity sweep above the high
3. **Entry Zone (Red Box):** Enter SHORT positions when price returns to this zone
4. **Stop Loss:** Place above the red zone (above the swept high)
5. **Take Profit (Green Box):** Target the green zone below
#### **For LONG Trades (Buy):**
1. Wait for **SFP** to appear at a swing low
2. Look for **X marker** confirming liquidity sweep below the low
3. **Entry Zone (Green Box):** Enter LONG positions when price returns to this zone
4. **Stop Loss:** Place below the green zone (below the swept low)
5. **Take Profit (Red Box):** Target the red zone above
---
## 🎨 Color Coding System
| Color | Zone Type | Usage |
|-------|-----------|-------|
| 🔴 **Red Box** | Stop Loss / Supply Zone | Place SL here for LONG trades / Entry zone for SHORT trades |
| 🟢 **Green Box** | Take Profit / Demand Zone | Target zone for LONG trades / Place SL here for SHORT trades |
| ❌ **X Mark** | Liquidity Sweep Point | Stop hunt occurred - reversal likely |
| 📝 **SFP Label** | Swing Failure Pattern | Failed breakout - strong reversal signal |
---
## 💡 Trading Examples
### Example 1: SHORT Trade (As shown in your chart)
```
1. SFP appears at swing high (Red zone around 4,000)
2. X marker confirms liquidity sweep above the high
3. Entry: SHORT when price re-enters red zone
4. Stop Loss: Above red zone (e.g., 4,002)
5. Take Profit: Green zone below (3,964-3,972)
6. Risk:Reward = 1:3+
```
### Example 2: LONG Trade
```
1. SFP appears at swing low (Green zone)
2. X marker confirms liquidity sweep below the low
3. Entry: LONG when price re-enters green zone
4. Stop Loss: Below green zone
5. Take Profit: Previous red zone above
6. Risk:Reward = 1:2 minimum
```
---
## ⚠️ Important Trading Rules
### ✅ DO:
- Wait for BOTH SFP and X marker confirmation
- Enter on price returning to the zone (not on first touch)
- Use proper position sizing (1-2% risk per trade)
- Combine with market structure analysis
- Look for confluences (orderblocks, fair value gaps)
### ❌ DON'T:
- Trade against the higher timeframe trend
- Enter without confirmation signals
- Ignore the colored zones for SL/TP placement
- Overtrade - wait for quality setups
- Move stop loss to breakeven too early
---
## 🔧 Indicator Settings (Typical)
**Adjustable Parameters:**
- Swing Length: Number of bars to identify swing points
- Show/Hide X markers
- Show/Hide SFP labels
- Zone opacity and colors
- Line thickness
---
## 📚 ICT Concepts Explained
### **Liquidity Sweep:**
Smart money intentionally pushes price beyond key levels to trigger retail stop losses, then reverses to their intended direction. The X marker identifies these moments.
### **Swing Failure Pattern (SFP):**
Price attempts to make a new high/low but lacks follow-through, indicating weak momentum and likely reversal. Similar to a "false breakout" but more specific to swing structures.
### **Supply & Demand Zones:**
- **Red zones** = Areas where selling pressure overwhelmed buyers
- **Green zones** = Areas where buying pressure overwhelmed sellers
- These zones act as magnets for price to return and react
---
## 🎓 Best Practices
1. **Confluence is Key:**
- Combine with daily/weekly bias
- Check for orderblocks nearby
- Look for imbalances (FVG)
2. **Session Timing:**
- Best during London/New York sessions
- Avoid low liquidity periods
3. **Risk Management:**
- Never risk more than 1-2% per trade
- Use proper lot sizing
- Take partial profits at key levels
4. **Timeframe Correlation:**
- Check higher timeframe for bias
- Enter on lower timeframe for precision
- Exit based on higher timeframe targets
---
## 📞 Support & Updates
**Version:** 1.0
**Compatibility:** TradingView Pine Script v5
**Updates:** Regular improvements based on ICT methodology
---
## ⚡ Quick Reference Card
| Signal | Action | SL Placement | TP Target |
|--------|--------|--------------|-----------|
| SFP + X at High | SHORT at Red Zone | Above Red | Green Zone |
| SFP + X at Low | LONG at Green Zone | Below Green | Red Zone |
**Remember:** The indicator shows you WHERE to trade, but YOU decide WHEN based on confirmation and market context.
---
*Disclaimer: This indicator is a tool for technical analysis. Always use proper risk management and never trade with money you cannot afford to lose.*
