Trend Finder - Buy/Sell (Anuj Edition)Renko Trend Finder – Anuj Edition is a powerful trend-following tool designed to detect market direction using Renko logic instead of traditional candlesticks.
Renko filtering removes market noise, making trends clearer and reversals easier to identify.
This indicator internally builds Renko-style price movement and generates clean, high-quality Buy and Sell signals without repainting.
Candlestick analysis

Trend Finder - Buy/Sell (Anuj Edition)Renko Trend Finder – Anuj Edition is a powerful trend-following tool designed to detect market direction using Renko logic instead of traditional candlesticks.
Renko filtering removes market noise, making trends clearer and reversals easier to identify.
This indicator internally builds Renko-style price movement and generates clean, high-quality Buy and Sell signals without repainting.

Greater Moving AverageThe purpose for this indicator is to function as a comprehensive market-state detector, with the primary goal of avoiding a market crash.
Mendoza Lines (V-pattern detection) identify early crash conditions and warn when market structure becomes unstable.
RSI/volume-shaded candles + Supertrend confirm momentum and trend, creating a unified system to avoid major drawdowns.
Enhanced Wyckoff ranges with ATR.
Mendoza lines identify abrupt V-shaped reversals which often precede high-risk crash structures. By tracking both the formation and resolution of these patterns across multiple timeframes, the indicator provides early warning signals when the market is entering unstable territory, allowing traders to step aside before liquidity collapses or structural breakdowns begin.
Ideal configurations use Heikin Ashi to smooth out candle structure. Observe SPX on a Weekly Chart, which correctly identifies exits and entries during the 2001 and 2009 crashes. On a 6 hour chart, the Tariff low is correctly identified. The improved VWAP uses a cumulative metric rather than the built in ta.vwap calculation, and functions as a macro low beacon when crossed with the 200 EMA. Historically, these crosses have aligned closely with macro cycle lows.
To round out the system, the indicator overlays RSI-based and volume-weighted candle shading to reflect internal momentum and real buying/selling pressure directly on the chart, making shifts in strength immediately visible. A Supertrend confirmation layer acts as the final filter, smoothing noise and verifying trend direction before decisions are made.

Squeeze Fire Arrows (on Price)This script plots when the squeeze fires. It was built by modifying using the Lazybear Squeeze Momentum code

FVG Maxing - Fair Value Gaps, Equilibrium, and Candle Patterns
What this script does
This open-source indicator highlights 3-candle fair value gaps (FVGs) on the active chart timeframe, draws their midpoint ("equilibrium") line, tracks when each gap is mitigated, and optionally marks simple candle patterns (engulfing and doji) for confluence. It is intended as an educational tool to study how price interacts with imbalances.
3-candle bullish and bearish FVG zones drawn as forward-extending boxes.
Equilibrium line at 50% of each gap.
Different styling for mitigated vs unmitigated gaps.
Compact statistics panel showing how many gaps are currently active and filled.
Optional overlays for bullish/bearish engulfing patterns and doji candles.
1. FVG logic (3-candle gaps)
The script focuses on a strict 3-candle definition of a fair value gap:
Three consecutive candles with the same body direction.
The wick of candle 3 is separated from the wick of candle 1 (no overlap).
A bullish gap is created when price moves up fast enough to leave a gap between candle 1 and 3. A bearish gap is the mirror case to the downside.
In Pine, the core detection looks like this:
// Three candles with the same body direction
bull_seq = close > open and close > open and close > open
bear_seq = close < open and close < open and close < open
// Wick gap between candle 1 and candle 3
bull_gap = bull_seq and low > high
bear_gap = bear_seq and high < low
// Final FVG flags
is_bull_fvg = bull_gap
is_bear_fvg = bear_gap
For each detected FVG:
Bullish FVG range: from high up to low (gap below current price).
Bearish FVG range: from low down to high (gap above current price).
Each zone is stored in a custom FVGData structure so it can be updated when price later trades back inside it.
2. Equilibrium line (0.5 of the gap)
Every FVG box gets an optional equilibrium line plotted at the midpoint between its top and bottom:
eq_level = (top + bottom) / 2.0
right_index = extend_boxes ? bar_index + extend_length_bars : bar_index
bx = box.new(bar_index - 2, top, right_index, bottom)
eq_ln = line.new(bar_index - 2, eq_level, right_index, eq_level)
line.set_style(eq_ln, line.style_dashed)
line.set_color(eq_ln, eq_color)
You can use this line as a neutral “fair value” reference inside the zone, or as a simple way to think in terms of premium/discount within each gap.
3. Mitigation rules and styling
Each FVG stays active until price trades back into the gap:
Bullish FVG is considered mitigated when the low touches or moves below the top of the gap.
Bearish FVG is considered mitigated when the high touches or moves above the bottom of the gap.
When that happens, the script:
Marks the internal FVGData entry as mitigated.
Softens the box fill and border colors.
Optionally updates the label text from "BULL EQ / BEAR EQ" to "BULL FILLED / BEAR FILLED".
Can hide mitigated zones almost completely if you only want to see unfilled imbalances.
This allows you to distinguish between current areas of interest and zones that have already been traded through.
4. Candle pattern overlays (engulfing and doji)
For additional confluence, the script can mark simple candle patterns on top of the FVG view:
Bullish engulfing — current candle body fully wraps the previous bearish body and is larger in size.
Bearish engulfing — current candle body fully wraps the previous bullish body and is larger in size.
Doji — candles where the real body is small relative to the full range (high–low).
The detection is based on basic body and range geometry:
curr_body = math.abs(close - open)
prev_body = math.abs(close - open )
curr_range = high - low
body_ratio = curr_range > 0 ? curr_body / curr_range : 1.0
bull_engulfing = close > open and close < open and open <= close and close >= open and curr_body > prev_body
bear_engulfing = close < open and close > open and open >= close and close <= open and curr_body > prev_body
is_doji = curr_range > 0 and body_ratio <= doji_body_ratio
On the chart, they appear as:
Small triangle markers below bullish engulfing candles.
Small triangle markers above bearish engulfing candles.
Small circles above doji candles.
All three overlays are optional and can be turned on or off and recolored in the CANDLE PATTERNS group of inputs.
5. Inputs overview
The script organizes settings into clear groups:
DISPLAY SETTINGS : Show bullish/bearish FVGs, show/hide mitigated zones, box extension length, box border width, and maximum number of boxes.
EQUILIBRIUM : Toggle equilibrium lines, color, and line width.
LABELS : Enable labels, choose whether to label unmitigated and/or mitigated zones, and select label size.
BULLISH COLORS / BEARISH COLORS : Separate fill and border colors for bullish and bearish gaps.
MITIGATED STYLE : Opacity used when a gap is marked as mitigated.
STATISTICS : Toggle the on-chart FVG statistics panel.
CANDLE PATTERNS : Show engulfing patterns, show dojis, colors, and the body-to-range threshold that defines a doji.
6. Statistics panel
An optional table in the corner of the chart summarizes the current state of all tracked gaps:
Total number of FVGs still being tracked.
Number of bullish vs bearish FVGs.
Number of unfilled vs mitigated FVGs.
Simple fill rate: percentage of tracked FVGs that have been marked as mitigated.
This can help you study how a particular market tends to treat gaps over time.
7. How you might use it (examples)
These are usage ideas only, not recommendations:
Study how often your symbol mitigates gaps and where inside the zone price tends to react.
Use higher-timeframe context and then refine entries near the equilibrium line on your trading timeframe.
Combine FVG zones with basic candle patterns (engulfing/doji) as an extra visual anchor, if that fits your process.
Hope you enjoy, give your feedback in the comments!
- officialjackofalltrades

Breaker Blocks [TakingProphets]Breaker Blocks
Smart Money “breaker” zones automatically mapped on your chart.
This tool is designed for traders who use ICT / Smart Money concepts and want a clean, automated way to see breaker blocks form and evolve in real time.
-----------------------------------------------------------------------------------------------
🔍 What this indicator does
The script automatically detects potential bullish and bearish breaker blocks after a market structure shift, then draws and maintains those zones on your chart:
-Plots bullish breaker blocks as green shaded zones.
-Plots bearish breaker blocks as red shaded zones.
-Optionally shows the 50% (midline) of each breaker for refinement.
-Keeps a rolling list of the most recent breakers and removes older ones to keep your chart clean.
-Optionally hides breakers once price closes through them (invalidation), so only active zones remain.
It’s built to work on any symbol and any timeframe. Lower timeframes will naturally generate more breakers; higher timeframes will show fewer, more significant zones.
Important: This script does not open, manage, or close trades for you. It only visualizes price zones that may be relevant to your own strategy and analysis.
-----------------------------------------------------------------------------------------------
🧠 Core logic (high level)
Under the hood, the indicator:
Uses an internal zigzag swing structure to track major pivot highs and lows.
Watches for a market structure shift (MSS):
Bullish MSS: price closes above a prior swing high.
Bearish MSS: price closes below a prior swing low.
Once an MSS is confirmed, it:
Locates the relevant impulse candle(s) that price traded through.
Defines the breaker block using the high/low (or body vs. wick, based on internal settings).
Draws a breaker box from that origin forward in time.
Each breaker is stored as an internal object with:
Direction (bullish or bearish)
Top and bottom prices
Visual boxes and an optional midline
On every new candle, all active breakers are updated:
Extended forward as new bars print.
Optionally invalidated and deleted if price closes back through the breaker in the opposite direction.
This gives you a dynamic map of which breaker blocks are still “respected” by price and which have failed.
-----------------------------------------------------------------------------------------------
⚙️ Key Inputs & Settings
All user-facing options are grouped under “Breaker Blocks” for a clean UI.
-Display Breaker Block
Toggle the visualization on/off without removing detection logic.
-Bullish Color / Bearish Color
Choose the fill color for bullish and bearish breaker zones.
-Show 50% Line
Plots a dashed line at the mid-point of each breaker block.
Helpful if you use the 50% level as a refinement or entry anchor.
-Max Visible
Limits how many of the most recent breaker blocks stay on the chart.
Older breakers are deleted once this limit is exceeded (keeps things clean and lightweight).
-Hide When Invalidated
If enabled:
Bullish breaker is hidden once price closes below its low.
Bearish breaker is hidden once price closes above its high.
If disabled, breakers remain visible even after those closes (for study / backtesting purposes).
These options allow you to run the tool in either a minimal, current-context only mode, or a more historical, educational mode.
-----------------------------------------------------------------------------------------------
🧭 How traders might use it
Some common ways traders may incorporate breaker blocks into their own plans:
As context zones around which to look for entries using their personal triggers.
As potential support/resistance areas after a shift in structure.
To visually separate active vs. invalidated zones instead of manually redrawing them.
In confluence with other SMC tools (FVGs, liquidity pools, PD arrays, etc.) and higher-timeframe bias.
This indicator is intended as a visual aid and works best when combined with a complete trading plan, risk management rules, and your own discretion.
-----------------------------------------------------------------------------------------------
⚠️ Disclaimer
This indicator does not guarantee profits or specific outcomes.
It is provided for educational and informational purposes only.
Past price behavior around breaker blocks does not imply future results.
Always test any tool on a demo account or in a simulated environment before using it with real capital.
Trading involves risk, and you are solely responsible for your own decisions.


VIX/VXV Ratio (TitsNany)This script plots the VXV/VIX ratio, which compares medium-term volatility (90-day fear) to short-term volatility (30-day fear). When the ratio rises above key levels like 1.16 or 1.24, it signals that traders expect future stress, often preceding market pullbacks. When the ratio falls toward or below 1.0, short-term fear is spiking, which typically occurs during active selloffs or volatility events. In short, elevated readings warn of potential market drops ahead, while sharp declines in the ratio reflect panic already hitting the market.

Enhanced WMA Cross AlertAn alert for when the 10 period WMA crosses over the 21 period WMA complete with Alerts

TraderForge - Genesis xMA - EMAs + Daily SMAsA clean, powerful multi-MA system designed for momentum and trend clarity on any symbol and any timeframe.
Intraday Momentum:
• EMA 9, 13, and 21 form a responsive ribbon that reveals direction, pullbacks, and acceleration zones.
Higher-Timeframe Trend Structure:
• Daily (or any HTF you choose) SMA 20 / 50 / 200 projected on your chart act as long-range “trend rails,” giving you instant awareness of bullish/bearish bias, mean-reversion zones, and key swing levels.
Fully Editable:
• Change all EMA/SMA lengths
• Select any higher timeframe (default: Daily)
• Turn each group on/off from the settings panel
Simple. Fast. Visual. Perfect for scalping, day trading, or swing analysis.
TraderForge — Simple indicators. Powerful results.

Alt Trading: Asia Fibonacci Strategy
The Alt Trading: Asia Fibonacci Strategy is a session-anchored liquidity and Fibonacci engine designed for traders who want to systematically exploit the overnight Asia range instead of just marking it and guessing. It automatically profiles the Asia session to build a precise high–low liquidity band, then waits for clean sweeps of that range before it will even consider a setup forcing every idea to start from an objective liquidity event. Behind the scenes, a swing-based structure model defines the dominant leg and projects a true, directionally-aligned Fibonacci map, extending down for long scenarios and up for shorts so the premium/discount zones are never “mirrored” or visually inverted. Key extension bands are converted into forward-projected price zones, with dedicated entry corridors that only activate once price has both raided the Asia high/low and traded back into the correct Fibonacci pocket. A lightweight FVG engine tracks the most recent opposing Fair Value Gap and uses its invalidation as a final confirmation step, so your long setups only trigger when a bearish imbalance has been meaningfully reclaimed and vice versa for shorts. The result is a minimal but strict playbook: sweep the Asia range, respect the leg, touch the fib zone, invalidate the opposing FVG, then and only then print a clean visual marker on the chart. Transparent fib blocks, trigger FVG highlights, and compact “double-circle” text markers keep the chart readable even on lower timeframes, while still giving you a clear sense of where the setup originated and which liquidity it’s built around. All colors and visual layers are customizable, making it easy to blend the tool into your existing layout while preserving the core logic. Rather than trying to predict the entire session, Asia Fibonacci Strategy turns one of the most consistent structures in the market overnight range and its sweep into a repeatable, rule-driven framework for high-quality intraday entries.

Run Reversal Run Reversal is a multi-timeframe precision reversal tool designed to detect momentum shifts after a clean run of candles in one direction. The indicator identifies when price completes a directional run on the lower timeframe and confirms alignment with a matching run on a higher timeframe. Once both conditions are met, it marks the first reversal candle and plots a customizable entry and stop-loss setup.
Features include:
• Multi-combo structure (1m→5m, 2m→10m, 3m→15m, etc.)
• Separate settings for bullish and bearish entries & stop-loss modes
• Swing stop-loss using the most recent high/low within adjustable lookback
• Optional wick, open, and body-percentage stop-loss types
• Clean visual entry and SL lines
• Built-in alerts for buy and sell signals
Run Reversal helps traders catch early reversals with structure, clarity, and precision across multiple timeframe combinations.

Momentum FlowThis is a rule-based, fully automated trading strategy** developed **exclusively for BANKNIFTY** and optimized strictly for the **2-Hour (2H) timeframe**. The system is designed to identify **high-quality directional opportunities** while filtering out low-probability market noise.
The strategy is built for traders who prefer:
* Clean positional trading
* Limited, high-quality signals
* Fully mechanical execution
* No discretionary decision-making
This system is **locked by design** and will **only operate on BANKNIFTY – 2H timeframe** to preserve performance integrity. Usage on any other symbol or timeframe is intentionally restricted.
---
### ✅ SUITABLE FOR:
* Positional traders
* Swing traders
* Working professionals
* Traders seeking structured, disciplined systems
---
### ❌ NOT SUITABLE FOR:
* Scalping
* Low-timeframe trading
* High-frequency setups
* Traders seeking daily signals
---
### ⚠️ IMPORTANT DISCLAIMER:
This strategy is provided strictly for **educational and research purposes only**. Trading in financial markets involves significant risk, and losses are possible. Past performance does not guarantee future results. The creator is not responsible for any financial losses incurred by the use of this strategy. Always trade with proper risk management.
---

(FVH) Helios Alpha v6.3.2 — Institutional Engine Helios Alpha v6.3.2 is an institutional-grade Smart Money Concepts indicator designed to reveal true market structure, trend direction, and liquidity behavior across all timeframes.
It automatically detects BOS/CHOCH, liquidity sweeps, valid orderblocks, mitigation points, premium/discount zones, and displacement—giving traders a complete structural map without chart clutter.
Version 6.3.2 introduces enhanced orderblock filtering, improved trend-engine accuracy, multi-timeframe confirmation logic, and cleaner structural visualization.
Whether analyzing Forex, Gold (XAUUSD), Indices, or Crypto, Helios Alpha delivers consistent, high-precision trend and structure insights for traders who want reliability and clarity in any market environment.
This tool does not generate signals or promises profits. It is designed to support analysis and improve decision-making through objective structural data.

TraderForge - 15-min Candle StrategyThis indicator automatically identifies the first 15-minute candle of each trading session and projects its high and low across the entire regular trading day. The result is a clear intraday structure level that helps traders visualize opening strength, early volatility, and potential breakout or rejection zones.
Using the same projection engine found in the TraderForge Genesis ATR 1.5 system, the lines extend dynamically based on the chart’s timeframe, ensuring perfect alignment on any intraday interval.
Features
• Plots the 15-minute High and 15-minute Low for the current session
• Automatic session detection and value locking
• Clean forward projection for the entire market day
• Optional labels for quick identification
• Works on any intraday timeframe (1m, 5m, 15m, etc.)
• No repainting, no drift, no multi-session clutter
Ideal for traders who rely on early-session structure, liquidity mapping, or opening range breakout (ORB) concepts.
TraderForge – Simple indicators. Powerful results.
P.S.: Now only works for 15-minute candles, working on an agnostic version to be released soon.

HTF Candles & Levels Visualizer - SRHTF Candles & Levels Visualizer is a clean higher‑timeframe visualization tool designed to complement any trading strategy by giving clear context of larger‑TF structure directly on your current chart. It plots the previous high and low for up to three user‑selectable timeframes, and draws them as extended levels with optional labels, making it easy to see where current price sits relative to key higher‑timeframe zones.
The script also renders compact proxy candles for each selected timeframe to the right of current price, so you can visually track HTF candle development without switching charts. Each HTF slot has independent settings: timeframe, color, number of displayed candles, and visibility toggles, along with global controls for line style, label size, candle spacing, and colors.
This tool does not generate trading signals; it focuses purely on multi‑timeframe context and market structure visualization to support your own entries, exits, and risk management.

The Rumer's Box Theory“The Rumer's Box Theory” is a visual trading indicator that allows traders to quickly identify the previous daily candle’s high and low across any timeframe. It displays a purple box spanning the previous day’s high to low, with a blue horizontal line marking the 50% midpoint for quick reference. The settings also provide options to extend the box and midpoint line to the left, giving traders flexibility in how the indicator appears on the chart.

Opposite Candle Zone Identifier Opposite Candle Zone Identifier
This indicator automatically detects candles that form potential Supply and Demand zones based on a simple but effective institutional pattern.
It identifies any central candle (bullish or bearish) that is surrounded by a defined number of opposite candles before and after, helping traders highlight key turning points, absorption zones, and areas of imbalance in the market.
How It Works
The script looks for two specific structures:
🔴 Bearish Central Candle Zone (Potential Supply)
The central candle is bearish
It is preceded by N bullish candles
It is followed by N bullish candles
This structure often appears at the origin of bearish impulses and can mark institutional Supply zones.
🟢 Bullish Central Candle Zone (Potential Demand)
The central candle is bullish
It is preceded by N bearish candles
It is followed by N bearish candles
This pattern frequently forms before strong bullish expansions and may indicate Demand zones or accumulation points.
Inputs
Number of candles before (left side of the central candle)
Number of candles after (right side of the central candle)
You can increase or decrease the sensitivity of the pattern according to your style or timeframe.
What It Draws
The indicator places:
A red label above bearish zone candles
A green label below bullish zone candles
These labels help you visually identify where institutional footprints and price imbalances may exist.
Best Use Cases
Supply & Demand mapping
Institutional trading / Smart Money Concepts
Swing points and zone detection
Filtering high-quality reversal points
Locating strong origin candles before price expansions
Notes
This script does not repaint, does not use future data, and works on all timeframes and all markets.

BLACK SWAN SWEEP (DANIELPEREZ)Crt de velas especificas después del sweep buscar la confirmación del order block para tomar una operacio .
Check specific candlesticks after the sweep to find order block confirmation before taking a trade.

The Rumer's Box Theory“The Rumer's Box Theory” is a visual trading indicator designed to help traders quickly identify the previous daily candle’s high and low ranges across all timeframes. The indicator draws a purple box spanning the previous day’s high to low, with a blue horizontal line at the 50% midpoint for easy reference.

Flow Rider Mother Candle Breakout Long Short indicator - ScalpOVERVIEW
// ═══════════════════════════════════════════════════════════
// 1. Detects HIGH VOLUME "Mother/Big" candles
// 2. Waits for 2+ INSIDE bars (consolidation)
// 3. Enters SHORT on bearish breakout below mother low Enters Long on bullish breakout above
// 4. Stop Loss: Highest point + 1.5x largest upper wick (default)
// 5. Targets: TP1 @ 0.618, TP2 @ 1.618 Fibonacci extensions

Indian Scalper 2025 – PSAR + SMA50 + RSI≤50 + High Volume (75%)Best 1-min / 2-min scalping strategy for NIFTY, BANKNIFTY, FINNIFTY & liquid stocks in 2025
✓ PSAR flip + SMA-50 trend filter
✓ RSI ≤50 (avoids chasing)
✓ Only high-volume candles (bright colour)
✓ Loud mobile alerts with price & SL
✓ 1:2+ RR with PSAR trailing
Works like magic 9:15–11:30 AM and 2–3:20 PM
Made with love for the Indian trading community ♥

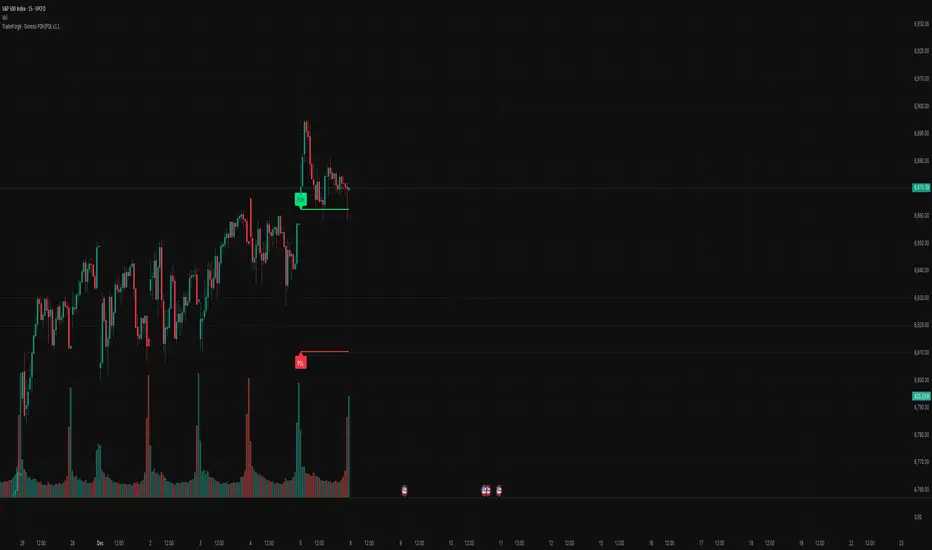
TraderForge - Genesis PDH/PDLThe Genesis PDH/PDL indicator plots the Previous Day High (PDH) and Previous Day Low (PDL) using a clean daily-session engine that locks values at the start of each new trading day. These levels are key markers for liquidity sweeps, breakout zones, reversals, and intraday trend confirmation.
How It Works
• Pulls yesterday’s high and low directly from the completed Daily candle.
• Locks both values the moment a new day begins.
• Projects each level across the entire current session for clear intraday reference.
• Labels appear only on today’s session, keeping your chart uncluttered.
Features
• Accurate, non-repainting PDH and PDL.
• Automatic day detection and session-wide projection.
• Clean, minimal visual styling consistent with the Genesis indicator family.
• Optional labels with PDH (black text) and PDL (white text).
• Works seamlessly across all intraday timeframes.
TraderForge – Simple indicators. Powerful results.