FVG vertical Created by Alphaomega18
🎯 What is an FVG (Fair Value Gap)?
A Fair Value Gap is a price imbalance created by a mismatch between buyers and sellers, formed by 3 consecutive candles where:
Bullish FVG: The low of the current candle is above the high of the candle 2 periods ago
Bearish FVG: The high of the current candle is below the low of the candle 2 periods ago
⚙️ Indicator Settings
Display Group:
Show Bullish vertical FVG: Display bullish vertical FVGs (green) ✅
Show Bearish vertical FVG: Display bearish vertical FVGs (red) ✅
Box Extension (bars): Zone extension duration (1-50 bars, default: 10)
Show Labels: Display labels with gap size 🏷️
Remove When Filled: Automatically remove filled zones ✅
📊 Visual Elements
FVG Zones:
🟢 Green = Bullish vertical FVG (potential support zone)
🔴 Red = Bearish vertical FVG (potential resistance zone)
Labels:
Show gap size in points
Positioned at the beginning of each zone
Dashboard (top right corner):
Real-time count of active FVGs
🟢 = Number of bullish vertical FVGs
🔴 = Number of bearish vertical FVGs
Candle Coloring:
Light green background = Candle forming a bullish vertical FVG
Light red background = Candle forming a bearish vertical FVG
🎯 How to Use the Indicator
1. Installation:
Open TradingView
Click "Indicators" at the top of the chart
Search for "FVG Clean" or paste the code in the Pine Editor
2. Trading Strategies:
Support/Resistance:
Bullish vertical FVGs act as support zones
Bearish vertical FVGs act as resistance zones
Price tends to return to "fill" these gaps
Position Entries:
Long: Wait for a return to a bullish vertical FVG + confirmation
Short: Wait for a return to a bearish vertical FVG + confirmation
Position Management:
Place stops below/above FVGs
Use FVGs as price targets
A filled FVG loses its validity
🔔 Alerts
The indicator includes 2 configurable alert types:
Bullish vertical FVG: Triggers when a new bullish vertical FVG forms
Bearish vertical FVG: Triggers when a new bearish vertical FVG forms
To configure: Right-click on chart → "Add Alert" → Select desired alert
💡 Usage Tips
✅ Do:
Combine with other indicators (volume, momentum)
Wait for confirmation before entering
Use across multiple timeframes
Respect your risk management
❌ Don't:
Trade solely on FVGs without confirmation
Ignore the overall market trend
Overload your chart with too many zones
🔧 Parameter Optimization
Scalping (1-5min):
Box Extension: 5-10 bars
Remove When Filled: Enabled
Day Trading (15min-1H):
Box Extension: 10-20 bars
Remove When Filled: Enabled
Swing Trading (4H-Daily):
Box Extension: 20-50 bars
Remove When Filled: As preferred
📈 Performance
Maximum 100 FVGs of each type in memory
Automatic removal of oldest ones
Optimized to not slow down your chart
Compatible with all markets and timeframes
Candlestick analysis

Multi-MA + RSI Pullback Strategy (Jordan)1️⃣ Strategy logic I’ll code
From your screenshots:
Indicators
• EMAs: 600 / 200 / 100 / 50
• RSI: length 6, levels 80 / 20
Rules (simplified so a script can handle them):
• Use a higher-timeframe trend filter (15m or 1h) using the EMAs.
• Take entries on the chart timeframe (you can use 1m or 5m).
• Long:
• Higher-TF trend is up.
• Price is pulling back into a zone (between 50 EMA and 100 EMA on the entry timeframe – this approximates your 50–61% retrace).
• RSI crosses below 20 (oversold).
• Short:
• Higher-TF trend is down.
• Price pulls back between 50 & 100 EMAs.
• RSI crosses above 80 (overbought).
• Exits: ATR-based stop + take-profit with adjustable R:R (2:1 or 3:1).
• Max 4 trades per day.
News filter & “only trade gold” you handle manually (run it on XAUUSD and avoid news times yourself – TradingView can’t read the economic calendar from code).

ATR + True RangeOne indicator for ATR & TR its a common indictor which can be used as one
instead of 2 different its is trial mode only not to be used with out other references

Smart DCA 1.0This indicator shows you when BTC is falling from its local highs and gives you an optimal entry price.

Reversal Pro v2 Reversal Pro v2 + Kernel Trend Line
© HighlanderOne – 2025
The ultimate confluence of institutional liquidity grabs + adaptive trend filtering.
Core Strategy – V-Reversal (Liquidity Sweep + Reclaim)
This indicator detects when price makes an aggressive move that sweeps nearly all recent lows (or highs) in the last 20 candles — a classic smart-money stop-hunt.
Once the sweep candle is identified, it waits for price to reclaim above the sweep low (bullish) or below the sweep high (bearish) within the next few bars.
That reclaim is the exact moment the real directional move begins.
Key improvements over classic versions:
• Uses ≥ (lookback – 2) instead of strict equality → catches more real sweeps without adding noise
• Optional true non-repainting mode (signal appears only on the close of the confirmation bar)
• Extremely clean, high-probability reversal signals (usually 2–6 per week on 1h–4h)
Smoothed Kernel Regression Trend Line (exactly like the legendary KTrend)
A secondary rational-quadratic kernel regression is plotted on top with a Gaussian lag filter.
The line changes colour based on short-term vs long-term kernel relationship:
• Teal/Green → Uptrend confirmed
• Maroon/Red → Downtrend confirmed
How to trade it (my exact rules – the way I actually use it every day)
Entry Rules
Long: Green V appears + Kernel line is green or turns green within 1–2 bars
Short: Red V appears + Kernel line is red or turns red within 1–2 bars
Trade Management – Stay in the trade using the Kernel line
• Trail your stop under the Kernel line (for longs) or above it (for shorts)
• Never exit just because of a new opposite V — wait for the Kernel line to actually change colour
• If the Kernel line stays your colour for 10–20+ bars, let the trade run — these become the massive 5:1 – 15:1 winners
• Only exit early if the Kernel line flips colour — that is your objective “trend over” signal
Best timeframes
• 15m & 1h → scalping / day trading
• 4h & Daily → swing trading monsters
Best markets
Works insanely well on: BTC/USD, ETH/USD, NAS100, SPX500, Gold, EURUSD, GBPUSD, USDJPY
This is not just another reversal indicator.
It’s institutional order-flow detection + adaptive trend filtering in one clean script.
High win-rate entries.
Objective trend-based exits.
Zero repainting (when enabled).
Pure price action.
Trade it exactly as described and you will never need another reversal system again.
Enjoy the edge.
– HighlanderOne

Daily O/C Span (Real Values & SMA Comparison)This Pine Script indicator helps you visualize and track the "momentum" or "strength" of each trading day, and compares it to a recent average. It essentially measures the net movement of the price from when the market opens to when it closes.
What the Script Does
The script performs the following actions:
Calculates Daily Movement: For every single trading day, it calculates the difference between the closing price and the opening price (Close - Open).
Plots the "Span": These daily differences are plotted as vertical bars (a histogram) in a separate window below your main price chart.
-Green bars mean the stock closed higher than it opened (a strong day).
-Red bars mean the stock closed lower than it opened (a weak day).
Calculates the Average: It calculates the Simple Moving Average (SMA) of these daily spans over an adjustable period (default is 30 days).
Plots the Average Line: A blue line is plotted over the green/red bars, showing the typical magnitude of daily movement.
Displays Comparison: A table in the top-right corner provides a quick, real-time numerical comparison of today's span versus the 30-day average span.
How It Can Improve Trading
This indicator helps you understand the character and conviction of price action, offering several trading insights:
Gauging Momentum: It clarifies whether the stock's moves are generally strong and sustained within a day (large spans) or hesitant (small spans).
Identifying Trends: During an uptrend, you might expect the average span line to be consistently positive (above zero), and vice versa for a downtrend. A positive average span indicates buyers are consistently closing the day stronger than where they started it.
Spotting Reversals: If a stock is in a strong uptrend but you suddenly see a series of large red bars (large negative spans), it could signal a shift in momentum and potential upcoming reversal.
Volatility Context: By comparing the current day's bar to the blue average line, you can quickly determine if today is an unusually strong/weak day relative to recent history.
In short, it helps you see the underlying buyer/seller conviction within each day, making it easier to gauge the overall market sentiment and anticipate potential shifts.

Trend Following $ZEC - Multi-Timeframe Structure Filter + Revers# Trend Following CRYPTOCAP:ZEC - Strategy Guide
## 📊 Strategy Overview
Trend Following CRYPTOCAP:ZEC is an enhanced Turtle Trading system designed for cryptocurrency spot trading, combining Donchian Channel breakouts, multi-timeframe structure filtering, and ATR-based dynamic risk management for both long and short positions.
---
## 🎯 Core Features
1. Multi-Timeframe Structure Filtering
- Uses Swing High/Low to identify market structure
- Customizable structure timeframe (default: 1 minute)
- Only enters trades in the direction of the trend, avoiding counter-trend positions
2. Reverse Signal Exit
- No fixed stop-loss or fixed-period exits
- Exits only when a reverse entry signal triggers
- Maximizes trend profits, reduces premature exits
3. ATR Dynamic Pyramiding
- Adds positions when price moves 0.5 ATR in favorable direction
- Supports up to 2 units maximum (adjustable)
- Pyramid scaling to enhance profitability
4. Complete Risk Management
- Fixed position size (5000 USD per unit)
- Commission fee 0.06% (Binance spot rate)
- Initial capital 10,000 USD
---
## 📈 Trading Logic
Entry Conditions
✅ Long Entry:
- Close price breaks above 20-period high
- Structure trend is bullish (price breaks above Swing High)
✅ Short Entry:
- Close price breaks below 20-period low
- Structure trend is bearish (price breaks below Swing Low)
Add Position Conditions
- Long: Price rises ≥ 0.5 ATR
- Short: Price falls ≥ 0.5 ATR
- Maximum 2 units including initial entry
Exit Conditions
- Long Exit: When short entry signal triggers (price breaks 20-period low + structure turns bearish)
- Short Exit: When long entry signal triggers (price breaks 20-period high + structure turns bullish)
---
## ⚙️ Parameter Settings
Channel Settings
- Entry Channel Period: 20 (Donchian Channel breakout period)
- Exit Channel Period: 10 (reserved parameter, actually uses reverse signal exit)
ATR Settings
- ATR Period: 20
- Stop Loss ATR Multiplier: 2.0 (reserved parameter)
- Add Position ATR Multiplier: 0.5
Structure Filter
- Swing Length: 160 (Swing High/Low calculation period)
- Structure Timeframe: 1 minute (can change to 5/15/60, etc.)
Position Management
- Maximum Units: 2 (including initial entry)
- Capital Per Unit: 5000 USD
---
## 🎨 Visualization Features
Background Colors
- Light Green: Bullish structure
- Light Red: Bearish structure
- Dark Green: Long entry
- Dark Red: Short entry
Optional Display (Default: OFF)
- Entry/exit channel lines
- Structure high/low lines
- ATR stop-loss line
- Next add position indicator
- Entry/exit labels
---
## 📱 Alert Message Format
Strategy sends notifications on entry/exit with the following format:
- Entry: `1m Long EP:428.26`
- Add Position: `15m Add Long 2/2 EP:429.50`
- Exit: `1m Close Long Reverse Signal`
Where:
- `1m`/`15m` = Current chart timeframe
- `EP` = Entry Price
---
## 💰 Backtest Settings
Capital Allocation
- Initial Capital: 10,000 USD
- Per Entry: 5,000 USD (split into 2 entries)
- Leverage: 0x (spot trading)
Trading Costs
- Commission: 0.06% (Binance spot VIP0)
- Slippage: 0
---
## 🎯 Use Cases
✅ Best Scenarios
- Trending markets
- Moderate volatility assets
- 1-minute to 4-hour timeframes
⚠️ Not Suitable For
- Highly volatile choppy markets
- Low liquidity small-cap coins
- Extreme market conditions (black swan events)
---
## 📊 Usage Recommendations
Timeframe Suggestions
| Timeframe | Trading Style | Suggested Parameter Adjustment |
|-----------|--------------|-------------------------------|
| 1-5 min | Scalping | Swing Length 100-160 |
| 15-30 min | Short-term | Swing Length 50-100 |
| 1-4 hour | Swing Trading | Swing Length 20-50 |
Optimization Tips
1. Adjust swing length based on backtest results
2. Different coins may require different parameters
3. Recommend backtesting on 1-minute chart first before live trading
4. Enable labels to observe entry/exit points
---
## ⚠️ Risk Disclaimer
1. Past Performance Does Not Guarantee Future Results
- Backtest data is for reference only
- Live trading may be affected by slippage, delays, etc.
2. Market Condition Changes
- Strategy performs better in trending markets
- May experience frequent stops in ranging markets
3. Capital Management
- Do not invest more than you can afford to lose
- Recommend setting total capital stop-loss threshold
4. Commission Impact
- Frequent trading accumulates commission fees
- Recommend using exchange discounts (BNB fee reduction, etc.)
---
## 🔧 Troubleshooting
Q: No entry signals?
A: Check if structure filter is too strict, adjust swing length or timeframe
Q: Too many labels displayed?
A: Turn off "Show Labels" option in settings
Q: Poor backtest performance?
A:
1. Check if the coin is suitable for trend-following strategies
2. Adjust parameters (swing length, channel period)
3. Try different timeframes
Q: How to set alerts?
A:
1. Click "Alert" in top-right corner of chart
2. Condition: Select "Strategy - Trend Following CRYPTOCAP:ZEC "
3. Choose "Order filled"
4. Set notification method (Webhook/Email/App)
---
## 📞 Contact Information
Strategy Name: Trend Following CRYPTOCAP:ZEC
Version: v1.0
Pine Script Version: v6
Last Updated: December 2025
---
## 📄 Copyright Notice
This strategy is for educational and research purposes only.
All risks of using this strategy for live trading are borne by the user.
Commercial use without authorization is prohibited.
---
## 🎓 Learning Resources
To understand the strategy principles in depth, recommended reading:
- "The Complete TurtleTrader" - Curtis Faith
- "Trend Following" - Michael Covel
- TradingView Pine Script Official Documentation
---
Happy Trading! Remember to manage your risk 📈

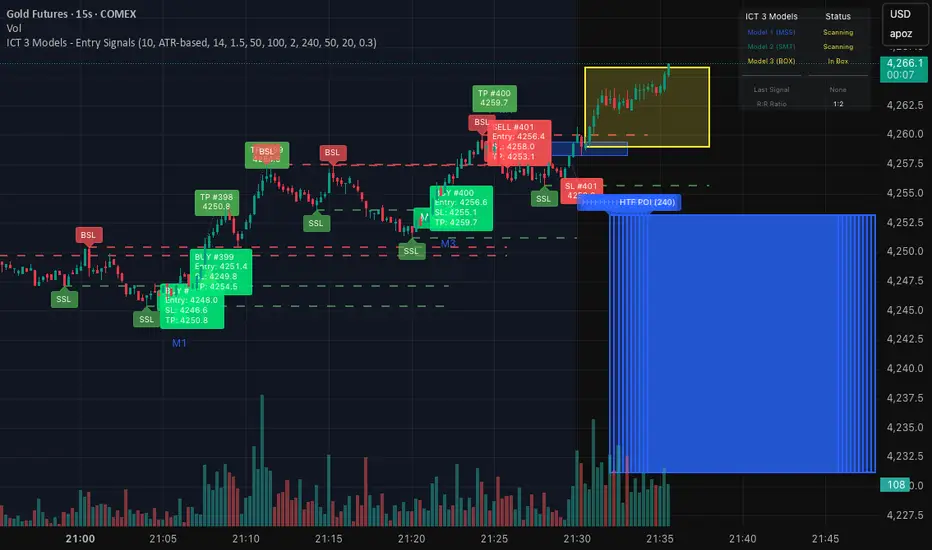
ICT 3 Models - Entry Signals 1.2This script combines 3 powerful ICT (Smart Money Concepts) Entry Models into one comprehensive strategy setup. It is designed to identify high-probability setups based on Higher Timeframe POIs and includes a fully functional Strategy Tester engine.
🔥 The 3 Entry Models:
Model 1 (MSS + FVG): Classic reversal setup using HTF Order Blocks, Liquidity Sweep, Market Structure Shift (MSS), and entry at FVG.
Model 2 (SMT / Sweep): Catches "Turtle Soup" or Failure Swing setups where price grabs liquidity and quickly reverses using FVG confirmation.
Model 3 (AMD / Box): Accumulation, Manipulation, Distribution setup. Identifies consolidation boxes and trades the manipulation leg.
✨ Highlights:
Full Backtesting Engine: Test the strategy with customizable Initial Capital and Order Sizing.
Auto HTF POI: Automatically plots Higher Timeframe Order Blocks on your chart.
Flexible Risk Management: Set SL/TP via Fixed Points or ATR Multiplier.
Alerts Included: Ready for automation.
Disclaimer: This tool is for educational purposes only. Trading involves risk.

EMA21 Pullback BuyEMA21 Pullback Buy is a tool designed to identify constructive pullbacks to the 21-period EMA in strong uptrends.
It highlights candles where:
• The previous close was above EMA21
• The current low touches or dips below EMA21
• The candle closes back above EMA21
These candles are considered potential “support tests” in a trending stock.
You can configure a maximum number of valid tests to avoid late-stage entries.
The script:
• Colors the test candles (optional)
• Marks them with a small circle
• Triggers a buy signal (green triangle) on the first bullish candle that breaks above the test candle’s high
Optional alerts are included for both:
• New EMA21 test
• Buy trigger after valid test
The goal is to help traders find low-risk entries in clean, trending stocks — without chasing breakouts or reacting emotionally. Best used with strong RS names and proper trend context.

RTH Gap & Stdev [Sword & Shield]Dynamic RTH Gap & Stdev - Technical Description
Description
This script implements a specialized methodology for analyzing the Regular Trading Hours (RTH) Opening Gap, focusing on the "void" created between the previous session's RTH Close and the current session's RTH Open. Unlike standard gap indicators that may reference the Settlement or pre-market range, this tool isolates the specific liquidity gap formed by the primary session auction.
The script is designed to help traders identify:
The Gap Zone: The precise price range where no RTH trading occurred.
Internal Quartiles: Key harmonic subdivisions (25%, 50%, 75%) within the gap, often serving as intraday support/resistance.
Expansion Targets: Projected volatility levels (Standard Deviations) above and below the gap.
Mitigation State: Real-time tracking of how much of the gap has been "filled" by price action.
Underlying Concepts & Calculations
1. RTH Session Detection
The indicator strictly follows asset-specific timetables (e.g., Indices 09:30-16:00 ET). It detects the RTH Close of the previous day (closing print of the last RTH bar) and the RTH Open of the current day.
Gap High: Max(PrevClose, CurOpen)
Gap Low: Min(PrevClose, CurOpen)
2. Quartile & Harmonic Levels
We divide the gap range (GapHigh - GapLow) into quartiles. The 50% level (Consequent Encroachment) is a widely recognized equilibrium point in gap trading.
Formula: Level(x) = GapLow + (GapRange * x) where x is 0.25, 0.50, 0.75.
3. Volatility Projections (Standard Deviations)
The script offers two distinct volatility models for projecting targets:
Gap Range Basis: A harmonic expansion model where 1.0σ (Standard Deviation) is rigidly defined as 100% of the Gap Range. This assumes the market often expands in multiples of the initial opening impulse.
Calculation: +1.0σ Level = GapHigh + GapRange
VWAP Bands Basis: A statistical model estimating daily volatility using the deviation of price from the VWAP (Volume Weighted Average Price) from the previous session. This allows the bands to adapt to the broader market volatility rather than just the gap size.
4. Dynamic Extension & Clamping
Uniquely, this script uses a forward-projection bar-loop. Lines and labels are instantiated at the Open and extended incrementally with each new bar.
Clamping: The script calculates the precise timestamp of the RTH Close and clamps all drawing objects to this time. This prevents lines from extending into the post-market or next day, ensuring a clean chart layout.
5. Mitigation Tracking
The dashboard calculates the Unmitigated Percentage of the gap:
Logic: It tracks the session's Highest High and Lowest Low.
Calculation: FilledRange = PriceExtreme - GapBoundary.
Status: displayed as "Unmitigated, 100% rem" or "Mitigated XX%", providing a precise metric for gap-fill strategies.
Usage
Traders can use this tool to:
Target the 50% fill described as "Consequent Encroachment".
Fade extremes at +1.0σ gap expansions.
Monitor the "Mitigation %" to gauge trend strength (e.g., a gap that remains <20% filled often indicates a strong trend day).

Structure Break ModelMAIN FEATURES
Supported Assets & Timeframe
This indicator is specifically designed and calibrated for 30 USDT trading pairs on the H4 timeframe, all of which have been actively traded for over 1,000 days, including:
BTCUSDT, ETHUSDT, XRPUSDT, BNBUSDT, SOLUSDT, TRXUSDT, DOGEUSDT, ADAUSDT, XLMUSDT, BCHUSDT,
ZECUSDT, LINKUSDT, HBARUSDT, UNIUSDT, LTCUSDT, AVAXUSDT, SHIBUSDT, DOTUSDT, AAVEUSDT, NEARUSDT,
ETCUSDT, ICPUSDT, FILUSDT, APTUSDT, ENSUSDT, ATOMUSDT, VETUSDT, QNTUSDT, CRVUSDT, INJUSDT
Using the script on other pairs or timeframes will trigger an automatic warning to prevent incorrect usage.
1. Structural Weakening Model (Core Logic)
At the heart of the system lies the Structural Weakening Model (SWM) — a multi-layered market-structure engine that identifies momentum exhaustion and confirms genuine reversals using pivot-based swing architecture.
Pivot Structure Mapping
The indicator continuously analyzes Pivot Highs and Pivot Lows (length = 5) to establish clean, stable swing structure.
Weakening Pattern Detection
The model evaluates directional fatigue by detecting pivot sequences:
2–6 Higher Lows → Weakening buyers → Potential SELL setup
2–6 Lower Highs → Weakening sellers → Potential BUY setup
This mechanism identifies “compression zones” where market pressure fades before a structural shift.
Breakout Confirmation Layer
A signal is only triggered when price breaks the final structural anchor of the pivot chain.
This ensures:
Optional Trend Filter (MA Alignment)
Users may select EMA, SMA, WMA, HMA and more.
Price above MA → BUY-only mode
Price below MA → SELL-only mode
This keeps signals aligned with broader market flow.
Visual Example – SELL Signal (TP Hit)
2. Signal Conditions (How the System Works)
SELL Setups
Triggered when:
Price forms 2–6 higher lows, signaling weakening buyers
Price breaks below the structural pivot anchor
(Optional) Price is below the MA filter
BUY Setups
Triggered when:
Price forms 2–6 lower highs, signaling weakening sellers
Price breaks above the structural pivot anchor
(Optional) Price is above the MA filter
Visual Example – SELL Signal (SL Hit)
3. Automatic Capital Management
The script integrates full risk-management utilities:
Starting capital (default 10,000 USDT)
Risk % per trade
Leverage (x10 → x100)
Automatic position sizing
Margin requirements
Real-time TP/SL calculations
This turns the indicator into not just a signal tool, but a complete trading assistant.
4. Flexible Stop-Loss System
Users may choose:
Swing-based SL (nearest structural pivot)
Fixed SL %
Custom TP based on R:R (1:1.5 → 1:5)
Default R:R = 1:2
SL/TP levels update instantly whenever settings change.
Input Settings Menu
5. Visual Interface
The chart displays:
Entry, TP, SL (extended 20 candles)
BUY/SELL labels
Real-time TP/SL hit status
Full info panel:
Latest signal
Entry price
TP/SL
Leverage
Risk %
Required margin
Win/loss & R statistics
Days on chart: The total number of trading days calculated from your chart’s visible data
All signals follow the exact same logic in historical and real-time charts.
Zero repainting.
6. Internal Backtest Engine (Not Official TradingView Backtesting)
The script includes an internal backtest calculator that evaluates:
SL methods
TP R:R settings
Signal quality
Aggregate R performance
⚠ This is an internal calculation tool, not the official TradingView Strategy Tester.
Its purpose is to help users understand how different settings behave when applied to past data.
7. 1-Day Free Trial
Users may message the author on TradingView to request:
1-day trial access
Ability to test signals in real-time
Compare different SL/RR settings
Verify that the indicator does not repaint
Inspect how the engine behaves on the supported 30-coin dataset
This allows users to evaluate the tool transparently before subscribing.
8. Market Coverage & Deep Backtest Basis This indicator is calibrated on the 30 largest USDT pairs, providing a deep historical dataset with stable liquidity and clearer structural swings. The long backtest range and high signal density help reduce noise and ensure more consistent behavior across different market conditions.
⚠ Disclaimer
This indicator is a quantitative analysis tool created for educational purposes only.
All “optimal settings” are derived from historical market behavior and do not guarantee future performance.
Market conditions change, and every trader must apply independent risk management.
Trading involves risk.
Use responsibly.


Strategia S&P 500 vs US10Y Yield (od 2000)This strategy explores the macroeconomic relationship between the equity market (S&P 500) and the debt market (10-Year Treasury Yield). Historically, rapid spikes in bond yields often exert downward pressure on equity valuations, leading to corrections or bear markets.
The goal of this strategy is capital preservation. It attempts to switch to cash when yields are rising too aggressively and re-enter the stock market when the bond market stabilizes.

Strategia S&P 500 vs US10Y YieldThis strategy explores the macroeconomic relationship between the equity market (S&P 500) and the debt market (10-Year Treasury Yield). Historically, rapid spikes in bond yields often exert downward pressure on equity valuations, leading to corrections or bear markets.
The goal of this strategy is capital preservation. It attempts to switch to cash when yields are rising too aggressively and re-enter the stock market when the bond market stabilizes.

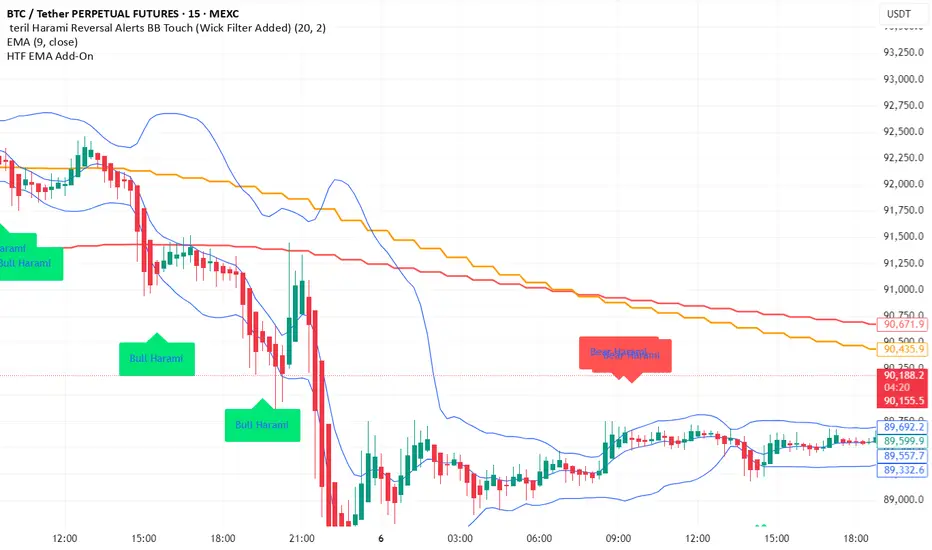
teril 1H EMA50 Harami Reversal Alerts BB Touch teril Harami Reversal Alerts BB Touch (Wick Filter Added + 1H EMA50)
teril Harami Reversal Alerts BB Touch (Wick Filter Added + 1H EMA50)
teril Harami Reversal Alerts BB Touch (Wick Filter Added + 1H EMA50)
teril Harami Reversal Alerts BB Touch (Wick Filter Added + 1H EMA50)

Terils 1hr HTF EMA Add-On EMA 50/100its EMA 50 and EMA 100 in 1 her time frame.
its EMA 50 and EMA 100 in 1 her time frame.
its EMA 50 and EMA 100 in 1 her time frame.
its EMA 50 and EMA 100 in 1 her time frame.
its EMA 50 and EMA 100 in 1 her time frame.
Swing HL**摆动点标注(Swing HL)**
本指标用于在价格图表上标示摆动高点与摆动低点,以辅助用户观察价格结构、波段节奏及潜在支撑/阻力区域。标注以圆点形式叠加在主图上,可通过参数灵活控制显示周期、敏感度及视觉样式,适合作为价格结构分析的辅助工具。
### 参数及用法说明
1. **最小显示时间框架(minSwingTf)**
* 用途:设定摆动点开始显示的最小周期。
* 当前图表周期小于该设置时,不显示任何摆动标注。
* 建议:
* 做中短线结构分析时,可设置为 240 分钟或更高;
* 若需要在更小周期观察结构,可适当降低该参数。
2. **left / right(leftBars / rightBars)**
* 用途:共同控制摆动高点、低点识别的“严格程度”和频率。
* 调整建议:
* 数值较小:标注更频繁,适合关注细节波动、短线结构;
* 数值较大:只保留更明显的摆动点,适合观察中期或波段结构;
* 当图表上摆动点过多、显得拥挤时,可适当增大这两个参数。
3. **标注颜色(dotColor)**
* 用途:设置摆动点圆标的颜色。
* 建议根据图表背景及主图颜色进行调整,以保证摆动点清晰可见但不过于抢眼。
4. **线宽(dotWidth)**
* 用途:控制圆点标注的线宽,从而影响圆点的视觉大小。
* 当需要在高密度数据或缩放较小时保持清晰,可适当增大该数值。
### 使用建议
* 可将本指标作为结构辅助层叠加在任何交易系统之上,用于直观划分价格的波段高低点。
* 进行多周期分析时,可在较大周期(如 4H、日线)上利用本指标确认整体结构,再配合小周期执行入场与风控。
* 当摆动点过多时,可通过提高 `minSwingTf` 或增加 `left` / `right` 参数,使结构标注更加简洁清晰。
* 本指标仅提供价格摆动结构的可视化标注,不直接构成完整的交易信号或策略规则,建议与个人既有分析方法结合使用。
---
**Swing HL – Swing High/Low Marker**
This indicator marks swing highs and swing lows on the price chart to assist in reading price structure, swing rhythm, and potential support/resistance zones. Markers are plotted as dots on the main chart, and display behavior can be fully controlled via user inputs such as minimum timeframe, sensitivity, and visual style. It is designed to serve as a structural overlay for discretionary or systematic analysis.
### Inputs and Usage
1. **Minimum Display Timeframe (minSwingTf)**
* Purpose: Defines the minimum timeframe on which swing markers will be shown.
* When the current chart timeframe is below this setting, all swing markers are hidden.
* Guidance:
* For swing or position-style structure analysis, consider using 4H or higher;
* For intraday structural work, you may lower this value as needed.
2. **left / right (leftBars / rightBars)**
* Purpose: Jointly control how strict and how frequent swing highs and lows are marked.
* Tuning:
* Smaller values: More frequent swings, suitable for detailed, lower-timeframe structure;
* Larger values: Only more pronounced swings are kept, suitable for higher-level trend and swing mapping;
* If the chart becomes crowded with markers, increasing these values will simplify the structure.
3. **Marker Color (dotColor)**
* Purpose: Sets the color of the swing markers.
* It is recommended to choose a color that contrasts with the background and main price plot while remaining visually unobtrusive.
4. **Line Width (dotWidth)**
* Purpose: Controls the line width of the dot markers, effectively adjusting their perceived size.
* On dense charts or when zoomed out, a larger value can help maintain readability.
### Practical Notes
* Use this indicator as a structural overlay to highlight swing highs and lows alongside your existing trading tools and methods.
* In multi-timeframe workflows, it can help outline the main structure on higher timeframes (e.g., 4H, Daily), which you then refine on lower timeframes for execution.
* If too many swing points appear, either increase `minSwingTf` or raise the `left` / `right` values to obtain a cleaner structural view.
* The script is intended as a visualization aid for price swings; it does not, by itself, define entry, exit, or risk management rules and should be integrated into a broader analytical framework.

ZKNZCN Önceki Bar H/L (Ayrı Kontrol)Bir önceki barın high & low noktalarını çizgi halinde görmeyi sağlar.

Keltner Channels Strategy NewThe strategy is chenging the same as an original copy, but this one is for tests, so I will publish it and check results

Trend Flow & Breakout Professional [Strategy]Description:
🌪️ Overview
Stop guessing. Start following the flow.
The Trend Flow & Breakout Professional is a high-precision visual trading system designed to solve the biggest problem traders face: Choppy Markets & Fakeouts.
Instead of relying on lagging indicators that generate false signals, this engine uses a proprietary "Momentum Alignment Algorithm" to identify when price action is entering a genuine expansion phase. It transforms complex trend data into a clean, easy-to-read visual roadmap, allowing you to catch the meat of the move while filtering out the noise.
🔮 Key Features
1. The "Traffic Light" Visual System Trading is 90% psychology. This script reduces mental fatigue by coloring the chart background to reflect the dominant market state:
🟢 Green Zone (Bullish Flow): Momentum is accelerating upwards. The system suggests holding long positions and ignoring minor pullbacks.
🔴 Red Zone (Bearish Flow): Structure has broken down. The system suggests defensive measures or short entries.
Note: The background remains active as long as the trend structure holds, preventing you from exiting trades too early.
2. Smart Noise Filtering Unlike standard crossover strategies that get destroyed in sideways ranges, this system includes a Multi-Layer Trend Filter. It only triggers a signal when:
Short-term momentum aligns perfectly with the medium-term direction.
Volatility expands significantly (breakout confirmation).
Price successfully clears key long-term structural resistance (The "Blue Sky" Zone).
3. Built-in "Smart Strategy" Backtester We have integrated a professional-grade position management module. You can customize how the strategy executes trades in the settings:
Mode A: Sniper (Trend Reversal): Enters heavily on the first confirmed breakout and holds until the trend reverses. Ideal for swing traders.
Mode B: Builder (Pyramiding): Adds to the position incrementally as the trend confirms its strength, maximizing profit during strong runs.
4. Cooldown Mechanism To prevent over-trading, the algorithm includes a smart "Cooldown Period" that prevents signal spamming during high-volatility consolidations.
⚙️ How to Trade This System
Wait for the Signal:
Look for the "Buy" / "Sell" labels accompanied by a bright Neon Candle.
Ensure the background color shifts (e.g., from Grey/Red to Green).
Ride the Zone:
Do not exit just because of one red candle. As long as the Background remains Green, the trend is healthy.
The background color acts as your "psychological anchor," helping you let profits run.
Exit / Reversal:
A complete background color flip (e.g., Green to Red) indicates a structural trend failure. This is your signal to close positions or flip directions.
⚠️ Disclaimer
This tool is for educational and technical analysis purposes only. Past performance does not guarantee future results. Always use proper risk management.

Swing Reversal Candlestick PatternThis indicator identifies high-probability swing reversal points by combining a fixed 20-period swing structure with strict candlestick reversal conditions. It is designed for traders who want to detect liquidity sweeps, failed breakouts, and sharp turning points in price.
The tool first determines the most recent swing high and swing low by scanning the previous 20 bars. When the price touches or sweeps these levels, the indicator evaluates the current candle for strong reversal characteristics. These include wick dominance, body direction change, and structural validation against the previous bar. Only candles that meet all reversal criteria are marked.
Bullish signals appear when the price sweeps a swing low followed by a strong upward reversal candle.
Bearish signals appear when the price sweeps a swing high, followed by a strong downward reversal candle.
This tool is intended strictly for reversal setups, not for trend continuation trading. Traders may also use the candle wick as a natural stop-loss reference, aligning entries with liquidity sweep behavior.

Engulfing Failed Zone Detector by RWBTradeLabEngulfing Failed Zone Detector by RWBTradeLab
A clean, non-repainting tool that focuses on one thing only: showing where strong engulfing patterns failed and the market broke through their base.
What this indicator does
This script automatically scans for confirmed engulfing patterns (Regular & E-Regular) and then tracks where those structures are invalidated.
It highlights two types of failure zones:
1. Buy Engulfing Failed
* A bullish engulfing pattern forms (Regular or E-Regular).
* Later, a bearish candle closes below the base low of that engulfing.
* The zone from the base candle to the failure candle is marked as Buy EG Failed .
2. Sell Engulfing Failed
* A bearish engulfing pattern forms (Regular or E-Regular).
* Later, a bullish candle closes above the base high of that engulfing.
* The zone from the base candle to the failure candle is marked as Sell EG Failed .
Only the first clear failure after each engulfing is drawn, keeping the chart clean and readable.
Visuals on chart
1. A rectangle (box) is drawn from the engulfing base candle to the failure candle.
2. Labels are placed automatically:
* Buy EG Failed (below the zone)
* Sell EG Failed (above the zone)
3. Label distance from the zone is controlled by Text Offset from Box (%).
4. Separate color controls for:
* Buy Engulfing Failed Box Color
* Sell Engulfing Failed Box Color
The label style matches Engulfing Detector by RWBTradeLab for a consistent visual experience.
Alerts
Built-in alerts trigger only on confirmed bar close when a new failure completes:
* Buy EG Failed
* Sell EG Failed
Each alert message includes:
* Brand prefix: RWBTradeLab
* Price
* Time
* Ticker
Perfect for linking with bots, webhooks or alert-based trade management.
Key settings
Candle Length (closed candles)
* Defines how many recent confirmed candles are scanned (the live bar is excluded).
Display toggles
* Buy Engulfing Failed
* Sell Engulfing Failed
* Text
Turn each element ON/OFF to control how much information you want on the chart.
Text Offset from Box (%)
* Controls how far the label is placed from the failed zone, with a safe minimum to keep labels clear and readable.
Non-repainting confirmation
* All detection and alerts are based on closed candles only.
* No signals from the running candle, no repaint tricks.
* Once a failure zone appears, it stays fixed.
Best use
Failed engulfing zones can reveal:
* Broken demand/supply zones
* Liquidity grabs where “smart money” flushed traders out
* Strong momentum shifts after a failed reversal attempt
* Levels where continuation or clean retests often occur
Works on any symbol and timeframe. For best results, combine with:
* Higher timeframe structure
* Key support/resistance or supply/demand mapping
* Your own confirmation tools and risk management
Disclaimer
This indicator is a technical pattern-detection tool, not financial advice. Trading involves risk. Always confirm signals with your own analysis and use proper risk management.
Creator: RWBTradeLab
If this script adds value to your trading, please leave a ⭐ and share your feedback.
