Navidad SharksThis indicator is NOT a signal system.
It is not designed for blind BUY/SELL execution. If you trade it like signals, you will most likely lose consistency.
What is it then?
It is a visual execution tool built around the Sharks Value Zones methodology.
The indicator helps you:
Define a value range
Wait for a valid breakout
Visualize risk (STOP) and reward (1:1) in a structured way
The indicator does not make decisions for you — it gives structure.
The trader still decides.
⚠️ Important for new users
This is NOT an automated signal tool
It only makes sense if you learn the Sharks Value Zones system inside the Sharks community
Entering trades just because a BUY or SELL label appears is not the method
This indicator provides levels and structure, not trade instructions.
🦈 Sharks Mindset
Professional traders don’t chase signals.
They repeat clear structures, disciplined execution, and controlled risk.
This indicator exists to:
bring order to your chart
remove emotional guessing
help you execute with consistency
✅ What the indicator draws
Base range / Value Zone based on the selected market session
Breakout direction (BUY or SELL) after the range
STOP zone (risk) and 1:1 target zone (reward)
Additional markers:
80% TP → price reached 80% of the target
TP ✅ / STOP ❌ → trade resolution
🧩 Inputs explained (simple)
Market
Select the session you want to trade (NY, Europe, Crypto, etc.).
This defines when the value range is calculated.
Anchor boxes from range start (bars)
How many candles the boxes extend to the right.
Higher value = longer visual boxes.
BUY/SELL label offset
Moves the BUY/SELL label left or right (visual only).
TP/STOP label offset
Moves TP / STOP / 80% labels (visual only).
ENTRY TICKS (number of breakout ticks)
Filters weak breakouts.
0 = instant breakout (more signals, more sensitivity)
3–5 ticks recommended for Forex
Indices and crypto may require higher values depending on volatility
Use 2nd opportunity
If the first trade hits STOP, the system may allow a second structured attempt on the opposite break (if enabled).
This is part of the Sharks methodology, not revenge trading.
🧠 How to use it correctly
Learn the Sharks Value Zones system
Use the indicator as a map, not a signal
Combine structure + context + risk management
==========================================
Candlestick analysis

Supertrend + EMA + RSI Algo (Low Risk High Accuracy)This is a trend-following + momentum confirmation strategy designed to reduce false signals and control loss.
Supertrend (10,3) → Identifies overall market direction (Buy in uptrend, Sell in downtrend)
EMA 50 & EMA 200 → Confirms strong trend and avoids sideways market
Buy only when EMA 50 is above EMA 200
Sell only when EMA 50 is below EMA 200
RSI (14) → Confirms momentum
Buy when RSI > 55 (strong bullish momentum)
Sell when RSI < 45 (strong bearish momentum)
---
🔹 Entry Logic
BUY: Market is in uptrend + strong momentum
SELL: Market is in downtrend + strong bearish pressure
---
🔹 Risk Management (Most Important)
Stop Loss: Based on ATR (adapts to volatility)
Target: Fixed Risk-Reward ratio (example: 1 : 2.5)
This keeps loss small and profits larger
---
🔹 Best Use Case
Works best in trending markets
Ideal timeframes: 15m, 1h, 4h
Suitable for crypto futures & swing trading
Beginner-friendly if used with low leverage

Custom ORB (Adjustable Time + Alerts)Opening range Breakout for the current day only. Time frame and be adjusted for first 15 min, 30 min, e.g., 9:30 am to 9:45 am or to 10 am, etc. You can add price alerts for high and low. You can also change the color of solid lines.

First Presented FVGSummary: First Presented FVG Indicator
This is a Pine Script v6 TradingView indicator that identifies and visualizes the first Fair Value Gap (FVG) that forms within configurable time windows during a trading session.
What it Does
1. Detects FVGs : Uses the classic 3-candle FVG definition:
- Bullish FVG: When low > high (gap up)
- Bearish FVG: When high < low (gap down)
2. "First Presented" Logic : For each configured time slot, it captures only the first qualifying FVG that forms—subsequent FVGs in that window are ignored.
3. Visual Display :
- Draws a colored box spanning from detection time to session end
- Optional text label showing detection time (e.g., "9:38 Tue FP FVG")
- Optional grade lines at 25%, 50%, and 75% levels within the FVG
Key Configuration
Setting Description
Timeframe Only works on 5-minute charts or lower
Timezone IANA timezone for session times (default: America/New_York)
Session Futures trading hours (default: 1800-1715)
Min FVG Size Minimum gap size in ticks to qualify
4 Time Slots Each with enable toggle, time window, and color
Default Time Slots
Slot 1 (enabled): 09:30-10:30 — lime green
Slot 2 (enabled): 13:30-14:30 — blue
Slot 3 (disabled): 13:00-13:30 — teal
Slot 4 (disabled): 14:15-14:45 — fuchsia
Technical Features
Handles cross-midnight sessions correctly
Resets all drawings at each new session
Skips the first bar of each window to ensure valid 3-candle lookback
Clamps slot windows to session boundaries

Trend King Wave Trading Terminator v4This script is intended for learning and communication purposes only. Please do not use it as a basis for investment. The market is risky, so operate with caution. I have made this solemn declaration: I am not responsible for any losses caused by improper operations. Please comply with local laws and regulations!

GMA Smart Trend Channel [Top Volatility Track]This script is for learning and communication purposes only. Please do not use it as an investment basis. The market is risky, so proceed with caution. I have made a formal statement: I am not responsible for any losses caused by improper operations.

NTA Directional Price Pressure (DPP)NTA Directional Pressure Bar
by NexTrade Academy
NTA Directional Pressure Bar is a contextual market analysis tool developed by NexTrade Academy, designed to quantify real-time directional price pressure by measuring the efficiency and dominance of bullish versus bearish price movement.
This script is not a trading system and does not generate buy or sell signals. Its purpose is to act as a bias confirmation and market context engine, helping traders understand who is controlling the market right now.
🔍 What does NTA Directional Pressure Bar do?
This indicator analyzes pure price action to:
Measure bullish vs bearish pressure using candle body efficiency
Quantify directional dominance in real time
Identify when one side (buyers or sellers) is in control
Filter low-quality conditions and non-operable market phases
The result is a clean, visual pressure bar that reflects institutional-style market control, without unnecessary noise.
📊 How to read it
Green dominance → Bullish pressure is in control
Red dominance → Bearish pressure is in control
Balanced / flat zones → No clear dominance (range or compression)
This tool does not trigger trades.
It enables or disables directional bias.
🧠 Institutional Use Case
NTA Directional Pressure Bar is designed to be used as:
A bias confirmation layer
A context filter before execution
A confluence tool alongside structure, liquidity, or Wyckoff-based analysis
It integrates naturally with frameworks such as:
Wyckoff NTA – Institutional Context Engine
NTC (NexTrade Concept) execution models
⚠️ Important Notice
This script does not guarantee results, is not automated, and is not financial advice.
It must be used strictly as a contextual analysis tool, always combined with a structured trading plan and proper risk management.
✅ Recommended Use
Use NTA Directional Pressure Bar to:
Confirm directional bias
Avoid trading against dominant pressure
Stay aligned with market control
Improve trade selectivity and discipline
Developed by NexTrade Academy
Institutional Trading · Market Structure · Context First

STUDENT WYCKOFF Volume ClimaxSTUDENT WYCKOFF Volume Climax highlights potential buying and selling climaxes by combining abnormally high volume with wide spread bars.
It is a simple Wyckoff-style tool that helps you see where effort (volume) and result (spread) reached extreme levels and may signal exhaustion or stopping action.
━━━━━━━━━━
1. Concept
━━━━━━━━━━
The script looks for bars where:
• Volume is many times higher than its recent average.
• The spread (high–low range) is much wider than usual.
• The candle has a real body (not a tiny doji).
• The bar is fully confirmed (closed).
Such bars are marked as:
• **BC (Buying Climax)** – wide up bar on very high volume.
• **SC (Selling Climax)** – wide down bar on very high volume.
The idea is not to call exact tops or bottoms, but to mark places on the chart where effort and result spike together, so you can then judge context, background and next bars in the Wyckoff sense.
━━━━━━━━━━
2. How the indicator works
━━━━━━━━━━
Inputs:
• Volume lookback – number of bars used for the average volume.
• Spread lookback – number of bars used for the average spread (high–low).
• Volume multiplier – how many times above the average volume a bar must reach to be considered “climactic”.
• Spread multiplier – how many times above the average spread the bar’s range must be.
• Min body / spread – minimum body size as a fraction of spread (0–1) to filter out near-doji candles.
Internally the script calculates:
• Range = high − low.
• Average volume = SMA(volume, volume lookback).
• Average spread = SMA(range, spread lookback).
• Body fraction = |close − open| / range.
A bar is a **climax bar** only if:
1) Volume > averageVolume × volumeMultiplier,
2) Spread > averageSpread × spreadMultiplier,
3) BodyFraction ≥ Min body / spread,
4) Bar is closed (barstate.isconfirmed).
Classification:
• If close > open → **Buying Climax (BC)**.
• If close < open → **Selling Climax (SC)**.
━━━━━━━━━━
3. Visuals
━━━━━━━━━━
The indicator works in a separate pane (overlay = false) and shows:
1) **Histogram in the subwindow**
• Value = Volume / AverageVolume (ratio).
• 1.0 line marks average volume.
• Bars are colored:
– Green for BC,
– Red for SC,
– Neutral grey for all other bars.
2) **Labels on price with force overlay**
• On BC bars a small “BC” label is plotted above the bar high.
• On SC bars a small “SC” label is plotted below the bar low.
• Labels are drawn with `force_overlay=true`, so they appear directly on the price chart even though the indicator itself is in the lower pane.
All signals are generated **only on bar close** to reduce repainting behaviour. The last, still forming bar is not treated as a confirmed climax.
━━━━━━━━━━
4. How to use it
━━━━━━━━━━
Typical applications:
• Wyckoff-style reading of climactic action
– Look for BC near potential buying climaxes in up moves, especially after long rallies or in the last part of a trend.
– Look for SC near potential selling climaxes after panics or shake-outs.
• Effort vs Result analysis
– Ask whether the market gets a lot of “effort” (volume + wide spread) but then fails to continue in the same direction.
– Pay attention to the next 1–3 bars after a BC/SC: is there follow-through or immediate failure?
• Scanning for zones of interest
– On higher timeframes BC/SC can highlight areas worth marking as potential stopping, climactic or reversal zones.
– On intraday timeframes they can show where very aggressive activity hit the tape (news, open/close auctions, liquidations).
The labels and histogram are **not** trading signals by themselves. They are context markers that tell you: “Here was a big push with big spread; now check structure, background and test behaviour.”
━━━━━━━━━━
5. Notes and disclaimer
━━━━━━━━━━
• Works on any symbol and timeframe available on TradingView.
• Uses only standard built-in volume and price data; no exotic calculations.
• Signals are calculated on confirmed bars with `barstate.isconfirmed`, so they do not repaint after the bar closes.
This script is published for educational and analytical purposes only.
It does not constitute financial or investment advice and does not guarantee any performance. Always test your ideas, understand the logic behind your tools and use proper risk management.

First presented FVG (w/stats) w/statistical hourly ranges & biasOverview
This indicator identifies the first Fair Value Gap (FVG) that forms during each hourly session and provides comprehensive statistical analysis based on 12 years of historical NASDAQ (NQ) data. It combines price action analysis with probability-based statistics to help traders make informed decisions.
⚠️ IMPORTANT - Compatibility
Market: This indicator is designed exclusively for NASDAQ futures (NQ/MNQ)
Timeframe: Statistical data is based on FVGs formed on the 5-minute timeframe
FVG Detection: Works on any timeframe, but use 5-minute for accuracy matching the statistical analysis
All hardcoded statistics are derived from 12 years of NQ historical data
What It Does
1. FVG Detection & Visualization
Automatically detects the first FVG (bullish or bearish) that forms each hour
Draws colored boxes around FVGs:
Blue boxes = Bullish FVG (gap up)
Red boxes = Bearish FVG (gap down)
FVG boxes extend to the end of the hour
Optional midpoint lines show the center of each FVG
Uses volume imbalance logic (outside prints) to refine FVG boundaries
2. Hourly Reference Lines
Vertical Delimiter: Marks the start of each hour
Hourly Open Line: Shows where the current hour opened
Expected Range Lines: Projects the anticipated high/low based on historical data
Choose between Mean (average) or Median (middle value) statistics
Upper range line (teal/green)
Lower range line (red)
All lines span exactly one hour from the moment it opens
Optional labels show price values at line ends
3. Real-Time Statistics Table
The table displays live data for the current hour only:
Hour: Current hour in 12-hour format (AM/PM)
FVG Status: Shows if a Bull FVG, Bear FVG, or no FVG has formed yet
Green background = Bullish FVG detected
Red background = Bearish FVG detected
1st 15min: Direction of the first 15 minutes (Bullish/Bearish/Neutral/Pending)
Continuation %: Historical probability that the hour continues in the first 15-minute direction
Color-coded: Green for bullish, red for bearish
Avg Range %: Expected percentage range for the current hour (based on 12-year mean)
FVG Effect %: Historical probability that FVG direction predicts hourly close direction
Shows BISI→Bull % for bullish FVGs
Shows SIBI→Bear % for bearish FVGs
Blank if no FVG has formed yet
Time Left: Countdown timer showing MM:SS remaining in the hour (updates in real-time)
Hourly Bias: Historical directional tendency (bullish % or bearish %)
H Open: Current hour's opening price
Exp Range: Projected price range (Low - High) based on historical average
Customization Options
Detection Settings:
Lower Timeframe Selection (15S, 1min, 5min) - controls FVG detection granularity
Display Settings:
FVG box colors (bullish/bearish)
Midpoint lines (show/hide, color, style)
Table Settings:
Position (9 locations: corners, edges, center)
Text size (Tiny, Small, Normal, Large)
Hourly Lines:
Toggle each line type on/off
Hour delimiter (color, width)
Open line (color, width, style)
Range lines (color, width, style)
Choose Mean or Median statistics for range calculation
Show/hide labels with customizable text size
How to Use
Apply to NQ futures chart (NQ1! or MNQ1!)
Set chart to 5-minute timeframe for optimal FVG detection matching the statistical data
Watch for the first FVG to form each hour
Reference the table for probability-based decision support:
High continuation % = strong directional bias
FVG Effect % shows reliability of the FVG signal
Time Left helps manage entries/exits within the hour
Use range lines as potential targets or reversal zones
Statistical Foundation
All statistics are derived from:
12 years of NASDAQ (NQ) historical data
Hourly analysis of FVG formation patterns
First 15-minute directional analysis
Mean and Median calculations for range expectations
Data encompasses 2,400+ samples per hour
Best Practices
✅ Use on NQ/MNQ futures only
✅ Best on 5-minute charts (matches statistical data)
✅ Combine FVG signals with continuation probabilities
✅ Use range lines as potential profit targets
✅ Watch the countdown timer for hour-end setups
❌ Do not use on other markets (statistics won't apply)
❌ Avoid using during low-liquidity hours (5PM ET has minimal data)
Technical Notes
Timezone: America/New_York (EST/EDT)
Weekend filtering: Automatically hides data during market closure
Updates in real-time on live bars
Maximum 500 boxes/lines for performance
FVG detection includes volume imbalance (body gap) refinement
Credits
Statistical analysis based on 12 years of NASDAQ historical data. FVG detection methodology follows ICT concepts with volume imbalance refinement.
Disclaimer: This indicator provides statistical analysis based on historical data. Past performance does not guarantee future results. Always use proper risk management.
Would you like me to adjust any section or add/remove anything?6-9 Session & Levels - Customizable Range Analysis Indicator
Description:
This indicator provides comprehensive session-based range analysis designed for intraday traders. It calculates and displays key levels based on a customizable session period (default 6:00-9:00 AM ET).
Core Features:
Sespastedthis is a summary for another indicator- i was hoping for something more like this in terms of content etc22:23Architected comprehensive indicator summary matching professional documentation style.The user wants me to rewrite the summary for their FVG indicator in a similar style to the example provided. The example is more structured, detailed, and professional. Let me create a comprehensive summary that follows that format:
Clear title
Description/Overview
Core Features (broken down into sections)
Input Settings Explained (detailed breakdown of all customization options)
How It Works section
Use Case
Note/Disclaimer
Let me make it thorough and match the style while being accurate to their indicator's functionality.Here's a detailed summary in that format:
Every Hour 1st FVG with Statistical Analysis - NASDAQ Hourly Trading Intelligence
Description:
This indicator identifies the first Fair Value Gap (FVG) that forms during each hourly session and provides comprehensive probability-based statistical analysis derived from 12 years of NASDAQ (NQ) historical data. It combines real-time FVG detection with hardcoded statistical probabilities to help intraday traders make informed decisions based on historical patterns and hourly price action dynamics.
IMPORTANT: This indicator is specifically calibrated for NASDAQ futures (NQ/MNQ) only. All statistical data is derived from 12 years of NQ historical analysis with FVGs detected on the 5-minute timeframe. Using this indicator on other markets will produce invalid statistical results.
Core Features:
FVG Detection & Visualization
Automatically detects and displays the first Fair Value Gap (bullish or bearish) that forms within each hourly session
Color-coded boxes mark FVG zones: Blue for bullish FVGs (gap up), Red for bearish FVGs (gap down)
FVG boxes extend precisely to the end of the hour boundary
Optional midpoint lines show the center point of each FVG
Uses volume imbalance logic (outside prints) to refine FVG boundaries beyond simple wick-to-wick gaps
Supports both chart timeframe detection and lower timeframe detection via request.security_lower_tf
Hourly Reference Lines
Vertical Hour Delimiter: Marks the exact start of each new hour with an extendable vertical line
Hourly Open Line: Displays the opening price of the current hour
Expected Range Lines: Projects anticipated high and low levels based on 12 years of statistical data
Choose between Mean (average) or Median (middle value) calculations
Upper range line shows expected high
Lower range line shows expected low
All lines span exactly one hour from open to close
Optional labels display exact price values at the end of each line
Real-Time Statistics Table
Displays comprehensive live data for the current hour only:
Hour: Current hour in 12-hour format (e.g., "9AM", "2PM")
FVG Status: Shows detection state with color coding
"None Yet" (white background) - No FVG detected
"Bull FVG" (green background) - Bullish FVG identified
"Bear FVG" (red background) - Bearish FVG identified
1st 15min: Direction of first 15 minutes (Bullish/Bearish/Neutral/Pending)
Continuation %: Historical probability that the hour closes in the direction of the first 15 minutes
Green background with up arrow (↑) for bullish continuation probability
Red background with down arrow (↓) for bearish continuation probability
Avg Range %: Expected percentage range for the current hour based on 12-year mean
FVG Effect %: Historical effectiveness of FVG directional prediction
Shows "BISI→Bull %" for bullish FVGs (gap up predicting bullish hourly close)
Shows "SIBI→Bear %" for bearish FVGs (gap down predicting bearish hourly close)
Displays blank if no FVG has formed yet
Time Left: Real-time countdown timer showing minutes and seconds remaining in the hour (MM:SS format)
Hourly Bias: Historical directional tendency showing bullish or bearish percentage bias
H Open: Current hour's opening price
Exp Range: Projected price range showing "Low - High" based on selected statistic (mean or median)
Input Settings Explained:
Detection Settings
Lower Timeframe: Select the base timeframe for FVG detection
Options: 15S (15 seconds), 1 (1 minute), 5 (5 minutes)
Recommendation: Use 5-minute to match the statistical data sample
The indicator uses this timeframe to scan for FVG patterns even when viewing higher timeframes
Display Settings
Bullish FVG Color: Set the color and transparency for bullish (upward) FVG boxes
Bearish FVG Color: Set the color and transparency for bearish (downward) FVG boxes
Show Midpoint Lines: Toggle horizontal lines at the center of each FVG box
Midpoint Line Color: Customize the midpoint line color
Midpoint Line Style: Choose between Solid, Dotted, or Dashed line styles
Table Settings
Table Position: Choose from 9 locations:
Top: Left, Center, Right
Middle: Left, Center, Right
Bottom: Left, Center, Right
Table Text Size: Select from Tiny, Small, Normal, or Large for readability on different screen sizes
Hourly Lines Settings
Show Hourly Lines: Master toggle for all hourly reference lines
Show Hour Delimiter: Toggle the vertical line marking each hour's start
Delimiter Color: Customize color and transparency
Delimiter Width: Set line thickness (1-5)
Show Hourly Open: Toggle the horizontal line at the hour's opening price
Open Line Color: Customize color
Open Line Width: Set thickness (1-5)
Open Line Style: Choose Solid, Dashed, or Dotted
Show Range Lines: Toggle the expected high/low projection lines
Range Statistic: Choose "Mean" (12-year average) or "Median" (12-year middle value)
Range High Color: Customize upper range line color and transparency
Range Low Color: Customize lower range line color and transparency
Range Line Width: Set thickness (1-5)
Range Line Style: Choose Solid, Dashed, or Dotted
Show Line Labels: Toggle price labels at the end of all horizontal lines
Label Text Size: Choose Tiny, Small, or Normal
How It Works:
FVG Detection Logic:
The indicator scans price action on the selected lower timeframe (default: 1-minute) looking for Fair Value Gaps using a 3-candle pattern:
Bullish FVG: Formed when candle 's high is below candle 's low, creating an upward gap
Bearish FVG: Formed when candle 's low is above candle 's high, creating a downward gap
The detection is refined using volume imbalance logic by checking for body gaps (outside prints) on both sides of the middle candle. This narrows the FVG zone to areas where bodies don't touch, indicating stronger imbalances.
Only the first FVG that forms during each hour is displayed. If a bullish FVG forms first, it takes priority. The FVG box is drawn from the formation time through to the end of the hour.
Statistical Analysis:
All probability statistics are hardcoded from 12 years (2,400+ samples per hour) of NASDAQ futures analysis:
First 15-Minute Direction: At 15 minutes into each hour, the indicator determines if price closed above, below, or equal to the hour's opening price
Continuation Probability: Historical analysis shows the likelihood that the hour closes in the same direction as the first 15 minutes
Example: If 9AM's first 15 minutes are bullish, there's a 60.1% chance the entire 9AM hour closes bullish (lowest continuation hour)
4PM shows the highest continuation at 86.1% for bullish first 15 minutes
FVG Effectiveness: Tracks how often the first FVG's direction correctly predicts the hourly close direction
BISI (Bullish Imbalance/Sell-side Inefficiency) → Bullish close probability
SIBI (Bearish Imbalance/Buy-side Inefficiency) → Bearish close probability
Range Expectations: Mean and median values represent typical price movement percentage for each hour
9AM and 10AM show the largest ranges (~0.6%)
5PM shows minimal range (~0.06%) due to low liquidity
Hourly Reference Lines:
When each new hour begins:
Vertical delimiter marks the hour's start
Hourly open line plots at the first bar's opening price
Range projection lines calculate expected high/low:
Upper Range = Hourly Open + (Range% / 100 × Hourly Open)
Lower Range = Hourly Open - (Range% / 100 × Hourly Open)
Lines extend exactly to the hour's end time
Labels appear at line endpoints showing exact prices
Real-Time Updates:
FVG Status: Updates immediately when the first FVG forms
First 15min Direction: Locked in at the 15-minute mark
Countdown Timer: Uses timenow to update every second
Table Statistics: Refresh on every bar close
Timezone Handling:
All times are in America/New_York (Eastern Time)
Automatically filters weekend periods (Saturday and Sunday before 6PM)
Hour detection accounts for daylight saving time changes
Use Cases:
Intraday Trading Strategy Development:
FVG Entry Signals: Use the first hourly FVG as a directional bias
Bullish FVG + High continuation % = Strong long setup
Bearish FVG + High continuation % = Strong short setup
First 15-Minute Breakout: Combine first 15-min direction with continuation probabilities
Wait for first 15 minutes to complete
If continuation % is above 70%, trade in that direction
Example: 4PM bullish first 15 min = 86.1% chance hour closes bullish
Range Targeting: Use expected high/low lines as profit targets or reversal zones
Price approaching mean high = potential resistance
Price approaching mean low = potential support
Compare mean vs median for different risk tolerance (median is more conservative)
Hour Selection: Focus trading on hours with:
High FVG effectiveness (11AM: 81.5% BISI→Bull)
High continuation rates (4PM: 86.1% bull continuation)
Avoid low-continuation hours like 9AM (60.1%)
Time Management: Use the countdown timer to:
Enter early in the hour when FVG forms
Exit before hour-end if no follow-through
Avoid late-hour entries with <15 minutes remaining
Statistical Edge Identification:
Compare current hour's FVG against historical effectiveness
Identify when first 15-min direction contradicts FVG direction (conflict = caution)
Use hourly bias to confirm or contradict FVG signals
Monitor if price stays within expected range or breaks out (outlier moves)
Risk Management:
Expected range lines provide logical stop-loss placement
FVG Effect % helps size positions (higher % = larger position)
Time Left countdown aids in time-based stop management
Avoid trading hours with neutral bias or low continuation rates
Statistical Foundation:
All embedded statistics are derived from:
12 years of NASDAQ futures (NQ) continuous contract data
5-minute timeframe FVG detection methodology
24 hours per day analysis (excluding weekends)
2,400+ samples per hour for robust statistical validity
America/New_York timezone for session alignment
Data includes:
Hourly range analysis (mean, median, standard deviation)
First 15-minute directional analysis
FVG formation frequency and effectiveness
Continuation probability matrices
Bullish/bearish bias percentages
Best Practices:
✅ Do:
Use exclusively on NASDAQ futures (NQ1! or MNQ1!)
Apply on 5-minute charts for optimal FVG detection matching statistical samples
Wait for first 15 minutes to complete before acting on continuation probabilities
Combine FVG signals with continuation % and FVG Effect % for confluence
Use expected range lines as initial profit targets
Monitor the countdown timer for time-based trade management
Focus on hours with high statistical edges (4PM, 11AM, 10AM)
❌ Don't:
Use on other markets (ES, RTY, YM, stocks, forex, crypto) - statistics will be invalid
Rely solely on FVG without confirming with continuation probabilities
Trade during low-liquidity hours (5PM shows only 0.06% average range)
Ignore the first 15-minute direction when it conflicts with FVG direction
Apply to timeframes significantly different from 5-minute for FVG detection
Use median range expectations aggressively (they're conservative)
Technical Implementation Notes:
Timezone: Fixed to America/New_York with automatic DST adjustment
Weekend Filtering: Automatically hides data Saturday and Sunday before 6PM ET
Performance: Maximum 500 boxes and 500 lines for optimal chart rendering
Update Frequency: Table updates on every bar close; timer updates every second using timenow
FVG Priority: Bullish FVGs take precedence when both form simultaneously
Lower Timeframe Detection: Uses request.security_lower_tf for accurate sub-chart-timeframe FVG detection
Precision: All price labels use format.mintick for appropriate decimal precision
Big thanks to @Trades-Dont-Lie for the FPFVG code in his excellent indicator that I've used here

FVG Heatmap [Hash Capital Research]FVG Map
FVG Map is a visual Fair Value Gap (FVG) mapping tool built to make displacement imbalances easy to see and manage in real time. It detects 3-candle FVG zones, plots them as clean heatmap boxes, tracks partial mitigation (how much of the zone has been filled), and summarizes recent “fill speed” behavior in a small regime dashboard.
This is an indicator (not a strategy). It does not place trades and it does not publish performance claims. It is a market-structure visualization tool intended to support discretionary or systematic workflows.
What this script detects
Bullish FVG (gap below price)
A bullish FVG is detected when the candle from two bars ago has a high below the current candle’s low.
The zone spans from that prior high up to the current low.
Bearish FVG (gap above price)
A bearish FVG is detected when the candle from two bars ago has a low above the current candle’s high.
The zone spans from the current high up to that prior low.
What makes it useful
Heatmap zones (clean, readable FVG boxes)
Bullish zones plot below price. Bearish zones plot above price.
Partial fill tracking (mitigation progress)
As price trades back into a zone, the script visually shows how much of the zone has been filled.
Mitigation modes (your definition of “filled”)
• Full Fill: price fully trades through the zone
• 50% Fill: price reaches the midpoint of the zone
• First Touch: price touches the zone one time
Optional auto-cleanup
Optionally remove zones once they’re mitigated to keep the chart clean.
Fill-Speed Regime Dashboard
When zones get mitigated, the script records how many bars it took to fill and summarizes the recent environment:
• Average fill time
• Median fill time
• % fast fills vs % slow fills
• Regime label: choppy/mean-revert, trending/displacement, or mixed
How to use
Use FVG zones as structure, not guaranteed signals.
• Bullish zones are often watched as potential support on pullbacks.
• Bearish zones are often watched as potential resistance on rallies.
The fill-speed dashboard helps provide context: fast fills tend to appear in more rotational conditions, while slow fills tend to appear in stronger trend/displacement conditions.
Alerts
Bullish FVG Created
Bearish FVG Created
Notes
FVGs are not guaranteed reversal points. Fill-speed/regime is descriptive of recent behavior and should be treated as context, not prediction. On realtime candles, visuals may update as the bar forms.

ORB Pro: Sniper Edition [Hybrid Scanner + Smart Ranking]الوصف (Description):
🚀 ORB Pro: Sniper Edition – The Ultimate Day Trading System
The ORB Pro: Sniper Edition is not just an indicator; it is a complete algorithmic trading system designed for scalpers and day traders who trade the Opening Range Breakout (ORB) strategy.
This edition features a revolutionary "Hybrid Scanner" with "Smart Opportunity Ranking" logic that prioritizes fresh signals over old ones, ensuring you never miss a breakout.
🔥 Key Features:
Hybrid Scanner System:
Manual Mode: Monitor your own top 5 favorite stocks.
Auto Scanner Mode: Automatically scans a pre-defined list of Top 20 High-Momentum Stocks (TSLA, NVDA, AMD, COIN, MSTR, etc.) inside the code.
🧠 Sniper Ranking Logic (The Game Changer): Unlike standard scanners that show static lists, this system sorts stocks dynamically in the table based on opportunity:
🥇 Priority 1: Fresh Breakouts (RUN 🚀) that haven't hit targets yet (The Entry Zone).
🥈 Priority 2: Winning Trades (WIN ✅) that already hit targets.
🥉 Priority 3: Weak or Stopped out trades.
Advanced Strategy Logic:
Fibonacci Targets: Precision exits at 1.618, 2.0, 2.618, and 3.618 extensions.
Smart Reversal: Detects "Fakeouts" and flips the signal immediately (e.g., from CALL to PUT) to catch institutional traps.
Trend Filtering: Uses EMA 50 to filter out low-probability trades.
Risk Management:
Auto Breakeven: Moves stop-loss to entry after Target 1.
Trailing Stop: Dynamic stop-loss that follows the price action.
⚙️ How to Use:
Add the indicator to a 5-minute chart.
Go to Settings > Table System > Select "Auto Scanner".
Watch the table: Focus on the top rows showing "RUN 🚀". These are your live entry signals!
----------------------------------
🚀 مؤشر القناص: ORB Pro Sniper Edition – نظام المضاربة اللحظية المتكامل
يعتبر هذا المؤشر نظاماً آلياً متطوراً للمضاربين اللحظيين (Scalpers/Day Traders) يعتمد على استراتيجية كسر نطاق الافتتاح (ORB) الشهيرة، ولكنه معزز بخوارزميات ذكية لتصفية الفرص.
يتميز هذا الإصدار بوجود "ماسح هجين" (Hybrid Scanner) ونظام "تصنيف ذكي" يعطيك الزبدة ويعرض لك الفرص الحية فور حدوثها.
🔥 أهم المميزات:
نظام الماسح الهجين (Hybrid Scanner):
الوضع اليدوي (Manual): لمراقبة قائمتك الخاصة (5 أسهم تختارها أنت).
الماسح الآلي (Auto Scanner): يقوم المؤشر بمسح فوري لقائمة مدمجة تضم أقوى 20 سهم سيولة ومضاربة في السوق الأمريكي (مثل TSLA, NVDA, MSTR, COIN, وغيرها).
🧠 خوارزمية "القناص" للترتيب (Sniper Ranking): الجدول لا يعرض الأسهم عشوائياً، بل يركز على الفرصة الحالية:
🥇 الأولوية القصوى: للأسهم التي أعطت إشارة دخول (RUN 🚀) ولم تحقق الهدف بعد (هذه هي منطقة الدخول الذهبية).
🥈 الأولوية الثانية: للأسهم التي حققت أهدافها (WIN ✅).
🥉 الأولوية الأخيرة: للأسهم المتذبذبة أو الخاسرة.
دقة فنية عالية:
أهداف فيبوناتشي: تحديد آلي لأهداف جني الأرباح (1.618، 2.0، 2.618).
كشف الانعكاس (Reversal): يكتشف الاختراقات الكاذبة (Fakeouts) ويقلب الإشارة فوراً للدخول مع صناع السوق.
فلتر الترند: يستخدم متوسط 50 لمنع الدخول عكس الاتجاه العام.
إدارة المخاطر:
تأمين الصفقة (Breakeven): يرفع الوقف لسعر الدخول تلقائياً بعد تحقق الهدف الأول.
الوقف المتحرك: يلاحق الأرباح للحفاظ عليها.
⚙️ طريقة الاستخدام:
ضع المؤشر على فريم 5 دقائق.
من الإعدادات، اختر نظام الجدول "Auto Scanner".
راقب الجدول: ركز نظرك على الأسهم التي تظهر في أعلى القائمة بحالة "RUN 🚀".
⚠️ Disclaimer / إخلاء مسؤولية: This tool is for educational and analytical purposes only. Trading involves significant risk. Always manage your risk properly. هذه الأداة للأغراض التعليمية والتحليلية فقط. التداول ينطوي على مخاطر عالية.

Market Structure HighLow + Liquidity [MaB]📊 Market Structure HighLow + Liquidity A comprehensive indicator combining precision market structure analysis with real-time liquidity zone detection, built on a custom finite-state machine architecture.
━━━━━━━━━━━━━━━━━━━━━━━━━━━━━━━━━━━━━━━━
🎯 KEY FEATURES
• Automatic Swing Detection Identifies structural High/Low points using a dual-confirmation system (minimum candles + pullback percentage)
• Smart Trend Tracking Automatically switches between Uptrend (Higher Highs & Higher Lows) and Downtrend (Lower Highs & Lower Lows)
• Breakout Alerts Visual markers for confirmed breakouts (Br↑ / Br↓) with configurable threshold
• Sequential Labeling Clear numbered labels (L1, H2, L3, H4...) showing the exact market structure progression
• Color-Coded Structure Lines
• Green: Uptrend continuation legs
• Red: Downtrend continuation legs
• Gray: Trend inversion points
• Imbalance Zones (FVG) Automatically detects Fair Value Gaps that form during impulsive moves between validated swing points
• Inducement Zones Identifies potential liquidity traps - FVGs that form before breakout confirmation, often used as stop-hunt areas
• Dynamic Zone Management Zones automatically close when price touches them, with configurable retracement sensitivity
━━━━━━━━━━━━━━━━━━━━━━━━━━━━━━━━━━━━━━━━
🔬 TECHNICAL ARCHITECTURE
This indicator does NOT rely on TradingView's built-in ta.pivothigh() / ta.pivotlow() functions.
Instead, it implements a custom finite-state machine (FSM) that manages multiple monitoring states, alternating dynamically between Uptrend and Downtrend modes based on confirmed breakouts.
Core Components:
• State Machine Engine Multiple internal states handle candidate detection, validation, and confirmation phases. The system transitions between states based on price action triggers and confirmation criteria.
• Dual-Confirmation System Each swing point must satisfy two independent filters before validation:
o Time-based filter (minimum candles)
o Price-based filter (minimum retracement %)
• Directional Breakout Logic Separate breakout detection routines for uptrend continuation, downtrend continuation, and trend inversion scenarios. Each triggers specific state transitions.
• FVG Classification Engine Automatically distinguishes between Imbalance zones (post-confirmation FVGs) and Inducement zones (pre-confirmation FVGs) based on breakout timing context.
• Dynamic Zone Lifecycle Zones are created, monitored, and closed through a managed lifecycle with configurable touch sensitivity.
━━━━━━━━━━━━━━━━━━━━━━━━━━━━━━━━━━━━━━━━
⚙️ CONFIGURABLE PARAMETERS
Market Structure
• Analysis Start Date: Define when to begin structure analysis
• Min Confirmation Candles: Required candles for validation (default: 3)
• Pullback Percentage: Minimum retracement for confirmation (default: 10%)
• Breakout Threshold: Percentage beyond structure for breakout (default: 1%)
Liquidity
• Show Zones: Toggle visibility of imbalance and inducement zones
• Zone Colors: Customize colors for Supply/Demand imbalances and inducements
• Zone Retracement %: How deep price must enter zone to consider it touched (0-100%)
• Inactive Zones Transparency: Visual distinction for closed zones
Display
• Show Market Structure Table: Toggle info panel
• Replay Mode: Optimize for TradingView Replay feature
━━━━━━━━━━━━━━━━━━━━━━━━━━━━━━━━━━━━━━━━
🎨 ZONE COLOR CODING
• 🔴 Imbalance Supply (Red): Bearish FVG - potential resistance/short entry
• 🟢 Imbalance Demand (Green): Bullish FVG - potential support/long entry
• 🟠 Inducement Supply (Orange): Pre-breakout bearish FVG - possible stop-hunt zone
• 🔵 Inducement Demand (Blue): Pre-breakout bullish FVG - possible stop-hunt zone
━━━━━━━━━━━━━━━━━━━━━━━━━━━━━━━━━━━━━━━━
💡 HOW IT WORKS
1. Initializes state machine in UPTREND mode, searching for first swing Low
2. Tracks price movement and triggers candidate states upon potential reversals
3. Validates candidates through dual-confirmation (time + price filters)
4. Upon confirmation, scans price range for FVG patterns (3-candle gaps)
5. Classifies detected FVGs based on breakout timing (Inducement vs Imbalance)
6. Monitors breakout levels - triggers state transitions on confirmed breaks
7. Alternates between Uptrend/Downtrend modes based on breakout direction
8. Manages zone lifecycle - closes zones when price retraces into them
━━━━━━━━━━━━━━━━━━━━━━━━━━━━━━━━━━━━━━━━
🔧 BEST USED FOR
• Identifying key support/resistance levels with liquidity context
• Spotting potential reversal zones (imbalances)
• Avoiding stop-hunt traps (inducement awareness)
• Trend direction confirmation
• Breakout trading setups with confluence
• Multi-timeframe structure and liquidity analysis
• Understanding where institutional orders may be resting
━━━━━━━━━━━━━━━━━━━━━━━━━━━━━━━━━━━━━━━━
⚠️ NOTES
• Works best on higher timeframes (1H+) for cleaner structure
• Inducement zones often convert to Imbalance zones after breakout confirmation
• Zone Retracement % allows fine-tuning: 0% = first touch, 25% = quarter penetration, 100% = full traversal
• Inactive zones remain visible (faded) to show historical liquidity levels
• Use Replay Mode when backtesting to prevent buffer overflow errors

Liquidity ZonesThis indicator automatically identifies and plots high-probability support and resistance zones based on institutional flow and pivot math. Unlike standard indicators that show every possible level, this script uses a smart "Volume & Velocity" filter to only display zones where significant market activity occurred.
These zones represent Market Inefficiencies. They mark specific price levels where the market moved aggressively away from 'zones' without looking back. These 'gaps' in the auction process often act as magnets for price, forcing a return to the zone to fill pending institutional orders and rebalance the market
Key Features
1. Smart Filtering: Only plots zones created during selected timeframes with Strong Trend
Momentum or Price/Volume Divergence. Weak zones are automatically ignored to keep the
chart clean.
2. Auto-Invalidation: Zones are projected forward in time until price touches them. Once price
enters a zone, it automatically turns gray and stops extending, indicating the liquidity has
been tested.
How to Use
1. Blue Boxes (Fresh Zones): These are untested liquidity levels. Look for price reactions
(reversals or bounces) when price approaches these extended blue zones.
2. Sky Blue Boxes (Tested Zones): Once a candle touches a blue box, it turns Sky Blue. This
means the level is no longer "fresh" and should be treated with caution or ignored.
3. Timeframes: This indicator is fractal, meaning it works on any timeframe, you can use 1,3,5 for ltf confirmations and scalping and 15,30,1h for htf confluence or intraday trading
Settings
# Show Filtered Zones: Toggle the visibility of the boxes on/off.
# Zone Timeframe: Controls the data used to calculate the zones.
# Colors: Customize the color of Fresh (Untested) vs. Touched (Tested) boxes.
-- 1nonly V

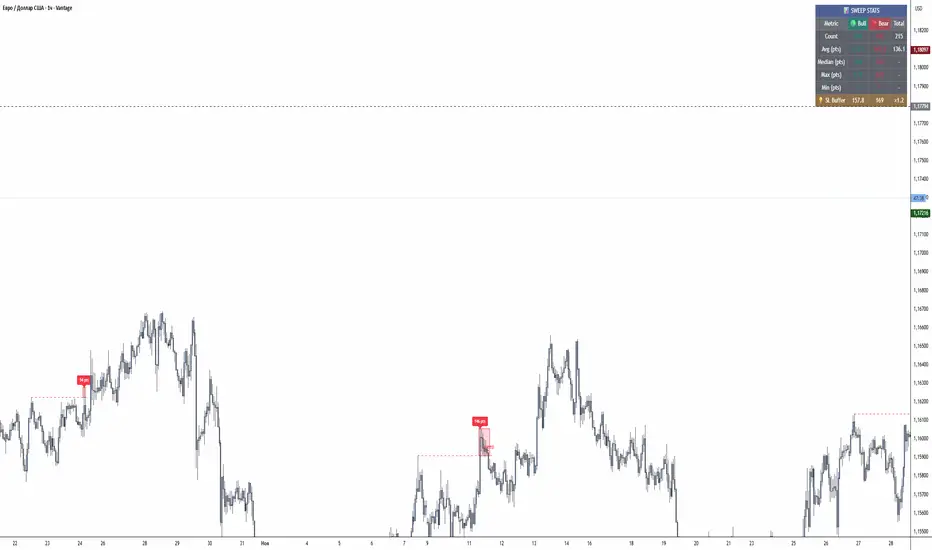
Sweep AnalyzerA comprehensive liquidity sweep detection indicator that identifies false breakouts (sweeps) of swing highs and lows, measures their depth, and provides statistical analysis to help optimize stop-loss placement.
🎯 Overview
This indicator is designed for traders who use Smart Money Concepts (SMC), ICT methodology, or price action strategies. It automatically detects when price “sweeps” (falsely breaks) key swing levels and returns back, which often indicates liquidity grabs by institutional traders.
The unique feature of this indicator is its ability to measure the depth of each sweep in points/pips and calculate statistics, helping you understand how far price typically goes beyond levels before reversing. This data is invaluable for setting optimal stop-loss distances.
⚙️ Features & Settings Explained
Settings Group
Cooldown Period (bars) — Minimum number of bars between sweep signals. Prevents multiple signals in the same area. Default: 10
Show Statistics Table — Toggle the statistics panel on/off
Table Position — Choose corner placement: Top Left, Top Right, Bottom Left, Bottom Right
Table Size — Small, Normal, or Large text size for the table
Pivot Settings
Pivot Left Bars — Number of bars to the left required to confirm a swing point. Higher values identify more significant levels. Default: 20
Pivot Right Bars — Number of bars to the right required to confirm a swing point. Default: 20
How it works: A swing high is confirmed when the high is higher than all bars within the left AND right lookback period. Same logic applies for swing lows (lowest of the range).
Sweep Detection
Sweep Lookback (bars ) — How far back to look for valid swing levels to sweep. Default: 100
Strict Mode (original logic) — When enabled, uses the original SFP (Swing Failure Pattern) detection which requires specific candle patterns. When disabled, uses enhanced detection that tracks multi-bar sweeps.
Enhanced Mode (Strict Mode OFF):
→ Detects sweeps that develop over multiple bars
→ Price can stay beyond the level for several candles
→ Tracks the deepest point reached during the sweep
→ More flexible and catches more setups
Strict Mode (ON):
→ Classic SFP detection
→ Requires price to sweep and close back in one move
→ More conservative, fewer but higher-quality signals
Sweep Filters
Max Bars in Sweep — Maximum bars price can stay beyond the level. If exceeded, it’s considered a breakout, not a sweep. Default: 10
Max Sweep Depth (ATR multiplier) — Maximum sweep depth as ATR multiple. Sweeps deeper than this are filtered out as breakouts. Default: 3.0
ATR Length — Period for ATR calculation used in filters. Default: 14
If price goes too deep beyond a level or stays there too long, it’s likely a real breakout, not a liquidity sweep. These filters prevent false signals during trending markets.
Sweep Confirmation
Confirmation Bars — How many consecutive bars price must close back beyond the level to confirm the sweep. Default: 2
Min Return Depth (ATR mult) — Minimum distance price must return beyond the level (as ATR multiple) to count as valid return. Default: 0.3
📊 Statistics Table
The table displays real-time statistics for all detected sweeps:
Count — Total number of sweeps detected (Bull/Bear/Total)
Avg (pts) — Average sweep depth in points. This is the key metric for SL placement
Median (pts) — Median sweep depth, useful when you have outliers
Max (pts) — Deepest sweep recorded
Min (pts) — Shallowest sweep recorded
SL Buffer — Suggested stop-loss distance (Average × 1.2)
⚠️ Important Notes
Point Calculation: The indicator automatically detects instrument type. For Forex with 5 decimals it displays in pipettes (multiply by 0.1 for pips). For Forex with 4 decimals it displays in pips. For other instruments it displays in points.
Historical Data: Statistics are calculated from all visible chart data. Scroll left to include more history for better averages.
Timeframe Matters: Sweep characteristics vary by timeframe. Run the indicator separately on each TF you trade.
Not Financial Advice: This indicator is a tool for analysis. Always combine with other confluence factors and proper risk management.
🔔 Alerts
Two alert conditions are available:
→ Bullish Sweep: Triggers when a bullish sweep is confirmed
→ Bearish Sweep: Triggers when a bearish sweep is confirmed
Set up alerts via TradingView’s alert menu for real-time notifications.
💡 Pro Tips
→ Start with defaults and adjust based on your instrument/timeframe
→ Increase Pivot bars (25-30) for higher timeframes to catch more significant levels
→ Decrease Max Bars in Sweep (5-7) for scalping to filter slow moves
→ Use Strict Mode if you want fewer but more reliable signals
→ Compare median vs average — if very different, you have outliers affecting your SL calculation
--------------------------------------------------------------------------------
Комплексный индикатор для определения свипов ликвидности (ложных пробоев) свинг-хаев и свинг-лоу. Измеряет глубину каждого свипа и предоставляет статистический анализ для оптимизации размещения стоп-лоссов.
🎯 Обзор
Индикатор разработан для трейдеров, использующих концепции Smart Money (SMC), методологию ICT или стратегии Price Action. Он автоматически определяет моменты, когда цена “свипает” (ложно пробивает) ключевые свинг-уровни и возвращается обратно, что часто указывает на сбор ликвидности институциональными игроками.
Уникальная особенность индикатора — измерение глубины каждого свипа в пунктах/пипсах и расчёт статистики. Это помогает понять, как далеко цена обычно заходит за уровень перед разворотом. Эти данные бесценны для установки оптимального расстояния стоп-лосса.
⚙️ Описание функций и настроек
Основные настройки (Settings)
Strict Mode — Включает строгий режим с оригинальной логикой SFP. При выключении используется расширенное определение многобаровых свипов.
Cooldown Period (bars) — Минимальное количество баров между сигналами свипа. Предотвращает множественные сигналы в одной области. По умолчанию: 10
Show Statistics Table — Включить/выключить панель статистики
Table Position — Выбор угла размещения: Top Left, Top Right, Bottom Left, Bottom Right
Table Size — Размер текста таблицы: Small, Normal, Large
Настройки пивотов (Pivot Settings)
Pivot Left Bars — Количество баров слева, необходимое для подтверждения свинг-точки. Большие значения определяют более значимые уровни. По умолчанию: 20
Pivot Right Bars — Количество баров справа, необходимое для подтверждения свинг-точки. По умолчанию: 20
Как работает: Свинг-хай подтверждается, когда максимум свечи выше всех баров в пределах левого И правого периода просмотра. Та же логика применяется для свинг-лоу (минимум диапазона).
Определение свипа (Sweep Detection)
Sweep Lookback (bars) — Как далеко назад искать валидные свинг-уровни для свипа. По умолчанию: 100
Расширенный режим (Strict Mode ВЫКЛ):
→ Определяет свипы, развивающиеся на нескольких барах
→ Цена может оставаться за уровнем несколько свечей
→ Отслеживает самую глубокую точку во время свипа
→ Более гибкий, ловит больше сетапов
Строгий режим (Strict Mode ВКЛ):
→ Классическое определение SFP
→ Требует свип и закрытие обратно за один бар
→ Более консервативный, меньше но более качественных сигналов
Фильтры свипа (Sweep Filters)
Max Bars in Sweep — Максимальное количество баров, которое цена может находиться за уровнем. При превышении считается пробоем, а не свипом. По умолчанию: 10
Max Sweep Depth (ATR multiplier) — Максимальная глубина свипа как множитель ATR. Свипы глубже этого значения фильтруются как пробои. По умолчанию: 3.0
ATR Length — Период для расчёта ATR, используемого в фильтрах. По умолчанию: 14
Если цена заходит слишком глубоко за уровень или остаётся там слишком долго, это скорее всего реальный пробой, а не свип ликвидности. Эти фильтры предотвращают ложные сигналы на трендовых рынках.
Подтверждение свипа (Sweep Confirmation)
Confirmation Bars — Сколько баров подряд цена должна закрываться обратно за уровнем для подтверждения свипа. По умолчанию: 2
Min Return Depth (ATR mult) — Минимальное расстояние, на которое цена должна вернуться за уровень (как множитель ATR), чтобы считаться валидным возвратом. По умолчанию: 0.3
📊 Таблица статистики
Таблица отображает статистику в реальном времени для всех обнаруженных свипов:
Count — Общее количество свипов (Bull/Bear/Total)
Avg (pts) — Средняя глубина свипа в пунктах. Ключевая метрика для размещения SL
Median (pts) — Медианная глубина свипа, полезна при наличии выбросов (аномальное значение, сильно отличающееся от остальных.)
Max (pts) — Самый глубокий свип
Min (pts) — Самый мелкий свип
SL Buffer — Рекомендуемое расстояние стоп-лосса (Среднее × 1.2)
⚠️ Важные замечания
Расчёт пунктов: Индикатор автоматически определяет тип инструмента. Для Forex с 5 знаками отображает в пипетках (умножьте на 0.1 для пипсов). Для Forex с 4 знаками отображает в пипсах. Для других инструментов отображает в пунктах.
Исторические данные : Статистика рассчитывается по всем видимым данным графика. Прокрутите влево, чтобы включить больше истории для лучших средних значений.
Таймфрейм важен: Характеристики свипов различаются на разных таймфреймах. Запускайте индикатор отдельно на каждом ТФ, который торгуете.
Не является финансовой рекомендацией: Этот индикатор — инструмент для анализа. Всегда комбинируйте с другими факторами подтверждения и правильным управлением рисками.
🔔 Алерты
Доступны два условия для алертов:
→ Bullish Sweep: Срабатывает при подтверждении бычьего свипа
→ Bearish Sweep: Срабатывает при подтверждении медвежьего свипа
💡 Советы
→ Начните с настроек по умолчанию и корректируйте под ваш инструмент/таймфрейм
→ Увеличьте Pivot bars (25-30) для старших таймфреймов, чтобы ловить более значимые уровни
→ Уменьшите Max Bars in Sweep (5-7) для скальпинга, чтобы фильтровать медленные движения
→ Используйте Strict Mode если хотите меньше, но более надёжных сигналов
→ Сравнивайте медиану и среднее — если сильно отличаются, у вас есть выбросы, влияющие на расчёт SL
Consolidation Zones Volume Delta | Flux ChartsGENERAL OVERVIEW:
The Consolidation Zones Volume Delta | Flux Charts indicator is designed to identify and visualize consolidation zones on the chart. Rather than only outlining areas of sideways price movement, the indicator analyzes volume activity occurring inside each consolidation zone. This is done by aggregating lower-timeframe volume data into the higher-timeframe consolidation range, allowing users to see how buying and selling activity evolves while price remains in a range.
What is the theory behind the indicator?:
The indicator is built around three core analytical concepts that guide how consolidation zones are detected and evaluated.
1. Consolidation as a structural phase
Periods of consolidation are characterized by reduced directional movement and compressed price ranges. During these phases, price action often alternates within a defined high–low boundary, creating a structure that can be objectively measured and tracked over time.
2. Volume behavior inside consolidation
While price may appear balanced within a consolidation range, volume activity inside that range can vary. The indicator evaluates volume contributions occurring within the vertical boundaries of the consolidation zone by using lower-timeframe data and weighting each candle’s volume based on its overlap with the zone. This produces an internal volume delta profile that reflects how buying and selling volume accumulates throughout the consolidation.
Delta behavior inside a zone may show:
Persistent dominance of buying or selling volume
Alternating shifts between buyers and sellers
Periods of relatively balanced participation
3. Markets consolidate in multiple ways, one detection method is not enough
Markets do not consolidate in a single, uniform way. To account for this, the indicator includes three distinct consolidation detection methods. Each method is calculated objectively, does not repaint, and targets a different type of sideways or low-expansion price behavior:
Candle Compression
ADX Low Trend Strength
Visual Range Boundaries
CONSOLIDATION ZONES VOLUME DELTA FEATURES:
The Consolidation Zones Volume Delta indicator includes 4 main features:
Consolidation Zones
Volume Delta
Standard Deviation Bands
Alerts
CONSOLIDATION ZONES:
🔹What is a Consolidation Zone?
A consolidation zone is a defined price range where market movement becomes compressed and price remains contained within clear upper and lower boundaries for a sustained period of time. During this phase, price does not establish a strong directional trend and instead oscillates within a relatively narrow range.
🔹Consolidation Zone Detection
The indicator automatically detects consolidation zones using three independent, rule-based methods. Each method evaluates a different market condition and can be selected individually depending on how you want consolidation to be defined. Regardless of the method used, all zones are calculated objectively and finalized once confirmed.
◇ Candles (Candle Compression)
The Candles method identifies consolidation by detecting periods of candle compression and reduced range expansion. A candle is considered part of a consolidation sequence when:
The candle body is small relative to its total range
The candle’s high–low range is smaller than the short-term Average True Range (ATR)
ATR is calculated using a 4-period average true range and is used as a volatility reference. If consecutive candles continue to meet these compression conditions, the indicator increments an internal count.
Under the Consolidation Candles section in the settings, you’ll find two controls.
Min. Consolidation Candles setting
This defines how many consecutive compressed candles are required before a consolidation zone is confirmed. Candle compression is determined using candle structure and short-term ATR, ensuring that only periods of reduced range expansion are counted. Once the minimum threshold is reached, the indicator creates a consolidation zone using the highest high and lowest low formed during the compressed sequence.
Mark Consolidation Candles
When enabled, the indicator highlights candles that meet the compression criteria, making it easy to visually identify which candles contributed to the formation of the consolidation zone.
◇ ADX (Low Trend Strength)
The ADX method identifies consolidation based on weak or declining trend strength rather than candle structure. This method uses the Average Directional Index (ADX) to determine when directional movement is reduced.
ADX is calculated using directional movement values that are smoothed over time. When ADX remains below a user-defined threshold, price is treated as being in a low-trend market. While this condition persists, the indicator tracks the highest high and lowest low formed during the low-trend period.
Under the ADX Settings section in the settings, you’ll find the following controls.
ADX Length
Defines the lookback period used to calculate directional movement for ADX.
ADX Smoothing
Controls the smoothing applied to the ADX calculation.
ADX Threshold
Sets the level below which ADX must remain for the market to be considered consolidating.
Consolidation Strength
Defines how many consecutive candles’ ADX must stay below the threshold before a consolidation zone is confirmed. Once this requirement is met, the indicator creates a consolidation zone using the accumulated high and low from the low-trend window.
Mark Candles Below Threshold
When enabled, the indicator highlights candles where ADX remains below the threshold.
◇ Visual Range
The Visual Range method identifies consolidation by detecting clearly defined horizontal price ranges where price remains contained for a sustained period of time. The indicator continuously tracks the rolling highest high and lowest low across recent candles. When price remains inside the same high–low boundaries without breaking above or below the range, an internal counter advances.
Under the Visual Range section in the settings, you’ll find the following control.
Min. Candles in Range
Defines how many consecutive candles must remain fully contained within the same high–low range before a consolidation zone is confirmed. Once this requirement is met, the indicator creates a consolidation zone using the established range boundaries.
🔹Consolidation Zone Settings
◇ Invalidation Method
Users can choose how Consolidation Zones are invalidated, selecting between Close Break or Wick Break.
Close Break: A Consolidation Zone is invalidated when a candle closes above/below the zone.
Wick Break: A Consolidation Zone is invalidated when a candle’s wick goes above/below the zone.
◇ Merge Overlapping Zones
When enabled, overlapping Consolidation Zones are automatically combined into one unified zone.
◇ Show Last
This setting determines how many Consolidation Zones are displayed on your chart. For example, setting this to 5 will display the 5 most recent zones.
VOLUME DELTA:
Delta Volume visualizes how buying and selling volume accumulates inside each consolidation zone. Instead of using the full candle volume, the indicator isolates only the volume that occurs within the vertical boundaries of the zone. This allows you to see whether bullish or bearish volume is dominating while price remains range-bound. The visualization updates in real time while the zone is active and reflects cumulative participation rather than individual candles.
🔹How Volume Delta is Calculated
Delta Volume is calculated using lower-timeframe data and applied to the higher-timeframe consolidation zone.
Each candle’s volume is split into bullish or bearish volume based on candle direction.
Lower-timeframe candles are pulled using the selected delta timeframe.
For each lower-timeframe candle, only the portion of volume that vertically overlaps the consolidation zone is counted.
Volume is weighted by the amount of overlap between the candle’s range and the zone’s range.
Bullish and bearish volume are accumulated over time to form a running, cumulative delta profile for the zone.
🔹Volume Delta Settings
◇ Enable
Turns the Delta Volume visualization on or off. Consolidation zones continue to plot when disabled.
◇ Show Delta %
Displays the percentage breakdown of bullish versus bearish volume inside the consolidation zone. Percentages are derived from cumulative volume totals.
◇ 3D Visual
When enabled, the delta blocks are extended diagonally using a depth offset derived from the instrument’s daily ATR. This creates visible side faces and top faces for the delta blocks, simulating depth without altering any calculations. The 3D effect is purely visual. It does not change how volume is calculated, weighted, or accumulated.
Users can control the intensity of the 3D effect choosing a value between 1 and 5. Increasing this value increases:
The horizontal offset of the delta blocks
The vertical depth projection applied to the volume faces
Higher values produce a more pronounced 3D appearance by pushing the delta visualization further away from the consolidation box. Lower values keep the visualization flatter and closer to the box boundaries. The depth scaling is normalized using ATR, so the effect adapts proportionally to the instrument’s volatility.
◇ Volume Delta Display Style
Controls how bullish and bearish volume are displayed inside the Consolidation Zone:
Horizontal: Volume is split top-to-bottom within the zone
Vertical: Volume is split left-to-right across the zone
◇ Timeframe
Defines the lower timeframe used for Volume Delta calculations. When a timeframe is selected, the indicator pulls lower-timeframe price and volume data and maps it into the higher-timeframe consolidation zone. Each lower-timeframe candle is evaluated individually. Only the portion of its volume that vertically overlaps the consolidation zone is included, and that volume is weighted based on the candle’s overlap with the zone’s price range. If the Timeframe field is left empty, the indicator defaults to using the chart’s current timeframe for delta calculations.
Using a lower timeframe increases the granularity of the delta calculation, allowing volume changes inside the zone to be measured more precisely. Using a higher timeframe produces a smoother, less granular delta profile.
Please Note: Delta rendering is automatically limited to available lower-timeframe data to prevent incomplete or distorted visuals when historical lower-timeframe volume is unavailable due to TradingView data limits.
STANDARD DEVIATION BANDS:
Standard Deviation Bands project measured price distance away from a confirmed consolidation zone using the size of that zone as the reference unit. Rather than calculating volatility from historical price dispersion, the bands are derived directly from the height of the consolidation range itself. Each band represents a fixed multiple of the consolidation zone’s height and is plotted symmetrically above and below the zone.
🔹How the bands are calculated
Once a consolidation zone is finalized, the indicator calculates the zone height as:
Zone Height = Zone High − Zone Low
This value becomes the base measurement for all deviation calculations. For each enabled band:
Upper bands are placed above the consolidation zone’s high
Lower bands are placed below the consolidation zone’s low
The distance of each band from the zone is calculated by multiplying the zone height by the selected band multiplier. These band levels are fixed relative to the consolidation zone and do not recalculate based on future price movement.
🔹Standard Deviation Band Settings
◇ Band 1
Enables the first deviation band above and below the consolidation zone. The Band 1 multiplier defines how far the band is placed from the zone in terms of zone height. For example, a multiplier of 1 plots the band one full zone height above and below the consolidation range.
◇ Band 2
Enables a second deviation band at a greater distance from the consolidation zone. Band 2 uses its own multiplier and is calculated independently of Band 1, allowing multiple expansion levels to be displayed simultaneously.
◇ Fill Bands
When enabled, the area between the consolidation zone and each deviation band is filled with a semi-transparent color. Upper fills apply to bands above the zone, and lower fills apply to bands below the zone. Fills are static and tied directly to the consolidation zone boundaries.
◇ Color Customization
Each deviation band has independent color controls for:
Upper band lines and fills
Lower band lines and fills
This allows users to visually distinguish between bullish and bearish extensions as well as between multiple deviation levels.
ALERTS:
Users can create alerts for the following:
New Consolidation Zone Formed
Consolidation Zone Break
UNIQUENESS:
This indicator combines multiple consolidation detection methods with lower-timeframe volume delta analysis inside each consolidation zone. It visualizes bullish and bearish volume using weighted overlap logic and optional 3D rendering for improved clarity. Users can choose how volume is displayed, apply structure-based deviation bands, and enable alerts for new zones and zone breaks. All features are rule-based, configurable, and designed to work together within a single framework.

Plan Your Trade, Trade Your Plan. Levels. - by TenAMTrader📍 Plan Your Trade, Trade Your Plan. Levels. — by TenAMTrader
Successful trading is rarely about predicting — it’s about preparing.
"Plan Your Trade, Trade Your Plan. Levels" is designed to bridge the gap between analysis and execution by forcing clarity before the trade ever happens. Instead of reacting to price in real time, this tool encourages traders to define their plan, map their key levels, and then simply trade what they already decided.
🧠 Why Planning Matters
Most trading mistakes don’t come from bad analysis — they come from abandoning a plan mid-trade. Emotions take over when levels aren’t clearly defined ahead of time.
This indicator is built around a simple philosophy:
Make the plan first. Trade the plan second.
By writing your thesis directly into the indicator and visually anchoring it to price, you remove ambiguity and hesitation when the market starts moving.
📊 What This Indicator Does
Converts your written trade plan or market outlook into clearly plotted price levels
Automatically identifies:
Pivot level (key decision point)
Resistance levels (above pivot)
Support levels (below pivot)
Displays contextual notes directly on the chart so you always remember why a level matters
Keeps your focus on execution, not interpretation
✍️ How to Use It
Paste your daily or weekly plan into the Input your Plan/Levels box
Let the script extract and plot the levels automatically
Observe how price behaves around predefined zones
Execute only what aligns with your original plan
No guesswork. No moving targets.
🎯 Designed For
Traders who value structure and discipline
Futures, index, and equity traders who trade key levels
Traders focused on process over prediction
⚠️ Important Disclaimer
This indicator is provided for educational and informational purposes only and does not constitute financial advice, investment advice, or a recommendation to buy or sell any security, futures contract, or financial instrument.
Trading involves substantial risk and is not suitable for all investors. Past performance is not indicative of future results. All trading decisions, risk management, and position sizing are the sole responsibility of the user.
By using this indicator, you acknowledge that TenAMTrader assumes no liability for any losses, damages, or decisions made based on its use.
Trade prepared. Trade disciplined.
"Plan Your Trade, Trade Your Plan.
— TenAMTrader

Opposite Candle Break Finder version 1 This is a simple indicator which detects last candle that was engulfed by the close of the opposite color candle - Bear in mind you need to wait till the candle is closed
feel free to ask me for the code since I am not a professional coder at all any coder wants update it they feel free to contact me. at Adel4traders@gmail.com

SCOTTGO - Buy Sell Volume📊 SCOTTGO - Buy Sell Volume Bars - Delta - Up Down Volume Bars
This indicator disaggregates the total volume traded on each bar into estimated Buying Volume and Selling Volume to visualize market pressure and dominance directly in a dedicated sub-pane.
Key Features:
Volume Disaggregation: Uses a standard formula to estimate how much of a bar's total volume was associated with upward (buying) pressure and how much was associated with downward (selling) pressure.
Visual Clarity: Plots the Buy Volume (teal, upward) and Sell Volume (red, downward) as separate columns against a transparent total volume background, allowing for quick assessment of pressure balance.
Real-Time Badge: A dynamic badge is fixed to the corner of the chart (default: Top Right) providing a numeric summary of the latest bar:
Buy %: Percentage of the bar's total volume estimated as Buying Volume.
Sell %: Percentage of the bar's total volume estimated as Selling Volume.
Delta %: The magnitude of the volume difference (Delta) as a percentage of total volume, indicating the strength of the dominant side.
Dominance Indicator: The background color of the badge changes dynamically to immediately signal whether Buying (customizable color, default: Teal) or Selling (customizable color, default: Red) pressure was dominant on the current bar.
Usage:
Traders can use this tool to identify periods of heavy accumulation (high Buy Volume) or distribution (high Sell Volume), providing insight into the conviction behind price movements.

Pivot Points High LowGaneshA Pivot Points High/Low indicator that:
Detects swing highs (ta.pivothigh) and swing lows (ta.pivotlow) using configurable left/right bar lengths.
Draws labels at the confirmed pivot points:
Down labels at pivot highs (potential resistance).
Up labels at pivot lows (potential support).
Lets you customize text color and label fill color separately for highs and lows.
It’s designed for overlay (on-price chart), with max_labels_count=500 to allow many labels.

GMMA fill (v5) + Golden Crossover HighlightsGMMA Fill (v5) + Golden Crossover Highlights
This setup combines the Guppy Multiple Moving Average (GMMA) Fill version 5 with Golden Crossover signals to identify strong trend continuation and potential breakout points. GMMA provides layered moving averages for short- and long-term trend analysis, while the Golden Crossover highlights bullish momentum shifts, making it ideal for spotting entry opportunities in trending markets.

Opposite Candle Zone Identifier (v6) - Extended🔍 Opposite Candle Zone Identifier (Extended)
Opposite Candle Zone Identifier is a price-action based indicator designed to identify potential reversal or absorption zones by detecting candles that move against the surrounding trend.
The indicator highlights a central opposite candle (or group of candles) that is surrounded by candles moving in the opposite direction, both before and after the central candle.
This structure often represents areas where institutional activity, absorption, or supply/demand imbalance may occur.
📌 How the Indicator Works
The indicator analyzes price action using three configurable blocks:
1️⃣ Candles Before (Backward)
A user-defined number of candles before the central candle(s) must follow a consistent trend:
Bullish candles for a bearish zone
Bearish candles for a bullish zone
2️⃣ Central Candle(s)
The core of the pattern:
Default: 1 opposite candle
Can be increased (up to 5) to adapt the indicator to lower timeframes or noisier markets
This central block must move against the previous trend, signaling a potential shift or absorption area.
3️⃣ Candles After (Forward)
A user-defined number of candles after the central candle(s) must resume the original trend, confirming the pattern.
⚠️ The signal is confirmed only after the “after” candles are completed.
This avoids repainting and ensures structural confirmation.
📐 Zone Concept
The highlighted central candle (or candles) can be used to define a price zone:
The high and low of the central candle(s) represent a potential supply or demand zone
These zones can be used for:
Reversal areas
Reaction zones
Entry refinement
Stop placement
⚙️ Inputs & Customization
Number of candles before
Controls how many candles must follow the initial trend.
Number of candles after
Defines how many candles are required for confirmation.
Central candles count
Default is 1, but can be increased (e.g. 2) for:
Lower timeframes
More reliable structure
Reduced noise
ATR-based offset
Labels are positioned using a dynamic ATR offset to improve chart readability across different markets and timeframes.
📈 Bullish & Bearish Zones
🟢 Bullish Zone
Bearish candles before
Bullish central candle(s)
Bearish candles after
Indicates potential demand or accumulation zone
🔴 Bearish Zone
Bullish candles before
Bearish central candle(s)
Bullish candles after
Indicates potential supply or distribution zone
🧠 Best Use Cases
Works best on 15m and higher timeframes
Effective on:
Indices
Forex majors
Liquid cryptocurrencies
Can be combined with:
Trend filters (EMA, VWAP)
Support & resistance
Market structure analysis
⚠️ Notes
This indicator is confirmation-based, not predictive
Signals appear only after pattern completion
It does not repaint
Best used as a confluence tool, not as a standalone trading system
🎯 Summary
Opposite Candle Zone Identifier helps traders:
Detect opposite-direction candles within strong trends
Identify potential supply and demand zones
Adapt the pattern to different timeframes
Improve price-action based decision making

CRT - Candle Range TheoryCRT - Candle Range Theory is an indicator that identifies CRT patterns based on the concept of liquidity sweeps and price rejection.
WHAT IS CRT?
A CRT (Candle Range Theory) pattern occurs when:
- A "Parent" candle establishes a range (High/Low)
- The next candle sweeps beyond one side of that range (liquidity grab)
- But closes back INSIDE the parent range (rejection)
This creates a potential reversal signal as liquidity has been taken and price rejected continuation.
PATTERN TYPES
BEARISH CRT
- CRT candle sweeps above Parent High
- Does NOT sweep below Parent Low
- Closes inside Parent range
BULLISH CRT
- CRT candle sweeps below Parent Low
- Does NOT sweep above Parent High
- Closes inside Parent range
ALERT TYPES
The indicator offers three alert filters based on the strength of rejection:
1. Close NOT Reach 50%
Strongest rejection - Close doesn't even retrace to the 50% level of the parent range.
Bearish: Close > 50% | Bullish: Close < 50%
2. Price NOT Reach 50%
Price (wick) doesn't reach the 50% level at all.
Bearish: Low > 50% | Bullish: High < 50%
3. Basic CRT
Any valid CRT pattern without the 50% filter.
VISUAL ELEMENTS
- PH / PL lines: Parent candle High and Low
- 50% line: Middle of the parent range
- 25% / 75% lines: Quarter levels of the parent range
- Labels: Appear on CRT candle showing pattern type and conditions met
HOW TO USE
1. Set your preferred chart timeframe
2. Enable the alert types you want to monitor
3. Create alerts via the TradingView alert menu
4. Labels will automatically appear when conditions are met
SETTINGS
Visual Settings
- Colors for PH/PL, 50%, and 25%/75% lines
- Line widths for each level type
- Toggle visibility for 50% and quarter lines
CRT Alerts
- Show/hide labels on chart
- Customize bearish/bullish label colors
- Enable/disable each alert type independently
NOTES
- This indicator works on any timeframe
- Multiple conditions can be displayed in one label if enabled
- Outside bars (sweep both sides) are excluded from CRT detection
- Close must be inside parent range for valid pattern
