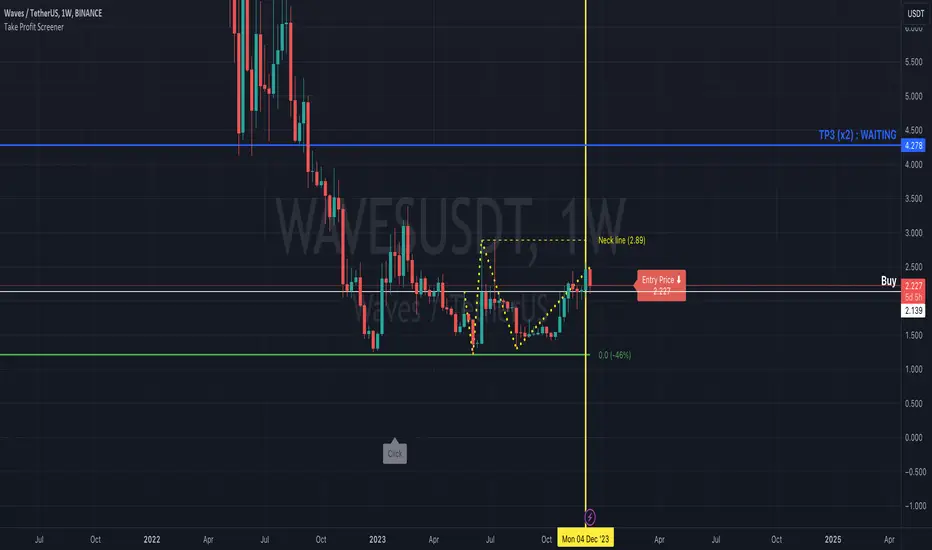
Take Profit ScreenerI'm going to introduce you to the Take Profit Screener tool.
It allows you to manually scan your watchlist to determine at a glance the assets that have the best profitability potential.
It is a 2 in 1 tool that allows you to :
identify where your Take Profit ratios are located whether you are in SHAD or Cycle Strategy
identify the potential reward percentages when approaching the key Fibonacci levels
Before you start using it, you need to:
sort your watchlist according to the price (Last) in order to have price ranges more or less close to each other when jumping from a symbol to another
disable the Auto Scale and Magnet feature
select your first symbol
display the tool (the indicator more exactly)
The settings dialog box is organised in 3 sections:
Strategy : By setting this section, you will answer the question " Where do my Take Profit ratios stand in relation to my entry price, and according to Risk Management Strategy adopted (SHAD or Cycle)? "
Fibonacci : By setting this section, you will answer the question " What percentage gain can I expect as I approach one of the key Fibonacci levels? "
Layout : This is the settings for the look and feel
Strategy Section
Active : This part of the indicator won't display on your chart if unchecked
Type : Choose between SHAD or Cycle Strategy. When choosing SHAD, you can select 2, 4, 8 or 16 SHAD Levels. When choosing Cycle, you can enter whatever ratio value you wish in the Strategy Ratio (Cycle only) input.
SHAD xNN : When choosing SHAD Strategy, you should select at least one level and more if need be.
Strategy Ratio (Cycle only) : When choosing Strategy Type Cycle, you can enter whatever ratio value you wish there.
Freeze Entry Price & Value : Leave it unchecked whenever the current price of the asset is located within your desired area (i.e. Reload Zone) while attempting to estimate its potential reward. Conversely, keep it checked whenever the current price of the asset is outside your desired area, but you need to anticipate the potential reward of this asset if its price reaches a certain level, your Entry price. Enter this price there and check the box.
Show price : If checked, both Take Profit ratio and Price are displayed. If unchecked, then price is hidden.
Extend Line : If checked, then lines showing Take Profit levels extend to the left.
Label Offset : If checked, then the label that displays Take Profit ratio and price shift to the right by a value that ranges from 0 to 100 candles.
Label Style : You can choose between Right or Top. This will determine the orientation of the label.
Fibonacci Section
Active : This part of the indicator won't display on your chart if unchecked
Type : Choose between SHAD or Cycle Strategy. When choosing SHAD, you can select 2, 4, 8 or 16 SHAD Levels. When choosing Cycle, you can enter whatever ratio value you wish in the Strategy Ratio (Cycle only) input.
SHAD xNN : When choosing SHAD Strategy, you should select at least one level and more if need be.
Strategy Ratio (Cycle only) : When choosing Strategy Type Cycle, you can enter whatever ratio value you wish there.
Freeze Entry Price : Leave it unchecked whenever the current price of the asset is located within your desired area (i.e. Reload Zone) while attempting to estimate its potential reward. Conversely, keep it checked whenever the current price of the asset is outside your desired area, but you need to anticipate the potential reward of this asset if its price reaches a certain level, your Entry price. Enter this price there and check the box.
Color : You can define the color of Fibonacci line levels
Retracement
QaSH Momentum EntriesThis script implements a variation of the Rob Hoffman's Inventory Retracement strategy, with entries being triggered by inventory retracement candles. Various confirmation parameters are available, such as
EMA slope for momentum confirmation
multi-timeframe EMA
multi-timeframe Ehler's mother of all moving averages
volume confirmation
Position management tools include
up to 3 orders can be tracked simultaneously and independently as a method of pyramiding into and out of a position
unique order ID's that pass along into the alert message (for helping the automation service manage positions)
entry filters based on current position profit
entry filters based on entry frequency
trade timers that can end a position after a specified amount of time
moving the stoploss when in profit
various parameters can be passed along into the alerts

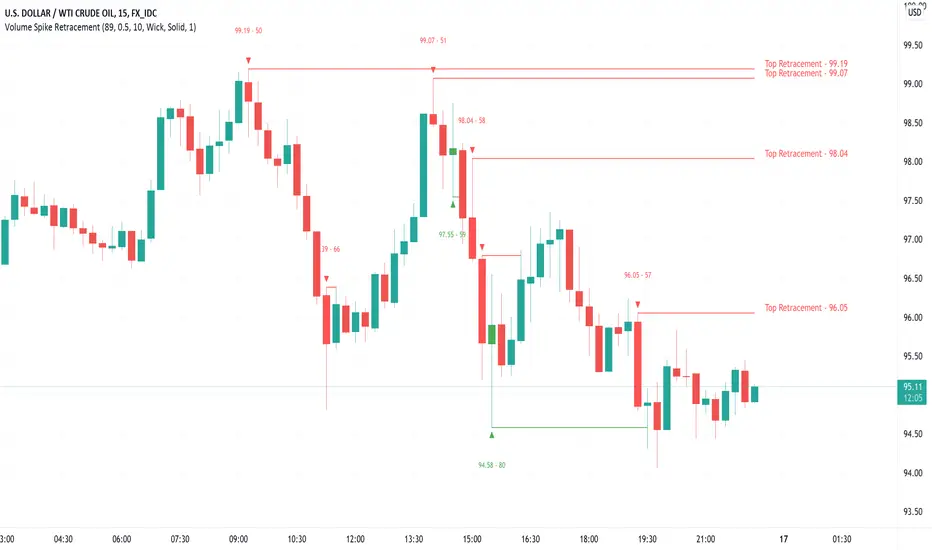
Volume Spike Retracement█ OVERVIEW
-Following many people's request to add "Volume" mode again in my "Institutional OrderBlock Pressure" script. I decided to release an improved
and full-fledged script. This will be the last OB/Retracement script I will release as we have explored every possible way to find them.
█ HOW TO INTERPRET?
-The script uses the the 0.5 Pivot and the maximum value set for Volume Length to find 'Peak Volume'. Once these conditions are met,
the script starts creating a Retracement Line.
-By default, the Volume Length value is set to 89, which works well with most Timeframes following the OrderBlocks/Retracements
logic used in my scripts.
-You have the option to set Alerts when the "Volume Spike Limit" is reached or when a Price Crossing with a Line occurs.
█ NOTES
- Yes Alerts appear instantly. Moreover, they are not 'confirmed', you must ALWAYS wait for confirmation before making a choice.
Good Trade everyone and remember, risk management remains the most important!
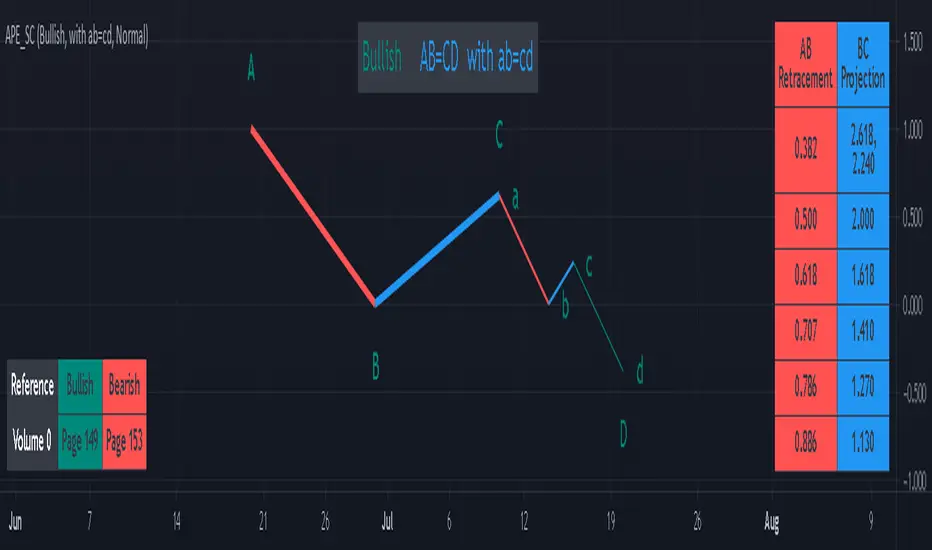
AB=CD Pattern Educational (Source Code)This indicator was intended as educational purpose only for AB=CD Patterns.
AB=CD Patterns were explained and modernized starting from The Harmonic Trader and Harmonic Trading: Volume One until Volume Three written by Scott M Carney.
Indikator ini bertujuan sebagai pendidikan sahaja untuk AB=CD Pattern.
AB=CD Patterns telah diterangkan dan dimodenkan bermula dari The Harmonic Trader dan Harmonic Trading: Volume One hingga Volume Three ditulis oleh Scott M Carney.
Indicator features :
1. List AB=CD patterns including ratio and reference page.
2. For desktop display only, not for mobile.
Kemampuan indikator :
1. Senarai AB=CD pattern termasuk ratio and rujukan muka surat.
2. Untuk paparan desktop sahaja, bukan untuk mobile.
FAQ
1. Credits / Kredit
Scott M Carney
Scott M Carney, Harmonic Trading: Volume One until Volume Three
2. Pattern and Chapter involved / Pattern dan Bab terlibat
Ideal AB=CD - The Harmonic Trader - Page 118 & 129
Standard AB=CD - The Harmonic Trader - Page 116, 117, 127 & 128, Harmonic Trading: Volume One - Page 42, 51, Harmonic Trading: Volume Three - Page 76 & 78
Alternate AB=CD - The Harmonic Trader - Page 142 & 145, Harmonic Trading: Volume One - Page 62, 63
Perfect AB=CD - Harmonic Trading: Volume One - Page 64 & 66
Reciprocal AB=CD - Harmonic Trading: Volume Two - Page 74 & 76
AB=CD with ab=cd - The Harmonic Trader - Page 149 & 153
AB=CD with BC Layering Technique - Harmonic Trading: Volume Three - Page 81 & 84
3. Code Usage / Penggunaan Kod
Free to use for personal usage but credits are most welcomed especially for credits to Scott M Carney.
Bebas untuk kegunaan peribadi tetapi kredit adalah amat dialu-alukan terutamanya kredit kepada Scott M Carney.
Bullish / Bearish Ideal AB=CD
Bullish / Bearish Standard AB=CD
Bullish / Bearish Alternate AB=CD
Bullish / Bearish Perfect AB=CD
Bullish / Bearish Reciprocal AB=CD (Additional value for reciprocal retracement 3.140 and 3.618)
Bullish / Bearish AB=CD with ab=cd
Bullish / Bearish AB=CD with BC Layering Technique
Harmonic Trading Ratios Educational (Source Code)This table indicator was intended as educational purpose only for Harmonic Trading Ratios.
The ratios are used for Harmonic AB=CD and XAB=CD.
Ratio calculation are shown for Retracement and Projection based Primary, Primary Derived, Secondary Derived and Secondary Derived Extreme.
Primary Retracement : 0.618
Primary Projection : 1.618
Please take note that Secondary Derived Extreme is only available for Projection.
Indikator berjadual bertujuan sebagai pendidikan sahaja untuk Harmonic Trading Ratios.
Ratio digunakan untuk Harmonic AB=CD and XAB=CD.
Pengiraan ratio untuk Retracement and Projection adalah berdasarkan Primary, Primary Derived, Secondary Derived dan Secondary Derived Extreme.
Primary Retracement : 0.618
Primary Projection : 1.618
Sila ambil perhatian bahawa Secondary Derived Extreme adalah untuk Projection sahaja.
The values shown in table was based on Harmonic Trading: Volume One, Page 18 written by Scott M Carney.
Nilai yang ditunjukkan dalam jadual adalah berdasarkan buku Harmonic Trading: Volume One, Page 18 ditulis oleh Scott M Carney.
Indicator features :
1. List Harmonic Trading Ratios including calculation.
2. Show and draw individual Harmonic Trading Ratio.
3. For desktop display only, not for mobile.
Kemampuan indikator :
1. Senarai Harmonic Trading Ratios termasuk pengiraan.
2. Memapar dan melukis Harmonic Trading Ratio secara berasingan.
3. Untuk paparan desktop sahaja, bukan untuk mobile.
FAQ
1. Credits / Kredit
Scott M Carney,
Scott M Carney, Harmonic Trading: Volume One
2. Code Usage / Penggunaan Kod
Free to use for personal usage but credits are most welcomed especially for credits to Scott M Carney.
Bebas untuk kegunaan peribadi tetapi kredit adalah amat dialu-alukan terutamanya kredit kepada Scott M Carney.
Display for Bullish / Bearish Retracement
Paparan untuk Bullish / Bearish Retracement
Display for Primary Retracement and Primary Projection
Paparan untuk Primary Retracement and Primary Projection
Display for Secondary Derived Extreme Retracement and Secondary Derived Extreme Projection
Paparan untuk Secondary Derived Extreme Retracement and Secondary Derived Extreme Projection

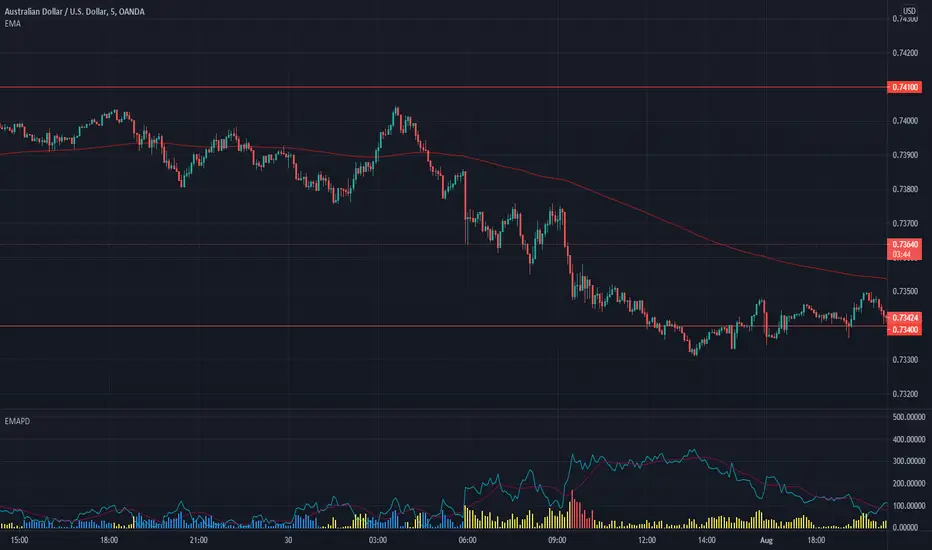
EMA Price DistanceEMA Price Distance, EMAPD for short, is a trend following indicator that can help you predict how price is going to move, in respect to your EMA. It can give overbought and oversold signals, as well as ranging market and retracement signals. The indicator consists of three parts, the Difference Line, the Average Line, and the Histograms.
- The blue line is the Difference Line. It is calculated from difference between the close price and the EMA. An increasing Difference Line indicates price moving further away from the EMA.
- The purple line is the Average Line. It is calculated based on the average of the difference Line for a certain lookback period.
- The Histograms are the difference between the Difference Line and the Average Line
Some basic signals:
- The easiest signal to spot is when the Difference Line is further away from the Average Line than normal. This usually signifies a retracement in the near future.
- Another signal is when the histograms are making smaller peaks or troughs, approaching 0. Signifies that price is retracing towards EMA. This can also be seen when the Difference Line is below the Average Line
How to Use:
The first use case is to detect when the market is ranging. This can be seen when both lines near 0 like so:
Another use case, is to use the indicator to signify how strong the current trend is / how likely it is to continue. This is signified by the Difference Line and Average line making higher highs
We can see that as the trend continues, both lines increase in harmony.
EMAPD can also be used to give easy to see signs of retracement or reversal.
Here we can see that the Difference line made a lower high as well as crossed below the Average Line. Whether this is a retracement or reversal usually depends on how the long the trend has occurred. The longer, the more likely of a trend reversal
One of the best use cases is to keep you out of bad trades. This usually happens right before a trend starts, when the market is choppier. This is when you usually get a lot of fake outs and false signals.
Here are 2 examples of where someone trading Supply and Demand would've been kept out of a losing trade.
In the first purple oval, a supply zone is formed. As price re enters the zone, it would be tempting to go long but the EMAPD is creating lower lowers on the histograms, signifying that price is moving closer to its average instead of expanding. We also get the Difference Line to cross under the average line, signifying price is moving closer to the EMA than it has been recently. These signals tell us that price has a good chance to "re group" with the EMA, which it ends up doing.
This also kept us out of the second trade, signified by the second purple oval. Here, we can see the difference line creating lower lows, signaling that price is moving closer to the EMA.
Support and ResistanceThis indicator shows three types of support and resistance lines: Horizontal, Parallel (using linear regression) and Fibonacci Retracement. Lines can be adjusted or turned on and off in settings. A great tool for setting up entries, exits and locating pivot points.

Martyv Auto Fib Retracement with Logarithmic SupportSimple & easy auto-fib levels. Took the out-of-the-box version provided by TradingView and added Logarithmic support and a nicer palette, and made the controls a bit nicer to use (in my opinion lol). Enjoy.

3 Auto Fibonacci RetracementsThe Indicator displays 3 different Auto Fibonacci Retracements with top, bottom, the 0.618 and 0.382 levels.
Also it displays 3 Moving Averages with the same length as the AutoFibos.
If the MA over the 0.618 level it colors itself yellow, if between 0.618 ans 0.382 white and under 0.382 blue.
The green lines are the top of the AutoFibos, red lines the bottom, blue lines are resistance/supports and yellow lines are stronger resistance/supports.

(IK) Base Break BuyThis strategy first calculates areas of support (bases), and then enters trades if that support is broken. The idea is to profit off of retracement. Dollar-cost-averaging safety orders are key here. This strategy takes into account a .1% commission, and tests are done with an initial capital of 100.00 USD. This only goes long.
The strategy is highly customizable. I've set the default values to suit ETH/USD 15m. If you're trading this on another ticker or timeframe, make sure to play around with the settings. There is an explanation of each input in the script comments. I found this to be profitable across most 'common sense' values for settings, but tweaking led to some pretty promising results. I leaned more towards high risk/high trade volume.
Always remember though: historical performance is no guarantee of future behavior . Keep settings within your personal risk tolerance, even if it promises better profit. Anyone can write a 100% profitable script if they assume price always eventually goes up.
Check the script comments for more details, but, briefly, you can customize:
-How many bases to keep track of at once
-How those bases are calculated
-What defines a 'base break'
-Order amounts
-Safety order count
-Stop loss
Here's the basic algorithm:
-Identify support.
--Have previous candles found bottoms in the same area of the current candle bottom?
--Is this support unique enough from other areas of support?
-Determine if support is broken.
--Has the price crossed under support quickly and with certainty?
-Enter trade with a percentage of initial capital.
-Execute safety orders if price continues to drop.
-Exit trade at profit target or stop loss.
Take profit is dynamic and calculated on order entry. The bigger the 'break', the higher your take profit percentage. This target percentage is based on average position size, so as safety orders are filled, and average position size comes down, the target profit becomes easier to reach.
Stop loss can be calculated one of two ways, either a static level based on initial entry, or a dynamic level based on average position size. If you use the latter (default), be aware, your real losses will be greater than your stated stop loss percentage . For example:
-stop loss = 15%, capital = 100.00, safety order threshold = 10%
-you buy $50 worth of shares at $1 - price average is $1
-you safety $25 worth of shares at $0.9 - price average is $0.966
-you safety $25 worth of shares at $0.8. - price average is $0.925
-you get stopped out at 0.925 * (1-.15) = $0.78625, and you're left with $78.62.
This is a realized loss of ~21.4% with a stop loss set to 15%. The larger your safety order threshold, the larger your real loss in comparison to your stop loss percentage, and vice versa.
Indicator plots show the calculated bases in white. The closest base below price is yellow. If that base is broken, it turns purple. Once a trade is entered, profit target is shown in silver and stop loss in red.

Example - MA-Cross Retracement DetectionThe retracement tracker function(s) in this script outline how to:
Track conditions using "toggle" booleans.
Use multiple coinciding conditions to trigger an event just once.
What is a retracement?
"Retracements are temporary price reversals that take place within a
larger trend. The key here is that these price reversals are temporary
and do not indicate a change in the larger trend."
Quote Source: www.investopedia.com

Gann RetracementThe indicator is based on W. D. Gann's method of retracement studies. Gann looked at stock retracement action in terms of Halves (1/2), Thirds (1/3, 2/3), Fifths (1/5, 2/5, 3/5, and 4/5) and more importantly the Eighths (1/8, 2/8, 3/8, 4/8, 5/8, 6/8, and 7/8). Needless to say, {2, 3, 5, 8} are the only Fibonacci numbers between 1 to 10. These ratios can easily be visualized in the form of division of a Circle as follows :
Divide the circle in 12 equal parts of 30 degree each to produce the Thirds :
30 x 4 = 120 is 1/3 of 360
30 x 8 = 240 is 2/3 of 360
The 30 degree retracement captures fundamental geometric shapes like a regular Triangle (120-240-360), a Square (90-180-270-360), and a regular Hexagon (60-120-180-240-300-360) inscribed inside of the circle.
Now, divide the circle in 10 equal parts of 36 degree each to produce the Fifths :
36 x 2 = 72 is 1/5 of 360
36 x 4 = 144 is 2/5 of 360
36 x 6 = 216 is 3/5 of 360
36 x 8 = 288 is 4/5 of 360
where, (72-144-216-288-360) is a regular Pentagon.
Finally, divide the circle in 8 equal parts of 45 degree each to produce the Eighths :
45 x 1 = 45 is 1/8 of 360
45 x 2 = 90 is 2/8 of 360
45 x 3 = 135 is 3/8 of 360
45 x 4 = 180 is 4/8 of 360
45 x 5 = 225 is 5/8 of 360
45 x 6 = 270 is 6/8 of 360
45 x 7 = 315 is 7/8 of 360
where, (45-90-135-180-225-270-315-360) is a regular Octagon.
How to Use this indicator ?
The indicator generates Gann retracement levels between any two significant price points, such as a high and a low.
Input :
Swing High (significant high price point, such as a top)
Swing Low (significant low price point, such as a bottom)
Degree (degree of retracement)
Output :
Gann retracement levels (color coded as follows) :
Swing High and Swing Low (BLUE)
50% retracement (ORANGE)
Retracements between Swing Low and 50% level (RED)
Retracements between 50% level and Swing High (LIME)

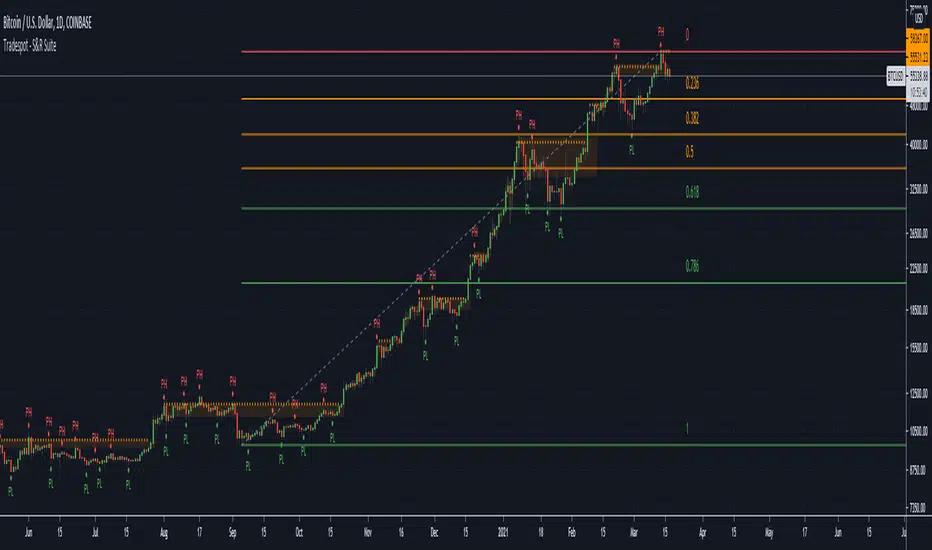
Tradespot - S&R SuiteTradespot - S&R Suite
No configuration needed, works out the box
Dynamically created S&R lines & zones based on ongoing price action
Dynamically created fibonnaci retracement lines to create your trading range
Completely open to building a core trading strategy upon
Want to know more or have questions? Come join the Tradespot community, or send me a message on TradingView.
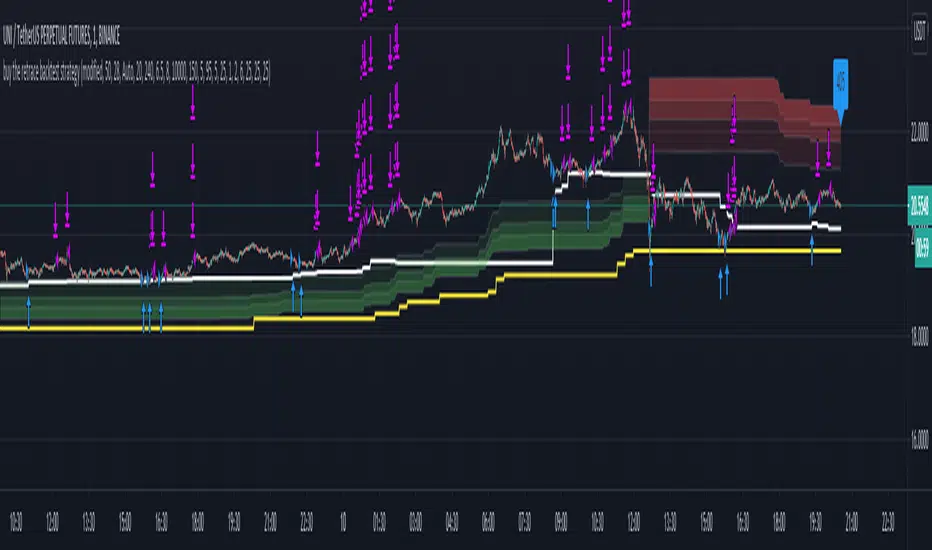
Buy The Retrace backtest strategyA trend-following strategy entering pullbacks
Simple but efficient
Mostly used it on 1 min chart but it works extremely well on 5 min as well.
The components of the strategy:
-MTF ATR based Trend
-Fib based cloud to help determine the trend - Caution when trend and cloud shows a different trend - a reversal may be possible.
-Optional values for the signals -how often you would like to get one- can be changed based on - the current close relative to the close-only high-low range over a given period of time.
-3x take profit levels
- all adjustable in %
- take profit quantities adjustable in % for each level
-paints a line where your average position is
-labels the current position size
Be careful where the cloud is broken, a reversal may happen.
Be careful longing / shorting the same levels which acted as a support/resistance before - this is why the win ratio is around 80% only as a small percentage gets stopped out usually.
Would like to get access? Pm me I'll grant it.
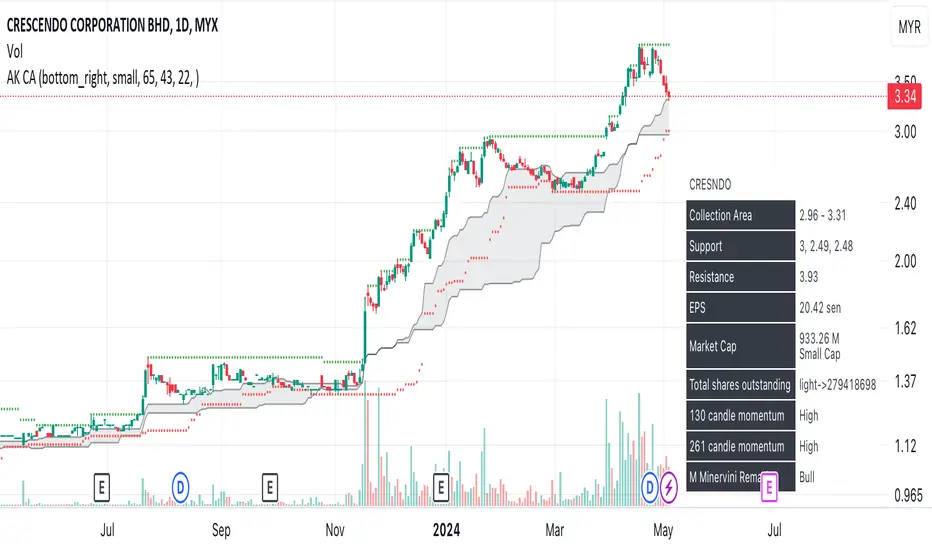
AK collection area- Based on Coach AK formula of determining collection area of retracement stock.
- If price below collection area, collect in tranches.
Trend Stability (Expo)
Trend Stability (Expo) is a multifunctional trend trading tool that identifies all aspects of trend trading. The indicator helps traders to stay on the right side of the market, identify retracements, reversals, and trend strength. In addition to that, we have added momentum - moves for traders that want to do trend scalping. The candle coloring displays the current trend and gives early signs of trend reversals and retracements.
➤ All in one trading tool that filters out noise and leaves us with insights that matter.
Real-Time with Alerts
No Repainting
Works on any market and in any timeframe
HOW TO USE
Use the indicator to gain insights into all aspects of trend trading:
Trend Stability/equilibrium
Trend Strength
Trend Retracements
Trend Reversals
Trend Filter
Momentum Moves
INDICATOR IN ACTION
4-hour chart
The setting used on the chart below displays negative momentum-moves with a noise-free positive trend.
I hope you find this indicator useful , and please comment or contact me if you like the script or have any questions/suggestions for future improvements. Thanks!
I will continually work on this indicator, so please share your experience and feedback as it will enable me to make even better improvements. Thanks to everyone that has already contacted me regarding my scripts. Your feedback is valuable for future developments!
-----------------
Disclaimer
Copyright by Zeiierman.
The information contained in my scripts/indicators/ideas does not constitute financial advice or a solicitation to buy or sell any securities of any type. I will not accept liability for any loss or damage, including without limitation any loss of profit, which may arise directly or indirectly from the use of or reliance on such information.
All investments involve risk, and the past performance of a security, industry, sector, market, financial product, trading strategy, or individual’s trading does not guarantee future results or returns. Investors are fully responsible for any investment decisions they make. Such decisions should be based solely on an evaluation of their financial circumstances, investment objectives, risk tolerance, and liquidity needs.
My scripts/indicators/strategies/ideas are only for educational purposes!
ACCESS THE INDICATOR
• Contact me on TradingView or use the links below

[JRL] MM FibonacciThis is a new indicator that uses Murrey Math formulas to find the tops and bottoms, then uses those tops and bottoms to draw long-term fibonacci retracement levels. The genius of Murrey was his geometric formulas to calculate the right place to start plotting the lines, but I think the fibonacci ratios typically seem more accurate than the MM line ratios. So in this script I attempt to take the best of each and combine them into a new, superior indicator.
Let me know in the comments if you find this useful. Cheers!

[JRL] Murrey Math LinesMurrey Math Lines are support and resistance lines based on geometric mathematical formulas developed by T.
H. Murrey. MM lines are a derivation of the observations of W.D. Gann. Murrey's geometry facilitate the use of Gann's theories in a somewhat easier application. According to Gann's theory, price tends to trend and retrace in 1/8th intervals. The most important MM line levels are the 0/8, 4/8 and 8/8 levels, which typically provide strong support and resistance points. The 3/8 and 5/8 levels represent the low and high of the typical trading range. When price is above the typical trading range, it is considered overbought, and when it is below it is considered oversold. The 2/8 and 6/8 levels provide strong pivot points.
Some of the other Murrey Math indicators on TradingView use different formulas and therefore produce varying results. I've checked my indicator against MM indicators on other platforms and it is consistent with those indicators.
This indicator also allows users to switch to alternative timeframes for analysis and it includes labels for the MM lines. If you have any suggestions or comments, please leave them below.
Cheers!

Magnetic Zones v1.1 BetaMagnetic Zones v1.1 Beta
This is one of the most powerful and effective indicator which I personally use for Intraday.
It works well for trending stocks and trending days.
What are the Zones?
The zones are basically Retracement and Reversal Zones. The price will take a halt at this zones. So it will be easy to take an entry.
How to use?
Labels:
Pivot = P
Major Zones = R1, R2, R3, S1, S2, S3
Minor Zones = R0.5, R1.5, R2.5, S0.5, S1.5, S2.5
Previous Day High & Low = PDH, PDL
Breakout:
Opens between Previous Day High or Low and R1 or S1 Zone and taking retracement at the zone can result in a breakout.
Entry Time:
No Entry: 0 to 15min. Wait for the early Algo rush to settle down. Just go through the shortlisted stocks or top gainers and top losers.
Risky Entry: 15min to 30min. It is the right or early time to participate in the beginning of a rally. But, recommended only for experienced, disciplined and planned traders.
Moderate Risk: 30min to 45min
Safe Entry: After 45min to 1hr
Stock Selection Tip:
Use Expanded Floor Pivots to spot Narrow Range stocks.
Entry Tip:
Use Opening Range Breakout (15, 30, 45 or 1hr) to spot false shoot ups.
Entry:
After the retracement on or closer to the zones.
If the retracement happens in between spaces of the zones expect next retracement at the next in between space. Imagine the levels accordingly.
Retracement is the right time to make an entry with minimum stoploss.
Stoploss:
Just below the longest candle which touches the zone.
Target:
If it is a trending stock the price will move easily from one major zone to another major zone.
If the zones are wider on a particular day use the minor zones as target.
Consider the historical support and resistance, highs and lows to confirm the entry or exit.
Indicator Features:
Inclusion of 2nd and 3rd zones: Helpful to identify the target zone and to participation in a major rally.
Clean and cluster free look
Shows only required zones
Hide historical levels
Previous day High and Low levels
Multi time-frame
Caution:
Don't solely depend on this indicator. Always use this with other analyzing tools or methods for more confirmation.
Acknowledgement:
Thanking the original formulators.
Note:
The indicator is under testing. Any errors, updates and additions will be updated in the final version.
Even though there many are other indicators similar to this in TradingView, this indicator is customized for precision, inclusion of extended levels and designed for a squeeze free chart and visual appeal.
Explore, improvise and formulate new methods with your personal experience and ideas.

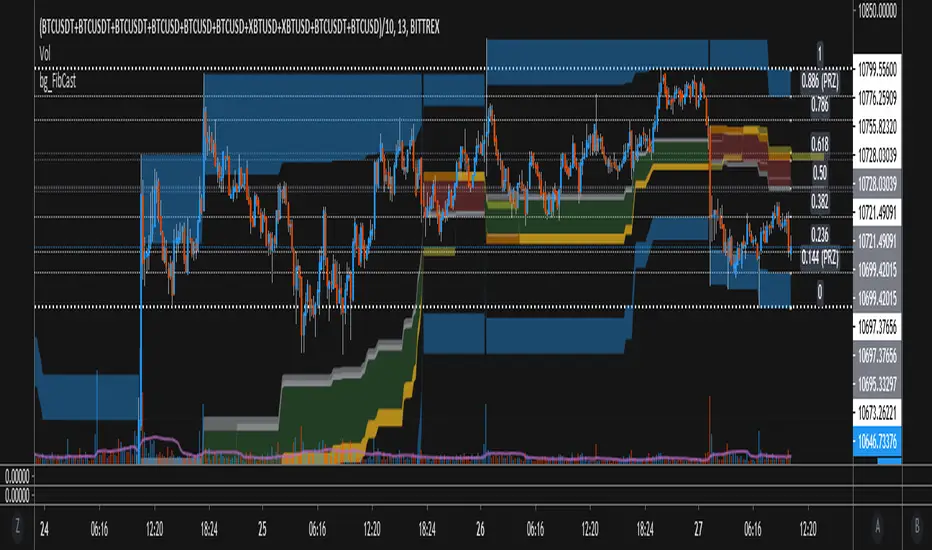
bgeraghty_FibCastThis script draws a High-To-Low or Low-To-High Fibonacci Retrace over the chart, based on which of those two happens in the given time period (Default is 144 Candles).
Updates from older versions:
- Paints 0.5, 0.618, 0.65 and spaces in between, giving good hindsight to the trend, and ideas of where strong support/resistance may lie.
- Silver Paint Strip = 0.50 retrace, Gold = 0.618-0.65, and the Red/Green between indicates the direction of the (Fib) Trend as H->L or L->H
- Paints 0.144 and 0.886 ranges Blue, and these are typically extremes or possible reversal zones. (PRZ)
Fast ROI checker 50% Gann RetracementThis script is based on the Gann's 50% Retracement rule.
First, the ATH (All Time High) and ATL (All Time Low) are calculated; then, the 50% retracement level is found.
With this 50% level, we'll calculate the maximum price entry to keep a ROI which is set in the parameters.
For exemple, I only want to buy assets which can make a x16 before the 50% retracement , the script will calculate the maximum entry to respect this ROI .
If the Max entry price is above the ATL , the line will be green; if not, the line will be red.
To faster the search in the watchlist, when the price is between the Max Entry line and the ATL line, the background is painted in green.
It's not an investment strategy, you have to find your proper indicators to make purchases.
Enjoy !

Automatic Fibonacci Retracements [MS]Automatic Fibonacci Retracement Level indicator for any time frame, any asset.
Simple to use, just add to your chart and set the size of retracements you want to see.
Fib levels keep drawing in real time until the next low or high is found to start drawing the next fib.
Settings Include
• Fib size
• Show prices
• Draw low-to-high or high-to-low
• Toggle fib levels
Use the link below or PM us to obtain access to this indicator.

NCTA Adaptive Entry SystemAdaptive Entry System (AES)
Price action of stocks, indexes, and futures consists of periods of trending action, retracements within the trend and then a resumption of the original trend. Trending patterns do not move straight up or straight down. They move in cycles which, when properly identified, can offer traders an opportunity to “follow the trend” while also recognizing the probability of a near term retracement before resuming movement in the direction of the trend. Experienced traders with advanced skills at interpreting wave patterns (Elliott Wave), Fibonacci retracements, Stochastics (overbought / oversold conditions), Momentum, and Moving Averages apply their advanced knowledge to trading and identifying these trend - retracement - continuation of trend cycles. These skills require an advanced knowledge of these complex indicators and can be difficult for traders without the same skill set to optimize their trading performance.
The Adaptive Entry System (AES) was created as a technical market metrics system to interpret a variety of advanced signals and present to the trader a “single actionable signal” displayed in an easy to recognize format for traders of most any skill level to benefit from.
AES is a “system” as opposed to a single indicator. It was designed with the goal of simplifying a traders ability to recognize an entry opportunity by summarizing the consensus of several key indicators and displaying a single entry / exit signal in a color highlighted, strategy labeled format. The work of comparing a variety of indicators and assessing the strength of alignment is performed for the trader by the Adaptive Entry System.
There are three possible entry signals displayed. A trader may trade all three or customize the settings to choose just a single signal to trade. It is important for any trader incorporating AES into their toolset that they trade in sim / virtual mode for a period of time to confirm they understand how price action responds to the signals and to personally track the performance of each. A good trading system still requires due diligence on the part of the trader to confirm understanding of how the system performs.
Entry Signal #1 Description:
Trend Bias Plus Signal is intended to provide traders with an early view of the probable directional bias of the stock, index, or futures being traded. Trend Bias was designed to recognize the probability of the early stages of the strongest segment of a wave pattern. Recognizing the probable bias of the trend at an early stage and also having an indication of when that trend may be ending offers traders an opportunity to enhance their ability to optimally benefit from the trend.
How to Read the Trend Bias Plus Signal:
The Trend Bias Plus Signal is displayed as a simple to recognize color coding of the price bars. Blue price bars indicate a probable rising price bias. Red price bars indicate a probable declining price bias. White bars indicate a neutral period with no clear directional bias.
How to Trade the Trend Bias Plus Signal:
The Trend Bias Plus Signal is simple to interpret. When a price bar closes blue and the next price bar opens blue, this signals to the trader to open an upward bias position. Buy-to-open a call option, buy the stock, or open a long futures position. When a price bar closes red and the next price bar opens red, this signals to the trader to open a downward bias position. Buy-to-open a put option, short the stock or close a long stock position, or open a short futures position.
When holding a short or long position based on the Trend Bias Plus, there are a variety of exit methods which a trader can use including stops, limit price orders with fixed profit targets, or trail stops. Regardless, the end of a Trend Bias Plus cycle is indicated when a new price bar opens white. This is evidence that the current rising or declining trend is shifting to a neutral state. A trend may also be viewed as having ended when an opposite color bar prints at the open of a new price bar.
Entry Signal #2 Description:
The Momentum Signal is a near term indication of a probable retracement of the current trend. It identifies a temporary reversal of an overarching trend in a stock's price. Retracements are short-term periods of movement against a trend, followed by a return to the previous trend. Momentum signals are usually counter-trend trades identifying that part of the wave sequence where price temporarily moves opposite the direction of the trend. The momentum signal can be an opportunity for traders to take advantage of the natural pattern of trend - retracements - continuation.
How to Read the Momentum Signal:
The Momentum signal is displayed as a vertical color highlight on the price bar with a “M” label inside a directional indicator box. A red vertical highlight with an arrow box and “M” label pointing lower is a signal that the near term price movement may be downward bias. For an upward bias price movement signal, the Momentum indicator will display a green highlight across the price bar with an arrow box and “M” label pointing higher.
How to Trade the Momentum Signal:
When the highlighted directional labeled box prints at the open of a new price bar, take the trade based on the directional bias displayed. Momentum signals are generally counter trend indicators so a downward bias red bar, prompting the trader to go short may print on a long bias blue Trend Bias Plus price bar. This should not be viewed as a conflict but instead as a probable indication of a short term retracement following the natural sequence of cycles in price movement.
Momentum signals may be traded using stocks, options, or futures.
Entry Signal #3 Description:
The Consensus Signal is an indication that price action may be resuming in the direction of the primary trend.
How to Read the Consensus Signal:
The Consensus Signal is displayed as a vertical color highlight on the price bar with a “C” label inside a directional indicator box. A red vertical highlight and an arrow box with a “C” label pointing lower is a signal that the price movement may be resuming a downward bias trend or strengthening a conviction to the current trend. For an upward bias price movement signal, the Consensus indicator will display a green highlight across the price bar and an arrow box with a “C” label pointing higher. This is a signal that the retracement off of the trend may be concluding and/or a strengthening of a conviction to the current trend.
How to Trade the Consensus Signal:
When the highlighted directional labeled box prints at the open of a new price bar, take the trade based on the directional bias displayed. Consensus signals are generally most productive when traded aligned with the trend, as displayed by the Trend Bias Plus price bar color or when a white bar indicates a neutral state of the price trend. Counter trend trades using the Consensus Signal are not advised and considered to be less productive / higher risk.
Consensus signals may be traded using stocks, options, or futures.
Some General Rules:
Trade signals are only considered valid when they display at the open of a new price bar.
The signals can be traded on different timeframe charts from short term 3 minute charts to longer timeframe daily charts.
The signals are designed to be a generic indication of probable price movement and as such, can be used effectively for trading futures, stocks, options on stocks, options on ETFs, and options on cash settled indexes.
AES offers traders an opportunity to optimize performance from the natural cycles of the market….trend - retracement - continuation.
AES offers an opportunity for traders to have a clear entry / exit criteria. However, it is still imperative that each trader understands the trading strategy they intend to use and the risks and opportunities associated with that strategy. It is highly advised, regardless of the system or strategies being used, that a trader validates their understanding of the system/strategy by trading in a simulated, paper account format to self test the system and personal ability to trade it successfully.
Next Bar Alert:
Included is an optional "Next Bar Alert" setting. Since many of these signals benefit from very prompt action at the beginning of a price bar, there is an additional option in Settings to set an arbitrary number of seconds to be alerted before the next price bar opens. Simply set this to a level you prefer, then set an alert in TradingView on the indicator using the "Next Bar Alert" alert parameter.
Summary:
The color highlight indicator allows the trader to be 100% certain that the rules/criteria for confirming a valid entry were met at the open of the price bar. This feature, along with the alert settings in Trading View, provide clear confirmation of the timing and print of the signal as either valid or not.
Adaptive Entry System has been designed to help traders of all skill levels to trade the natural sequence of patterns in price action using a simple to recognize, single signal entry/exit format. The natural cycle of trend (Trend Bias Plus), then retracement (Momentum), followed by a continuation of the original trend (Consensus) can be identified within this system and offers traders a simple signal to take advantage of each phase in the cycle. Stock investors, options traders, and futures traders can benefit from the simple design of the AES on a variety of time frames.
Trend Bias Plus signals on NASDAQ:TSLA Daily chart:
Trend Bias Plus signals on NASDAQ:AMZN Daily chart:
