ICT FVG indicator [Focused Trader]This is simple fair value gap indicator. It draws FVG (fair value gaps) as boxes. If FVG is partially filled, it is also displayed and smaller size FVG is drawn. If FVG is filled totally, it is deleted from chart. There is limitation of 500 drawing objects for indicators on Tradingview, so keep in mind that this indicator will display only last 500 FVGs.
For simplicity, there is only one setting, which is coloring of FVGs. It is perhaps a good idea to lower your opacity (to about 10%) and choose color of FVG according to your preferences and current theme (dark or white).
在腳本中搜尋"fvg"

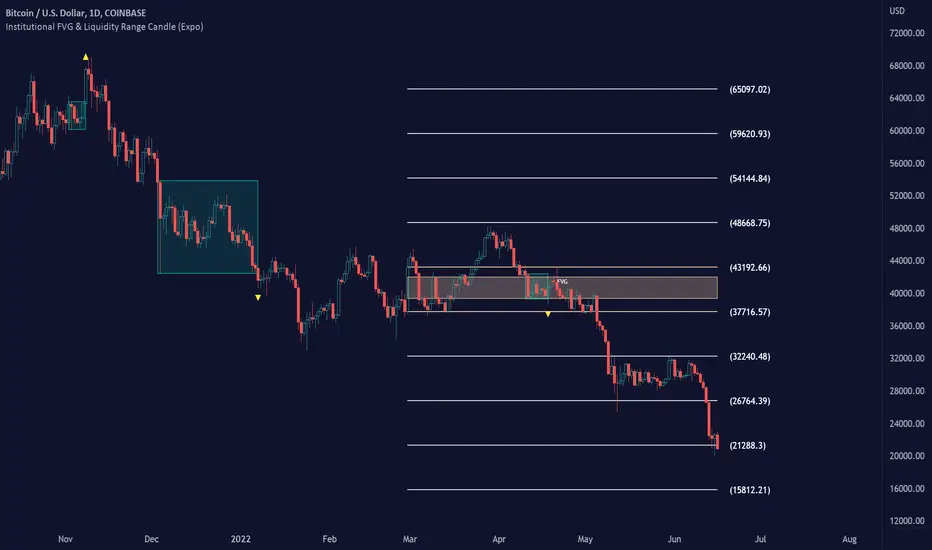
Institutional FVG & Liquidity Range Candle (Expo)█ Institutional FVG with predicted SR levels & Liquidity Range Candle is an indicator that uses Smart Money Concepts to give you the insights needed to make informed decisions based on the theory in SMC. This premium toolkit work in any market and timeframe.
█ Institutional Fair Value Gap , also known as imbalance, inefficiencies, and Liquidity void, identifies the most significant FVG within the lookback period. This is often referred to as Institutional Fair Value Gap since only big players can cause these liquidity voids.
Fair Value Gap, Liquidity voids are sudden price changes without enough liquidity at a stable price, and the price jumps from the originating price level to the final price level, creating an imbalance in price.
The price tends to fill or retest the FVG area, and traders understand at which price level institutional players have been active. FVG is a valuable concept in trading, as they provide insights about where many orders were injected, creating this inefficiency in the market. The price tends to restore the balance.
This indicator highlights the most significant Fair Value Gap on the chart and plots predicted future support and resistance levels based on the price action created at the FVG. A super simple and yet effective way to get solid market levels that acts as a magnet for the price.
█ Liquidity Range Candle is another trading concept used by large market players where they manipulate the price to stay inside a specific market area, creating a tight consolidation zone. Once the price breaks the liquidity range, liquidity flows into the market. It's an easy way to grab liquidity from retail traders. Stop losses are triggers, breakout traders jump into the market, and institutional traders absorb the liquidity.
If you don't see the liquidity, you become the liquidity!
A break of a liquidity range is a sign of a breakout, potential continuation, retracement, or reversal. Use it together with an overall market analysis. It's common that traders also mark the previous 1-3 liquidity ranges and plot them into the future. These zones can act as a future magnet for the price, and we can get a retest of the zones, or if we break above/below a previous range can be a sign of a trend change. We also know that these liquidity ranges have been important levels for institutional players, who may be willing to accumulate or distribute more orders at these levels.
█ HOW TO USE
Use the indicator to identify several important and commonly used trading concepts taught within the SMC.
Find Significant FVG
Find Significant liquidity ranges
-----------------
Disclaimer
Copyright by Zeiierman.
The information contained in my Scripts/Indicators/Ideas/Algos/Systems does not constitute financial advice or a solicitation to buy or sell any securities of any type. I will not accept liability for any loss or damage, including without limitation any loss of profit, which may arise directly or indirectly from the use of or reliance on such information.
All investments involve risk, and the past performance of a security, industry, sector, market, financial product, trading strategy, backtest, or individual’s trading does not guarantee future results or returns. Investors are fully responsible for any investment decisions they make. Such decisions should be based solely on an evaluation of their financial circumstances, investment objectives, risk tolerance, and liquidity needs.
My Scripts/Indicators/Ideas/Algos/Systems are only for educational purposes!
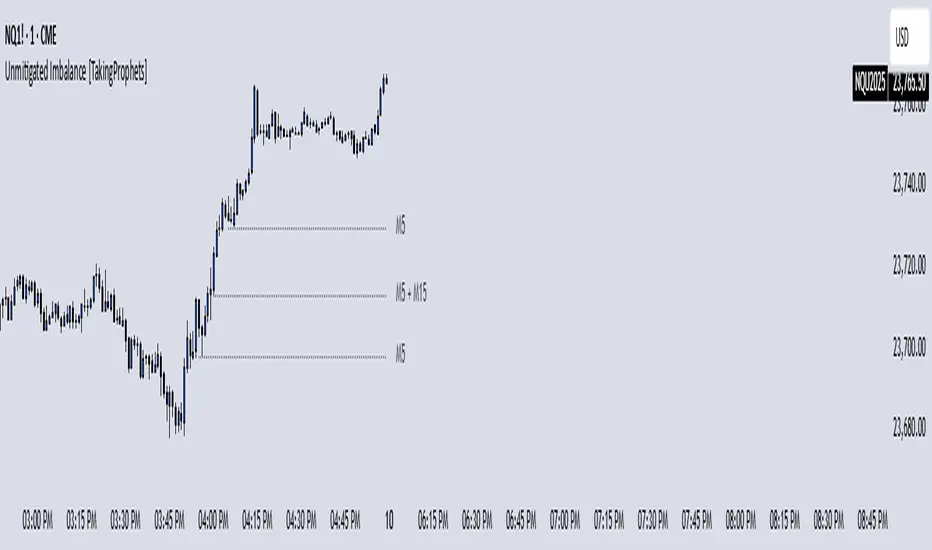
Unmitigated Imbalances [TakingProphets] (High Timeframe)Unmitigated Imbalances
Unmitigated Imbalance is designed to automatically detect and display active Fair Value Gaps (FVGs) across multiple higher timeframes and your current chart. It only keeps the ones that remain unmitigated, helping you clearly see where price has “unfinished business” and potential liquidity draw areas. The tool extends these levels forward until they are tagged according to your chosen mitigation criteria, then removes them automatically.
The indicator uses the classic 3-bar FVG structure:
– Bearish FVG forms when the low of the third candle back is above the high of the first candle.
– Bullish FVG forms when the high of the third candle back is below the low of the first candle.
– Each detected gap must meet a minimum size threshold, which is determined automatically from the Sensitivity setting and adjusted for the symbol type.
Higher timeframes (up to 4) can be plotted simultaneously with your current chart’s gaps. The script merges overlapping levels from different timeframes into one clean label, showing all the contributing timeframes together (for example: M15 + H1 + H4). This makes it easy to spot high-confluence levels without cluttering your chart.
Key features
– Multi-timeframe detection: up to 4 custom HTFs plus your current chart.
– Automatic gap size filtering based on chosen Sensitivity (High, Medium, Low).
– Choice of Wick or Close-based mitigation logic.
– Lookback control: 1 Day, 1 Week, 1 Month, or Max.
– Combined labels for overlapping gaps with clear timeframe tags.
– Separate color and style settings for each timeframe’s bullish and bearish gaps.
– Labels can be positioned Left, Right, or Center Above for maximum clarity.
– Automatic line extension until mitigation or until they exceed the lookback period.
How to use
Select your desired higher timeframes in the HTF1–HTF4 settings.
Choose the Sensitivity level to control the minimum gap size detected.
Decide on Wick or Close mitigation according to your trading rules.
Use the Lookback setting to limit how far back the script checks for gaps.
Watch for levels where multiple timeframe labels are stacked — these can carry greater significance.
Incorporate the levels into your existing strategy, using them as context rather than entry signals.
Practical notes
– Current timeframe gaps reset each trading day to keep the chart relevant to intraday bias.
– Higher timeframe gaps remain until mitigated or until the lookback period expires.
– Large lookback periods with multiple HTFs can increase chart load — adjust settings as needed.
– This indicator is a mapping and context tool, not a signal generator. Always apply it alongside your own analysis.
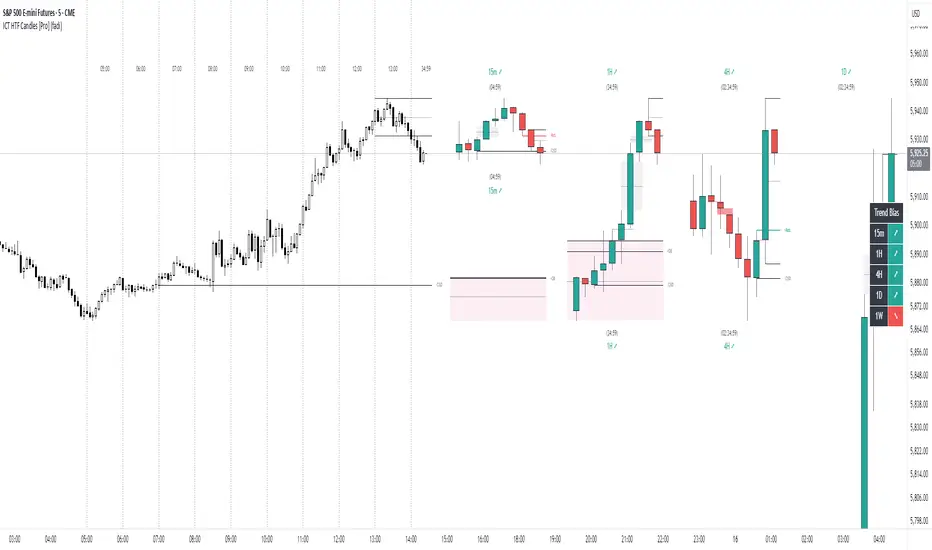
ICT HTF Candles [Pro] (fadi)The ICT HTF Candles shows you multi-timeframe price action by plotting up to six higher timeframe candles on your chart, scaled to real price levels. Set candle counts per timeframe or toggle them off for a clean view, saving you time switching between charts. This helps you spot trends and reversals quickly, align trades with the market’s direction, and time setups like sweeps or bounces better. From scalping on the 1m to swinging on the 4H, it simplifies ICT and Smart Money Concepts (SMC), revealing trend shifts and institutional moves clearly. Once you use it, trading without this clarity just won’t feel right.
Key Features:
In-Depth Price Action Levels
These levels track ICT PD arrays and confluences across timeframes, making it easy to see how price action flows from higher timeframes and what your setup faces. Is your 5m trade about to run into a 1H bearish order block? Did it bounce off a higher timeframe FVG and create an SMT with a correlated asset? They make your chart a clear roadmap to market structure, helping you find strong setups, save time, and align with institutional moves:
Change in State of Delivery (CISD): In ICT trading, CISD marks potential reversal levels on each timeframe by showing the open of the highest series of up (green) candles for a bullish shift or the open of the lowest series of down (red) candles for a bearish shift. These levels are set at the opening price of the first candle in those runs, highlighting where the market turns. The indicator makes these levels easy to spot across timeframes, so you can track reversal points clearly. You can set your own confirmation criteria—a close or wick above/below the CISD line (bearish/bullish) or a close or wick above/below the high/low—to verify the CISD level cross. When confirmed, there is a high probability that we have a change in trend, and a reversal order block forms. CISD helps you track these reversal levels and confirm market shifts, making multi-timeframe analysis straightforward.
Order Blocks: When a CISD level cross is confirmed, the price is now below a series of up (green) candles or above a series of down (red) candles, marking these candles as order blocks that usually support the new trend direction. The indicator shows these levels clearly across timeframes, making it easy to spot high-probability reversal or consolidation areas. Keep in mind that price may sometimes move to mitigate an imbalance, so use your best judgment based on your multi-timeframe analysis to confirm they meet your trading criteria.
Trend Bias: Traders often struggle figuring out market bias—guessing the trend wrong, losing on trades against the flow, or missing how lower and higher timeframes line up. The Trend Bias feature tracks order blocks and change in state of delivery, displaying bullish or bearish trends for each timeframe to help you choose trades that go with the market’s direction. The indicator shows these trends clearly across timeframes, so you can quickly see if the 5m matches the 1H or if you’re going against the bigger trend. This makes it easier to avoid bad trades and make decisions faster, keeping you on track with setups that follow the main trend.
Immediate Rebalance: When looking at price action, you’ll see the market doesn’t usually leave behind many Fair Value Gaps (FVGs). That’s because the market is efficient and always rebalancing any inefficiencies. When the market starts a strong move, the last candle will usually close above the previous candle high (for up moves) or below the low (for down moves). At this point, the market will do one of two things: immediately rebalance by retracing first, or have a small retracement but leave behind an FVG. The Immediate Rebalance feature tracks rebalance levels across multiple timeframes, clearly showing where price rebalances. This helps traders have a better expectation of how the market may need to retrace and anticipate Power of Three (PO3) setups by being ready for a Judas swing to rebalance the imbalance.
Fair Value Gaps and Volume Imbalances: If the market fails to immediately rebalance, it will usually attempt to come back and rebalance it at a later time. FVGs and VIs give you a clear area where the price might be heading if it starts breaking structure on lower timeframes. These inefficiencies—price gaps (FVGs) or aggressive moves (VIs)—show where the market’s working to fix imbalances. The Fair Value Gaps and Volume Imbalances feature tracks these levels across timeframes.
Previous Candle Levels: The Previous Candle Levels feature marks the high, low, and middle of the prior candle on each timeframe, helping you identify key price levels for sweeps, bounces, or breakouts. It tracks the candle’s high and low as its extremes and the middle as the 50% mark, which you can set to calculate using the high-to-low range or the open-to-close range. These levels can provide tradable setups on lower timeframes.
Smart Money Techniques (SMT): What’s an ICT indicator without an SMT feature to track cracks in correlated assets? The ICT HTF Candles monitors your chosen correlated assets, like EUR/USD and GBP/USD or SQ and NQ, for signs of strength or weakness to use as confluence with other features and build the case for A+ setups. The SMT feature spots divergences when one asset makes a higher high or lower low while the other doesn’t follow, hinting at potential reversals or market shifts. It tests SMT using two immediate candles, since higher timeframes (HTFs) create larger gaps on lower timeframes. Traders can easily see these divergence levels, like a 15m SMT lining up with a 1H order block or CISD, helping you confirm high-probability setups and strengthen trade entries with multi-timeframe confluence.
Smarter Money Concepts - MTF IFVGs [PhenLabs]📊 Smarter Money Concepts - MTF IFVG
Version: PineScript™ v6
📌 Description
This multi-timeframe indicator identifies Inverse Fair Value Gaps (IFVGs) and their inversions across simultaneous chart intervals, helping traders spot liquidity voids and potential reversal zones. By analyzing price action through the lens of institutional order flow patterns, it solves the problem of manual gap tracking across timeframes while incorporating volatility-adjusted parameters and psychological level analysis for higher-probability setups.
🚀 Points of Innovation
• Multi-Timeframe Engine - Simultaneous analysis of 3 higher timeframes
• Adaptive Parameters - Auto-adjusts to market volatility conditions
• Quality Scoring System - Ranks gaps using RVI strength and size metrics
• Inversion Tracking - Monitors failed gaps for counter-trend signals
• Render Optimization - Prevents chart clutter with smart gap management
🔧 Core Components
FVG Detection Logic: Identifies gaps using customizable price source (Close/Wick)
Inversion Tracker: Manages failed gaps and generates counter signals
Multi-Timeframe Engine: Processes 3 independent higher timeframe analyses
Dashboard System: Real-time display of active gaps across all timeframes
🔥 Key Features
• Volatility-adjusted gap size filters (ATR-based)
• Customizable timeframe confluence analysis
• Color-coded quality scoring
• Non-repainting inversion signals
• Mobile-optimized visual rendering
🎨 Visualization
• Colored Boxes: Translucent zones show active gaps (green/bullish, red/bearish)
• Midline Plot: Dashed gray line marks gap midpoint for price targets
• Inversion Markers: Intense colors show failed gaps (dark red/bullish failure, bright green/bearish failure)
• HTF Differentiation: Higher timeframe gaps shown in blue/teal hues
📖 Usage Guidelines
Multi-Timeframe Settings
• Higher Timeframe 1
Default: 30 | Range: Any > Chart TF | Controls primary confluence timeframe
• Show All Timeframes
Default: True | Toggles multi-TF gap displays
Gap Settings
• Source
Default: Close | Options: | Determines gap measurement method
• RVI Period
Default: 14 | Range: 1-50 | Sets momentum confirmation sensitivity
• RVI Value
Default 0.1 | 0 to see all IFVGs | Increase min RVI to see the most powerful IFVGs
✅ Best Use Cases
• Identifying confluence across timeframes
• Spotting institutional order blocks
• High-probability reversal trading
• Trend continuation confirmation
• Volatility breakout setups
⚠️ Limitations
• Repaints historical gap zones
• Requires understanding of FVG concepts
• Higher timeframe data latency
• Quality scores rely on RVI/ATR settings
💡 What Makes This Unique
First FVG indicator with true multi-timeframe processing
Adaptive parameters that auto-adjust to volatility
Quantifiable quality scoring system
Professional-grade dashboard with HTF tracking
🔬 How It Works
Gap Detection: Identifies FVGs using price relationships and RVI confirmation
Inversion Tracking: Monitors price breaches to flag failed gaps
Quality Assessment: Scores gaps based on size, momentum, and location
Adaptive Filtering: Adjusts parameters using ATR-based volatility analysis
Multi-TF Synthesis: Correlates gaps across user-selected timeframes
Visual Rendering: Displays only relevant, active gaps to prevent clutter
💡 Note:
Start with default settings and gradually adjust parameters after observing market interactions. Focus on gaps with quality scores above 7 that align with higher timeframe trends. Combine with price action at psychological levels for highest-probability setups. Remember that higher timeframe gaps generally carry more significance than current chart gaps.

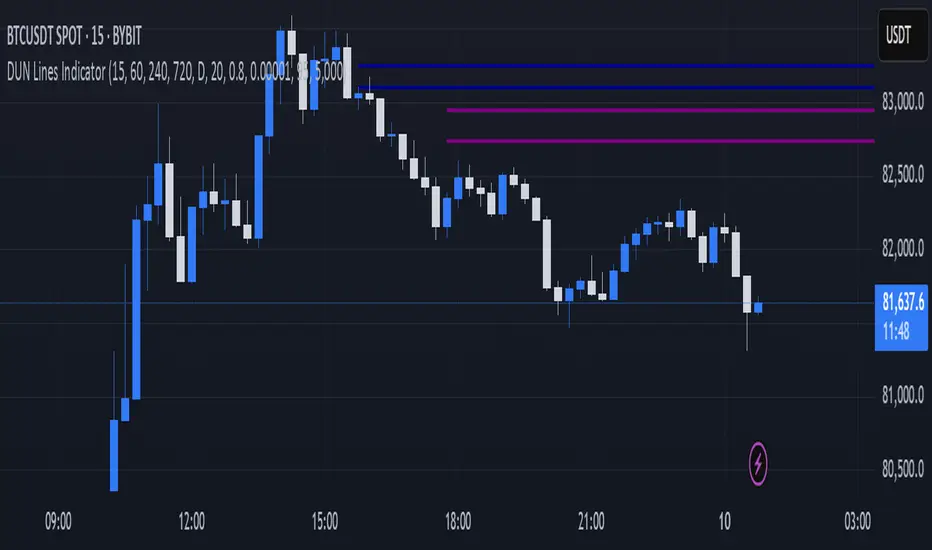
DUN Lines IndicatorThe DUN Lines indicator detects, filters and plots price imbalances (aka fair value gaps or fvgs/ifvgs). It is unique in the fact that it uses five timeframes and filters out overlapping, lower timeframe imbalances and fvgs below a user-definable size threshold.
Simply set your detection timeframes, colors and thresholds then set your chart to your preferred entry timeframe. When imbalances are mitigated, the FVG/IFVG is removed from the chart.
The indicator's default colors are my preferred ones for differentiating between timeframes, but these are easily changed. A single color with various levels of transparency to indicate timeframe strength is another approach that works nicely.
Nirmal Fair Value GapsICT Fair Value Gaps
Trade Wisely
How a Fair Value Gap Works
Formation:
A Fair Value Gap occurs when a strong price movement (usually from institutional orders) creates an imbalance between buyers and sellers.
This is typically seen in a three-candle pattern, where the middle candle has a large body, and the two surrounding candles have wicks but little overlap with the middle candle’s range.
Identification:
The FVG is marked between the high of the first candle and the low of the third candle (for bullish gaps).
For bearish gaps, it’s the low of the first candle and the high of the third candle.
Market Behavior Around FVG:
Price often retraces into the gap before resuming its original direction.
This happens because the market seeks to "fill" the imbalance where few trades occurred.
Traders use FVGs as potential entry zones for trend continuation trades.
Trading Fair Value Gaps
In an Uptrend:
Look for bullish fair value gaps as potential support zones for buy entries.
Price may dip into the gap and then continue upward.
In a Downtrend:
Look for bearish fair value gaps as potential resistance zones for sell entries.
Price may retrace into the gap and then drop further.
Confluence Factors:
FVGs work best when combined with other strategies like order blocks, liquidity zones, or key Fibonacci levels.

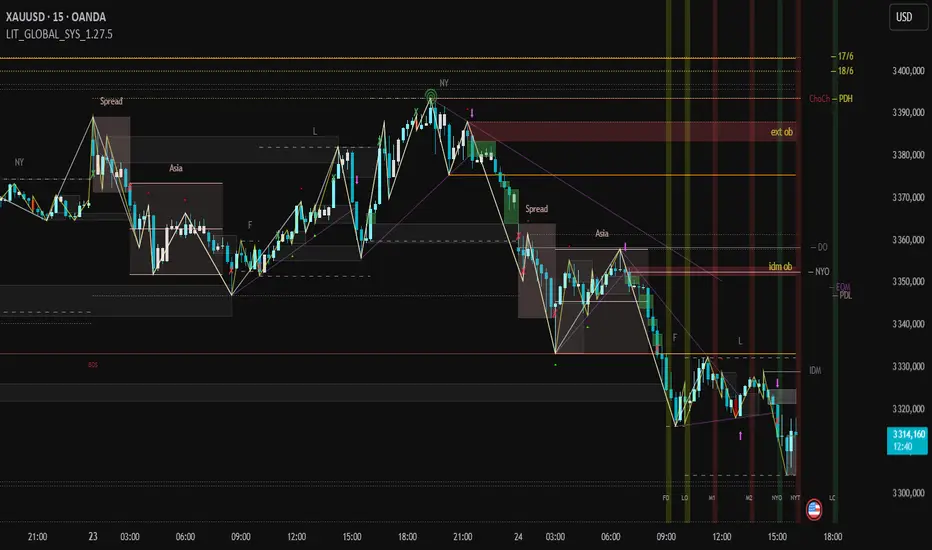
LIT_Globas_sys - Liquidity Inducement Theorem (SMC, IDM)LIT_GLOBAL_SYS Trading Tool Documentation, is a comprehensive market analysis tool that includes all components needed for trading according to Liquidity Inducement Theorem (LIT). LIT differs from classical trading methods and is considered a highly effective and profitable strategy.
What can LIT_GLOBAL_SYS do?
--- Market Structure
The main feature of Liquidity Inducement Theorem is building the correct structure, specifically construction taking into account inducement (IDM). Thus, a new HH or LL can only form when the price has taken the first correct pullback - inducement (IDM), and after this, we understand the location of BoS (break of structure) and CHoCH (change of character).
LIT_GLOBAL_SYS automatically and perfectly displays the correct structure following all LIT rules. Looking at the indicator, a trader always understands which range the price is currently in and where it's trending at the moment. The indicator also shows dynamic (live) levels, providing a clear understanding of the market structure in real-time.
The indicator settings allow customization of each structural element according to trader preferences. For example, you can change the style, color, and shape of structural objects.
--- Correct Pullbacks and Inside Bars
In Liquidity Inducement Theorem, correct pullbacks are fundamental. The structure, order blocks, liquidity levels, order flow, and single candle order blocks (CSOB) are all built based on pullbacks.
What is a pullback?
- When the next candle updates the low of the previous candle, we can finish drawing an upward pullback
- We can start drawing a downward correct pullback when the next candle updates the low of the previous candle
- The downward movement will continue until the opposite occurs - updating the high of the previous candle
There are complexities in determining pullbacks - these are inside bars. In Liquidity Inducement Theorem, inside bars are completely ignored!
For example, in an upward movement, at some point, candles may stop updating the high and low of the previous candle and remain within the boundaries of the previous candle. Theoretically, there could be any number of such candles from 1 to infinity. In such cases, it's important to wait for the price to exit the mother candle (the candle after which other candles remained within its high and low range).
LIT_GLOBAL_SYS easily handles this and displays both pullbacks and inside bars correctly.
--- Order Blocks and Fair Value Gaps (FVG)
In Liquidity Inducement Theorem, order blocks are defined differently from classical order blocks:
1. The order block must take liquidity from the previous candle
2. The order block must have Fair Value Gaps (FVG) before it
3. Inside bars are completely ignored for both Order Blocks and FVG
4. If an OB fulfills the first condition (taking liquidity from the previous candle) but doesn't have FVG before it, this block is moved forward along the candles until there is an imbalance before it
There are two most important order blocks in LIT strategy:
1. Inducement order block (idm ob) - the first order block after Inducement
2. Extreme order block (Ext ob) - the first order block before CHoCH
LIT_GLOBAL_SYS perfectly displays correct order blocks and Fair Value Gaps following all rules. It offers full customization options:
- Specify the number of displayed OBs
- Disable all order blocks except idm ob and Ext ob
- Change block frame color and style
- Disable or modify text display in blocks
--- Single Candle Order Block (Scob)
Rules for building Scob:
1. The candle takes liquidity from the previous candle and closes within the body of the previous candle
2. The candle following the Scob candle must close its body below the previous candle
3. Scob forms in continuation of the trend movement
4. Scob completely ignores inside bars
LIT_GLOBAL_SYS accurately displays Scob as triangles and fully ignores inside bars both left and right. The menu allows complete customization of display and quantity of displayed Scobs.
--- Liquidity Lines, Order Flow, and Three-Minute Rule
Auxiliary functions include:
- Liquidity Lines -
Each pullback is marked with a line, showing where unclosed liquidity exists. Completed lines can be hidden to help predict price movement and enter trades correctly.
- Order Flow -
The indicator implements order flow by drawing a line when a pullback is broken (closed by body) in the opposite direction until the second touch. If price moves away without a second touch, the line remains, showing unclosed OF and potential price return zones.
- Three-Minute Rule -
Some LIT traders use the three-minute rule: price manipulations in the last and first three minutes of each 15-minute candle are additional entry factors, especially in the last quarter of an hourly candle. LIT_GLOBAL_SYS displays this rule only on the one-minute timeframe with symbols below for M15 and H1.
--- Trading Sessions, PDH/PDL, and EMA
The system includes:
- Trading sessions (Tokyo, Frankfurt, London, New York) with customizable time settings
- Previous Day High and Previous Day Low (pdh/pdl) levels
- Exponential Moving Average (EMA) with adjustable length
- Equilibrium display between current BoS and CHoCH levels
--- Alert System
LIT_GLOBAL_SYS includes all necessary alerts for Liquidity Inducement Theorem:
1. SCOB
2. EMA
3. BoS, ChoCh, Sweep
4. IDM
5. IDM OB and Ext OB
Users can simply check the desired alerts in the menu and activate them to receive notifications when price reaches specified zones.
Multi Timeframe Breakout/Retest (Gap, FVG, B&R)📊 Breakout & Retest Multi-Timeframe Indicator - Support and Resistance Indicator 📊
In short, this indicator scans 4 timeframes of your choice to check if a proper breakout of your support and resistance lines you input has happened. It color-coats your support and resistance levels based on the type of breakout, labels the levels, and shows which timeframes have had a proper breakout in an interactive table. This tool is primarily used to determine when a breakout—whether Fair Value Gap (FVG), gap, or regular—has occurred, allowing you to confidently play the retest.
🔍 Types of Breakouts:
This indicator highlights three types of breakouts:
Regular Breakouts: Defined when a candle breaks above or below your level, then closes, and the next candle’s wick does not touch that level.
Gap Breakouts: A gap breakout occurs when we gap above or below the level—often happening on daily candle opens and closes.
FVG Breakouts: An FVG breakout happens when a breakout above or below your level forms a Fair Value Gap, with your level inside the gap. These breakouts tend to have stronger retests
📋 Interactive Table
The table helps you visualize which levels are experiencing a breakout and on which timeframes. It color-codes each level based on breakout activity:
🔴 Red: No active breakouts
🟢 Green: Active regular breakout
🔵 Blue: Active FVG breakout
🟡 Yellow: Active gap breakout
🎨 Color Coating & Minimum Timeframe Breakouts
To make sure you're playing a true breakout, you want confirmation on at least 3 of your chosen timeframes. This indicator has an adjustable "active minimum breakout" setting, which can be customized between 1 and 4 timeframes. I personally find that when a breakout occurs on at least 3 timeframes, the retest tends to have a higher success rate. But you can adjust this setting based on your strategy.
🔧 Future Updates (Follow for Updates):
🚨 Alerts: Set alerts for breakouts and retests.
⚙️ Improved Error Handling: For a smoother experience.

Imbalance Detector [LuxAlgo]This indicator detects and highlights market imbalances alongside a dashboard returning information about their frequency of occurrence and their fill percentage. Imbalances included in this script are Fair Value Gaps (FVG), Opening Gaps (OG) and Volume Imbalances (VI).
Alerts are available for the occurrences of all market imbalances.
Settings
Imbalances
Each imbalance has the same settings layout:
Imbalance: Enable/disable the detection of the specific imbalance.
Min Width: If enabled, requires the imbalance area width to be greater than the specified value. This minimum width can be expressed in points, percentages or ATR multiples.
Extend: Extend imbalances by a specified number of bars.
Dashboard
Show Dashboard: Enable/disable the dashboard on the chart.
Dashboard Location: Location of the dashboard on the chart.
Dashboard Size: Size of the dashboard.
Usage
Market imbalances are part of the many concepts available to price action traders and highlight areas where there is a disparity between supply and demand.
It is common to see price come back to these areas and traders often use them as supports and resistances but also as targets.
Details
The script can detect three distinct types of imbalances described below.
Fair Value Gaps
Fair Value Gaps (FVG) are three candle formations characterized by a gap between the wicks of the non-adjacent candles in the formation.
A bullish FVG is characterized by a gap between the current price low and the 2 bars anterior price high, and a bearish FVG is characterized by a gap between the current price high and the 2 bars anterior price low.
Opening Gaps
Opening Gaps (OG) are imbalances characterized by non-existent activity within a specific price range.
A bullish OG occurs when the current price low is greater than the previous high, a bearish OG occurs when price high is lower than the previous price low.
Opening Gaps primarily occur in closing markets, as such they are less common in the cryptocurrency market.
Most of the time an Opening Gap will also be accompanied by a Fair Value Gap, in order to avoid clutter the indicator will not detect Fair Value Gaps if Opening Gaps are enabled and if an Opening Gap has been detected
Volume Imbalances
Volume Imbalances (VI) are characterized by a price discontinuity between the opening price and previous close, but unlike Opening Gaps we do not see nonexistent activity within a certain price range.
A bullish VI occur when both the opening and closing prices are superior to the previous closing price, with the current price low overlapping the previous price high. A bearish VI occur when both the opening and closing prices are inferior to the previous closing price, with the current price high overlapping the previous price low.
Because Volume Imbalances can occur excessively on markets with frequent gaps, we make use of an additional condition for filtering out less significant imbalances. Bullish VI's will require the previous price high to be lower than the opening price, while bullish VI's will require the previous price low to be higher than the opening price.

MTF fair value gap v2 thigh gaps yumwell load in 2 FVG indicators one for current chart then one for MTF of interest.
Higher timeframe FVGs are more important and can be used for bias or even targets for internal liquidity.
big thanks @shanxia for basically re-doing the FVGs into arrays hehehe..
Can now delete mitigated or change mitigated color..
I dont know who uses extensions but if you want to suffer in your private time then go ahead...
pre sure this is the sexiest FVG indicator validate me in the description pls
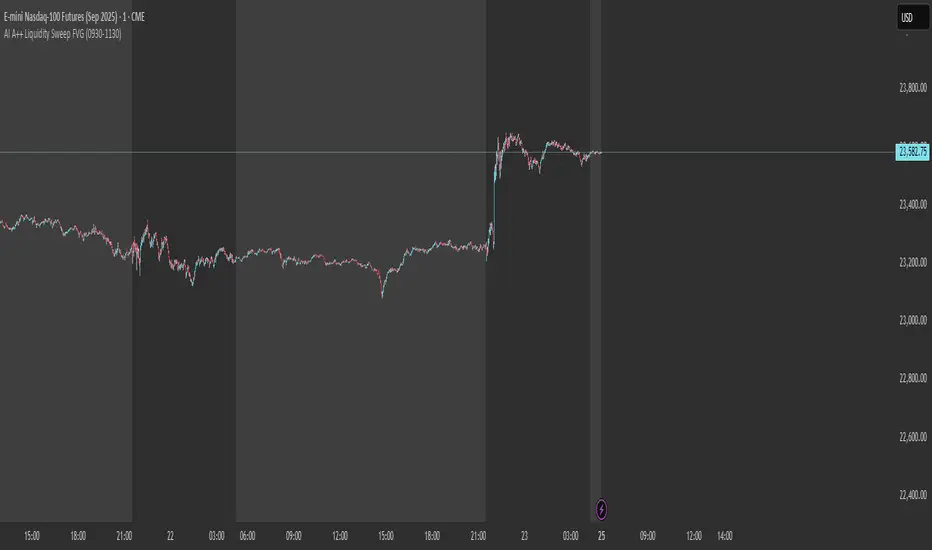
AI A++ Liquidity Sweep FVGThat is a critical question. For the "AI A++ Liqu-idity Sweep FVG" indicator to work exactly as designed, you must have your chart set to the:
1-Minute (1m) Timeframe
The Reason:
The logic of the script is built to analyze the very specific, rapid price action that occurs in the first few minutes of the New York session open.
FVG Detection: A Fair Value Gap is a three-candle pattern. On the 1-minute chart, this allows us to see the rapid imbalances created by the opening burst of volume. On a higher timeframe like the 5-minute or 15-minute, these subtle but powerful gaps would be smoothed over and might not even be visible.
Liquidity Sweep Precision: The script is looking for a quick "stop hunt" that pierces the pre-market high or low and then immediately reverses. This action is most clearly and accurately seen on the 1-minute chart.
Using any other timeframe will cause the indicator to analyze the market incorrectly and either miss valid setups or provide false signals.
So, to confirm your setup for Monday morning:
Instrument: MNQ (Micro E-mini Nasdaq-100 Futures)
Timeframe: 1-Minute
Indicator: "AI A++ Liquidity Sweep FVG" active on the chart.
Alert: Alert set up for the indicator.
You are now perfectly set up to catch the exact A++ setup we are waiting for.
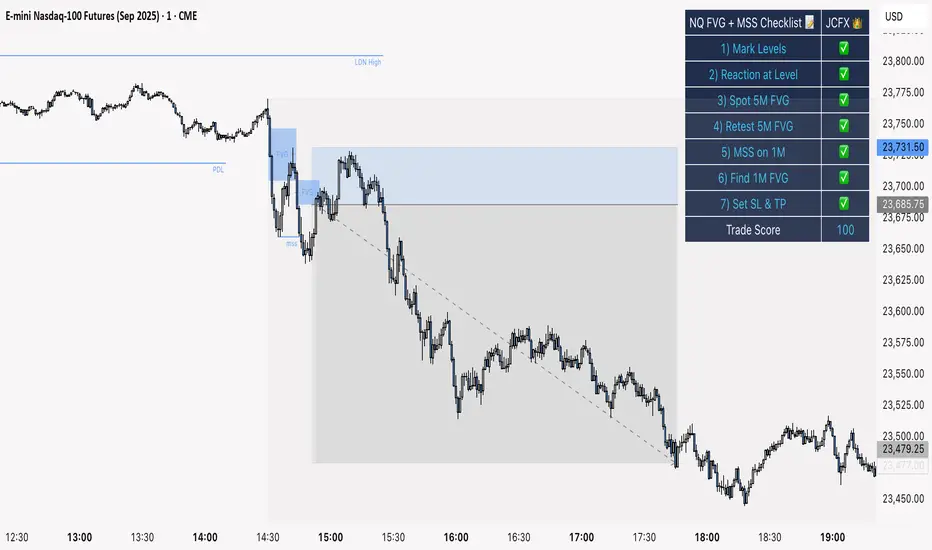
NQ FVG + MSS ChecklistThe NQ FVG + MSS Quick Checklist is a visual trading HUD for Nasdaq 100 (NQ) futures. It helps traders quickly track key setup elements: session & previous day levels, 5M FVG, retests, 1M MSS, and 1M FVG inside MSS.
Each step can be manually ticked, and a Trade Score shows setup strength at a glance. The checklist table sits on top of all chart elements for easy reference without interfering with your analysis.
Features:
Step-by-step NQ trading checklist
Manual inputs with visual ✅/❌
Trade Score for quick setup confirmation
Table overlay always on top of the chart
ICT SMC By VIPIN | Volume OB + BOS, CHoCH, FVG, Sweep VTTitle:
Smart Money Concepts Pro – OB, FVG, BOS, CHoCH & Liquidity Sweep
Description:
This indicator is built on Smart Money Concepts (SMC) and is designed to help traders analyze market structure in depth. It identifies institutional trading levels, potential reversal points, and high-probability trade setups using advanced price action techniques.
Key Features:
1. Order Blocks (OB) – Detects and marks bullish and bearish order blocks to identify possible reversal and continuation zones.
2. Fair Value Gaps (FVG) – Highlights price imbalances that often attract price retracements.
3. Break of Structure (BOS) – Marks structural breaks that confirm trend continuation.
4. Change of Character (CHoCH) – Signals early signs of trend reversal.
5. Liquidity Sweep – Highlights buy-side and sell-side liquidity grabs to identify stop hunts and false breakouts.
6. Custom Styling & Filters – Users can customize colors, sizes, and filter settings for better clarity.
How It Works:
• The indicator automatically detects market structure (HH, HL, LH, LL) and identifies BOS and CHoCH based on price movement.
• Order Blocks are filtered using past price action and volume confluence to show only significant zones.
• Fair Value Gaps and Liquidity Sweeps are detected with a smart logic system for improved accuracy.
How to Use:
• Use higher timeframes (H1, H4, Daily) to determine the main trend and lower timeframes (M15, M5) for entries.
• Combine Order Blocks and FVGs for strong confluence.
• Wait for BOS/CHoCH confirmations along with liquidity sweep signals before entering trades.
Disclaimer:
This tool is for chart analysis assistance only. Always conduct your own research and apply proper risk management before trading.

ICT Concepts: MML, Order Blocks, FVG, OTECore ICT Trading Concepts
These strategies are designed to identify high-probability trading opportunities by analyzing institutional order flow and market psychology.
1. Market Maker Liquidity (MML) / Liquidity Pools
Idea: Institutional traders ("market makers") place orders around key price levels where retail traders’ stop losses cluster (e.g., above swing highs or below swing lows).
Application: Look for "liquidity grabs" where price briefly spikes to these levels before reversing.
Example: If price breaks a recent high but reverses sharply, it may indicate a liquidity grab to trigger retail stops before a trend reversal.
2. Order Blocks (OB)
Idea: Institutional orders are often concentrated in specific price zones ("order blocks") where large buy/sell decisions occurred.
Application: Identify bullish order blocks (strong buying zones) or bearish order blocks (strong selling zones) on higher timeframes (e.g., 1H/4H charts).
Example: A bullish order block forms after a strong rally; price often retests this zone later as support.
3. Fair Value Gap (FVG)
Idea: A price imbalance occurs when candles gap without overlapping, creating an area of "unfair" price that the market often revisits.
Application: Trade the retracement to fill the FVG. A bullish FVG acts as support, and a bearish FVG acts as resistance.
Example: Three consecutive candles create a gap; price later returns to fill this gap, offering a entry point.
4. Time-Based Analysis (NY Session, London Kill Zones)
Idea: Institutional activity peaks during specific times (e.g., 7 AM – 11 AM New York time).
Application: Focus on trades during high-liquidity periods when banks and hedge funds are active.
Example: The "London Kill Zone" (2 AM – 5 AM EST) often sees volatility due to European market openings.
5. Optimal Trade Entry (OTE)
Idea: A retracement level (similar to Fibonacci retracement) where institutions re-enter trends after a pullback.
Application: Look for 62–79% retracements in a trend to align with institutional accumulation/distribution zones.
Example: In an uptrend, price retraces 70% before resuming upward—enter long here.
6. Stop Hunts
Idea: Institutions manipulate price to trigger retail stop losses before reversing direction.
Application: Avoid placing stops at obvious levels (e.g., above/below recent swings). Instead, use wider stops or wait for confirmation.

CandelaCharts - Imbalance Concepts 📝 Overview
Imbalance Concepts is an advanced toolkit rooted in ICT (Inner Circle Trader) principles, specifically designed to identify and highlight critical areas of support and resistance within financial markets. This toolkit focuses on detecting market imbalances that can indicate potential turning points or high-probability zones for price action.
The key components of the toolkit include:
Fair Value Gaps (FVG)
Inversion Fair Value Gaps (IFVG)
Balanced Price Range (BPR)
Volume Imbalances (VI)
Opening Gaps (OG)
The toolkit automatically detects these imbalances and visually marks them on charts, allowing traders to quickly identify key zones for analysis. This enables more informed decision-making, as these imbalances often signal the potential for major market shifts, reversals, or continuation patterns.
By integrating Imbalance Concepts, traders can focus on critical price areas that have a high likelihood of influencing future price action.
📦 Features
The Imbalance Concepts toolkit provides a robust set of features aimed at improving trading accuracy and decision-making. Key features include:
MTF
Mitigation
Consequent Encroachment
Threshold
Hide Overlap
Advanced Styling
⚙️ Settings
Show: Controls whether Imbalances are displayed on the chart.
Show Last: Sets the number of Imbalances you want to display.
Length: Determines the length of each Imbalance.
Mitigation: Highlights when an Imbalance has been touched, using a different color without marking it as invalid.
Timeframe: Specifies the timeframe used to detect Imbalances.
Threshold: Sets the minimum gap size required for Imbalance detection on the chart.
Show Mid-Line: Configures the midpoint line's width and style within the Imbalance. (Consequent Encroachment - CE)
Show Border: Defines the border width and line style of the Imbalance.
Hide Overlap: Removes overlapping Imbalances from view.
Extend: Extends the Imbalance length to the current candle.
Elongate: Fully extend the Imbalance length to the right side of the chart.
⚡️ Showcase
Fair Value Gaps (FVG)
Inversion Fair Value Gaps (IFVG)
Balanced Price Range (BPR)
Volume Imbalances (VI)
Opening Gaps (OG)
📒 Usage
The key components of trading imbalances include:
Step 1 – Identify Market Trend: Begin by determining the market trend for the asset, whether it is bullish or bearish.
Step 2 – Locate Premium and Discount Zones: In a bearish market, focus on identifying the premium Imbalance, while in a bullish market, look for the discount Imbalance.
Step 3 – Detect Liquidity Sweep: After identifying the trend, the next step is to spot a liquidity sweep, which often indicates a potential price reversal or continuation.
Step 4 – Detect Change In State of Delivery: Following the liquidity sweep, the next step is to recognize a CISD, which frequently serves as a confirmation of a potential price reversal.
Step 5 – Execute the Trade: In a bullish market, wait for the price to retrace and test the discount imbalance, aiming to balance the price movement before entering the trade.
NOTES:
You always short only on Premium, and long on Discount.
Fair Value Gaps (FVG)
Inversion Fair Value Gaps
Balanced Price Range
🚨 Alerts
The indicator provides the ability to set alerts for various significant market events related to its core features.
You can configure alerts for the following key events:
Fair Value Gaps Formation (+B/-B)
Inversion Fair Value Gaps Formation (+B/-B)
Balanced Price Range Formation (+B/-B)
Volume Imbalances Formation (+B/-B)
Opening Gaps Formation (+B/-B)
⚠️ Disclaimer
These tools are exclusively available on the TradingView platform.
Our charting tools are intended solely for informational and educational purposes and should not be regarded as financial, investment, or trading advice. They are not designed to predict market movements or offer specific recommendations. Users should be aware that past performance is not indicative of future results and should not rely on these tools for financial decisions. By using these charting tools, the purchaser agrees that the seller and creator hold no responsibility for any decisions made based on information provided by the tools. The purchaser assumes full responsibility and liability for any actions taken and their consequences, including potential financial losses or investment outcomes that may result from the use of these products.
By purchasing, the customer acknowledges and accepts that neither the seller nor the creator is liable for any undesired outcomes stemming from the development, sale, or use of these products. Additionally, the purchaser agrees to indemnify the seller from any liability. If invited through the Friends and Family Program, the purchaser understands that any provided discount code applies only to the initial purchase of Candela's subscription. The purchaser is responsible for canceling or requesting cancellation of their subscription if they choose not to continue at the full retail price. In the event the purchaser no longer wishes to use the products, they must unsubscribe from the membership service, if applicable.
We do not offer reimbursements, refunds, or chargebacks. Once these Terms are accepted at the time of purchase, no reimbursements, refunds, or chargebacks will be issued under any circumstances.
By continuing to use these charting tools, the user confirms their understanding and acceptance of these Terms as outlined in this disclaimer.

ICT 9:30am First FVGThis indicator is designed based on ICT (Inner Circle Trader)'s algorithmic price action theory, specifically targeting the first fair value gap (FVG) that forms immediately after the New York Stock Exchange opens at 9:30am. The FVG represents an imbalance in the price delivery where a significant price action gap occurs, which can play a crucial role in future price movements.
Features:
Identification of First FVG: Automatically identifies and plots the first fair value gap that forms post the 9:30am NY open.
Customizable Visualization: Choose between block or line styles for visual representation, with customizable colors and border styles.
Date Labeling: Optionally displays date labels for each identified gap to track patterns over time.
Imbalance Extension: Options to extend the imbalances to the current bar, helping to visualize their influence on ongoing price action.
Purpose:
The first fair value gap formed after the market opens is an important algorithmic price range in ICT's price action theory. This indicator simplifies the identification of these critical gaps and helps in understanding their impact on future price action.
SMC Community [algoat] — Smart Money ConceptsEmpower your trading with the core principles of the Smart Money Concepts through interactive features and highly customizable settings.
The indicator's strength lies in the unique SMC Core algorithm, a calculation based on real price action data, capturing every tick from small intraday fluctuations to significant high timeframe movements.
algoat SMC Core is our continually evolving, specialized structure mapping algorithm, serving as the backbone of our price action related publications.
⭐ Key Features
Swing Market Structure: Change of Character, Break of Structure
Recognize and visualize real-time market structures with swing elements. Identify and mark key structural changes in the market to visually highlight shifts in market trends and patterns. This feature is designed to alert you to significant changes in the market's behavior, signaling a potential shift from accumulation to distribution phases, or vice versa. It helps traders adapt their strategies based on evolving market dynamics.
Order Flow: Structure Fractal
Connect the successive structural high and low levels, visualizing the intricate flow of market movements. This feature highlights fractal structures within the market, enabling traders to detect significant price action patterns.
Structure Range: Determine Discount, Premium, and Equilibrium Zones
This feature provides a unique way of visualizing price areas where a security could be overbought or oversold (premium or discount zones) and where the price is expected to be fair and balanced (equilibrium zone). Distance from the current price is displayed in percentage terms, which can assist traders with crucial data for risk management and strategic planning. The Range function helps you identify the most favorable price zones for entries and set your stop-loss and take-profit levels more accurately.
Liquidity Grabs: Reveal Hidden Manipulation Attempts
Identify uncovered market areas where high liquidity trading may take place. Liquidity Grabs help track "smart money" footprints by identifying levels where large institutional traders may have induced liquidity traps. Understanding these traps can aid in avoiding false market moves and optimizing trade entries.
Institutional Interest Zones: Order Blocks and Fair Value Gaps
Uncover areas where bigger orders may be lined up. Reveal zones of interest ordered by volume strength. Receive warnings about market price imbalances.
▸ Order Blocks pinpoint crucial zones where large institutional investors ("smart money") have shown strong buying or selling interest recently. These blocks can serve as a tool for identifying key areas for potential trade entries or exits.
▸ Fair Value Gaps detect discrepancies between the perceived market value and the actual market price, revealing potential areas for price correction. With its mitigation settings, you can fine-tune the FVG detection according to the magnitude of value misalignment you consider significant.
Mitigation types dictate how price interacts with a zone, with order blocks requiring a close through (indicating stronger price movement) and fair value gaps requiring a wick through (hinting at weak rejection).
══════════════════
⭐ Why SMC?
In the ever-evolving trading landscape, mainstream methods and strategies can quickly become outdated as they are widely adopted. Liquidity is constantly sought after, and the best source for this is exploring and exploiting trading strategies that are widely accepted and applied. Currently, one of these strategies is the SMC (Supply, Demand, and Price Action).
It's no coincidence that our educational materials incorporate concepts such as liquidity grabs (LG) and Smart Money Traps (SMT). As the application of SMC gains popularity among retail traders, trading with this approach becomes more challenging. Therefore, the recent focus has been on reforming the SMC methodology, as it is the only method that relies on real price movements and will always work when applied correctly.
The indicator reflects our personal use and deep comprehension of Smart Money Concepts. It provides streamlined tools for tracking algorithmic trends with modern visualizations, without unnecessary clutter.
▸ What does the proper application of SMC entail?
Many SMC traders associate their key areas of interest with the market structure, which is generally considered acceptable. However, depending solely on a single foundation can lead to significant deviations, which may cause notable impacts on trading results. Moreover, if the basis for the market structure calculation is inaccurate, the consequences can be even more severe. It's akin to risking money on a lottery ticket, believing it will be a winner.
Our methodology is different, and it may ensure longevity in the financial markets. The structure remains crucial, but it is not the sole foundation of everything; instead, it serves as a validation tool. Each calculation, such as order blocks (OB), Fair Value Gaps (FVG), liquidity grabs (LG), range analysis, and more, is independent and unique, separate from the structure. However, validation must ultimately come from the structure itself.
We employ individual and high-quality filters: before a function calculation is validated by the structure, it must undergo rigorous testing based on its own set of validation conditions. This approach aims to enhance robustness and accuracy, providing traders with a reliable framework for making informed trading decisions.
▸ An example of structure validation: Order Block with "Swing Sensitivity"
These order blocks will only be displayed and utilized by the script if there is a swing structure validation with a valid break. In other words, the presence of a confirmed swing Change of Character (ChoCh) or Break of Structure (BoS) is essential for the Order Block to be considered valid and relevant.
This approach ensures that the order blocks are aligned with the overall market structure and are not based on isolated or unreliable price movements. Whether it's Fair Value Gaps (FVG), Liquidity Grabs (LG), Range calculations, or other functionalities, the same underlying principle holds true. The background structure calculation serves as a validation mechanism for the data and insights generated by these functions, ensuring they adhere to the specific criteria and rules established within our methodology. By incorporating this robust validation process, traders can have confidence in the reliability and accuracy of the information provided by the indicator, allowing them to make informed trading decisions based on validated data and analysis.
══════════════════
👉 Usage - the general approach
Determine your trading style and build your basic strategy:
The indicator helps you understand your trading style, whether it's swing trading, scalping or another approach. By analyzing the SMC indicator, you gain valuable information about potential market trends, entry and exit points, and overall market sentiment.
Steps:
Identify Trading Style: Determine whether you are a swing trader, scalper, or long-term investor. This will influence how you use the indicator.
Analyze Market Trends: Use the SMC indicator to observe market trends and identify potential entry and exit points.
Adapt Strategies: Adjust your strategies based on the market dynamics revealed by the SMC indicator, such as changes in order flow or market structure.
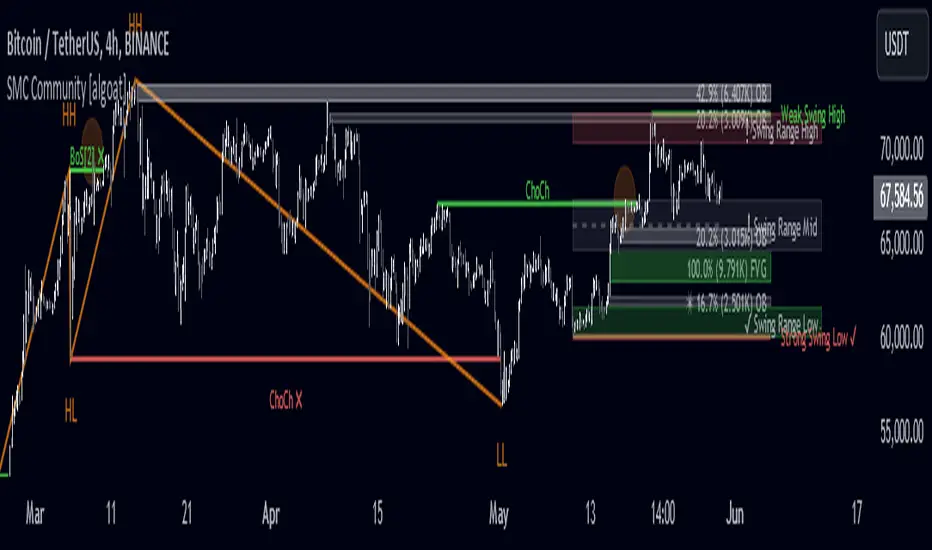
👉 Example of usage
In the following chart, you'll notice how we've utilized the indicator to formulate a strategic trading approach. We've employed Order Blocks equipped with volume parameters to identify crucial market zones. Simultaneously, we've leveraged swing/internal market structures to gain insights into potential long- and short-term market turnarounds. Lastly, we've examined trend line liquidity zones to pinpoint probable impulses and breakouts within ongoing trends.
Now we can see how the price descended to the order block with the highest volume, which we had previously marked as our point of interest for an entry. As the price closed below the median Order Block, we noted its mitigation. After an internal CHoCH, it's directing us towards the main Order Block as a target.
══════════════════
🧠 General advice
Trading effectively requires a range of techniques, experience, and expertise. From technical analysis to market fundamentals, traders must navigate multiple factors, including market sentiment and economic conditions. However, traders often find themselves overwhelmed by market noise, making it challenging to filter out distractions and make informed decisions. By integrating multiple analytical approaches, traders can tailor their strategies to fit their unique trading styles and objectives.
Confirming signals with other indicators
As with all technical indicators, it is important to confirm potential signals with other analytical tools, such as support and resistance levels, as well as indicators like RSI, MACD, and volume. This helps increase the probability of a successful trade.
Use proper risk management
When using this or any other indicator, it is crucial to have proper risk management in place. Consider implementing stop-loss levels and thoughtful position sizing.
Combining with other technical indicators
Integrate this indicator with other technical indicators to develop a comprehensive trading strategy and provide additional confirmation.
Conduct Thorough Research and Backtesting
Ensure a solid understanding of the indicator and its behavior through thorough research and backtesting before making trading decisions. Consider incorporating fundamental analysis and market sentiment into your trading approach.
══════════════════
⭐ Conclusion
We hold the view that the true path to success is the synergy between the trader and the tool, contrary to the common belief that the tool itself is the sole determinant of profitability. The actual scenario is more nuanced than such an oversimplification. A word to the wise is enough: developed by traders, for traders — pioneering innovations for the modern era.
Risk Notice
Everything provided by algoat — from scripts, tools, and articles to educational materials — is intended solely for educational and informational purposes. Past performance does not assure future returns.
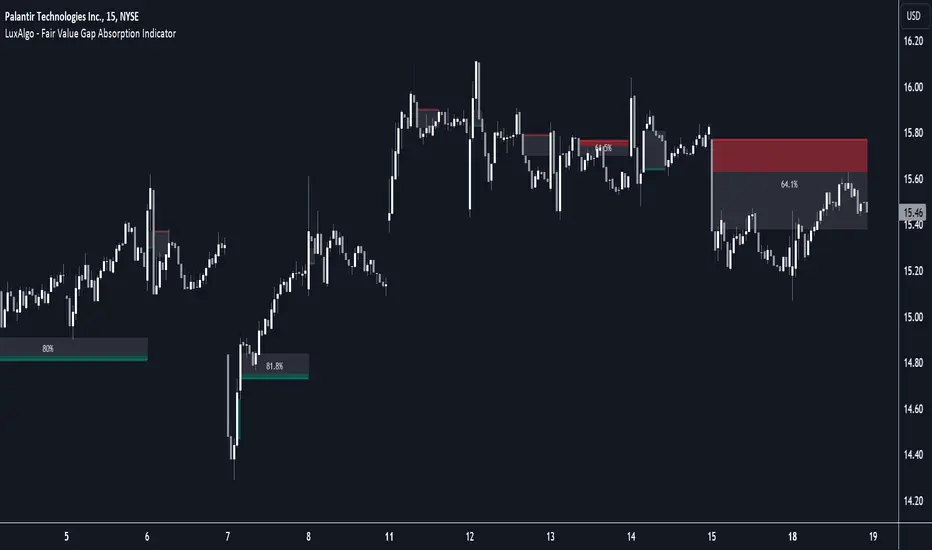
Fair Value Gap Absorption Indicator [LuxAlgo]The Fair Value Gap Absorption Indicator aims to detect fair value gap imbalances and tracks the mitigation status of the detected fair value gap by highlighting the mitigation level till a new fair value gap is detected.
The Fair Value Gap (FVG) is a widely utilized tool among price action traders to detect market inefficiencies or imbalances. These imbalances arise when buying or selling pressure is significant, resulting in a large upward or downward move, leaving behind an imbalance in the market.
🔶 USAGE
A fair value gap appears in a triple-candle pattern when there is a large candle whose previous candle’s high and subsequent candle’s low do not fully overlap the large candle. The space between these wicks is known as the fair value gap.
Price can come back to these imbalance areas and mitigate them, however, this is sometimes a process involving multiple bars, the displayed imbalances by the indicator allow tracking the current mitigation level of a displayed imbalance.
Fair value gaps can become a magnet for the price before continuing in the same direction. Traders commonly wait for the price to revert toward the fair value gap to clear out the imbalance before continuing to move toward the prevailing trend.
🔶 SETTINGS
🔹Fair Value Gaps
Fair Value Gap Width Filter: defines the filtering multiplier, please refer to the tooltip of the input option for further details.
Bullish, Imbalance and Mitigation: color customization option.
Bearish, Imbalance and Mitigation: color customization option.
Display Percentage of Mitigation: Display the percentage of the mitigation areas.
Historical Fair Value Gaps: toggles the visibility of the historical fair value gaps.
🔶 LIMITATIONS
Please note that filtering cannot be applied for the first 144 (atr fixed-length) candles since the atr value won't be present that is used for filtering.
🔶 RELATED SCRIPTS
Fair-Value-Gap
HTF-Fair-Value-Gap
Liquidity-Voids-FVG
IMGBasic - HTF Structure / Order Blocks / Breakers - V1.0IMG Indicators Overview
The IMG Indicators are crafted as comprehensive educational tools for price action traders. They incorporate a variety of concepts including:
1. Multiple Timeframe Analysis
2. Order Blocks (OB)
3. Breakers (BRKR)
4. Fair Value Gaps (FVGs)
5. Overlaps of OB and FVG
6. Overlaps of BRKR and FVG
7. Analysis of Internal and External Liquidity
8. Strategies for Identifying Potential Entries, Stop-loss, and Target Levels
9. Risk Management and Position Sizing
These Price Action concepts can be applied to any market (Stocks / Options / Forex / Futures / Crypto ) and any timeframe.
Introduction to the IMG Basic Indicator
The IMG Basic Indicator serves as the foundational level within the IMG suite of indicators. Its core function is to acquaint traders with elementary price action concepts such as:
1. Higher Timeframe Market Structures through Multiple Timeframe Analysis
2. Higher Timeframe Order Blocks
3. Higher Timeframe Breakers
4. Breaks in Higher Timeframe Market Structure
Higher Timeframe Market Structure:
Market Structure can be defined using several techniques. The IMG indicators employ the Close through High/Low technique, which necessitates a candle close through a structural level to validate a structural break and designate a new range.
Example: H12 Market Structure visualisation on a H12 Chart with annotations:
By selecting a particular Market Structure timeframe in the settings, the indicator immediately illustrates both current and historical market structures for the chosen timeframe across all subordinate timeframes, subject to the limitations of your Tradingview subscription.
Example: H12 Market Structure visualisation on a H1 Chart with annotations:
Higher Timeframe Order Blocks (OB)
An Order Block represents the last candle of the opposite direction preceding a Market Structure Break. For instance, a bullish Order Block is identified as the final bearish candle leading to a bullish market structure break, and vice versa for bearish Order Blocks.
Example: H12 OB visualisation on a H12 Chart with annotations:
When activated, the indicator will highlight the Higher Timeframe Order Blocks responsible for a Market Structure Break on all subordinate timeframes relative to the chosen Market Structure Timeframe.
Note: if multiple OBs exist, the indicator will display the OB closest to the new range extreme
Example: H12 OB visualisation on a H1 Chart with annotations:
Higher Timeframe Breaker Blocks (BRKR)
A Breaker Block is identified as the most recent Order Block that has been breached by price, followed by an opposite Market Structure Break. For example, a bullish Breaker Block is the last bearish Order Block that price has passed through, followed by a bullish structural break, and the inverse is true for bearish Breakers.
Example: H12 Breaker visualisation on a H12 Chart with annotations:
Once enabled, the system will display Higher Timeframe Breaker Blocks after an opposite Market Structure Break is confirmed on all subordinate timeframes.
Example: H12 Breaker visualisation on a H1 Chart with annotations:
ALERTS: Higher Timeframe Market Structure Breaks (HTF MSBs)
The system provides notifications of confirmed Market Structure Breaks based on the selected Higher Timeframe Market Structure Timeframe. For instance, selecting a weekly structure will trigger an alert when price closes through a weekly structural level, and the same logic applies to other timeframes like D, H12, H4, H1 etc.
To enable alerts, right-click on the indicator and select “Add Alert on IMG ...”. You may customise the alert name as desired and then click 'Create' to finalise the alert setup.
General Note:
There is no system, indicator, algorithm, or strategy that can provide absolute certainty in predicting market movements. Use trading indicators as a tool to assist with trading decisions and manage your risk wisely.
For a complete user manual / knowledge base on the IMG Indicators, click on the User Manual link in the signature below
Stay safe and Happy Trading!

ICT Institutional Order Flow (fadi)ICT Institutional Order Flow indicator is intended to provide wholistic view to better analyze order flow and where price may go to next. The concept follows ICT principles.
ICT Market Structure
ICT breaks down Pivot points into three categories:
Short Term High/Low (STH/STL) is a 3 candle pattern with a low with higher low on each side (STL), or a high with lower high on each side (STH)
Intermediate Term High/Low (ITH/ITL) uses the calculated STH/STL and marks any STH that has lower or STH on each side, and STL that has higher STL on each side
Long Term High/Low (LTH/LTL) uses the calculated ITH/ITL and marks any ITH that has lower or ITH on each side, and ITL that has higher ITL on each side
Note: ICT also states that if a STH wicks into and closes (almost?) a FVG, he marks it as ITH even if it does not have STH on reach side. This scenario is not covered by this indicator
Liquidity
liquidity is usually present under pivot points. The more prominent the pivot point, the more likely higher values liquidity pools reside under/above it. Liquidity under ITL and LTL as an example, will have better indication of which liquidity the price may seek next.
Displacement
Displacement registers above average move in the price resulting in strong visible move. If requiring a FVG is enabled (in settings), then the displacement could possibly (but never guaranteed) be used to visually recognize a move as it develops.
Full Credit: The calculation for Displacement is derived from TFO's Visualizing Displacement
Imbalances
Imbalances can come in different forms. This indicator identifies three type of imbalances:
1. FVG
2. Volume Imbalance
3. Open Gaps
Imbalances completes the picture by help visualize strong moves, where possible pivot points may develop, and how to enter or manage a trade.

Fair Value Gap█ OVERVIEW
This indicator displays the Fair Value Gap of the current timeframe and an additional higher timeframe. For each FVG the gaps act as targets creating bullish and bearish gaps that are often filled.
█ FEATURES
MTF Options
MidPoint FIll
Delete Old On Fill
Label FVG Timeframe
MTF Options
Enabling the MTF Options will allow the user to use the "MTF Timeframe" setting to choose what HTF Fair Value Gap to display
MidPoint FIll
A line plot at the Half way point will be included in the Fair Value Gap, this will be used to delete the gap when reached instead of a full fill.
Delete Old On Fill
Deletes historical Fair Value Gaps when filled.
Label FVG Timeframe
Labels Every Fair Value gap with there relevant timeframe to make it easier to determine which gap is being filled.
█ HOW TO USE IT
The indicator is quite straight forward in its application, providing users with targets that are often filled as they are seen as market imbalance.
Just applying it to your chart will provide the existing Fair Value Gaps. MTF Confluence is helpful in seeing what is happening on the macro perspective.
█ SUGGESTION
My suggestion for clarity is to use a different color to some degree between the MTF and Current TF as Opposed to text, keeps the chart clear.
█ LIMITATIONS OF PINE (Please read)
I see many users going on different indicators with MTF in mind and trying to use it for LTF data e.g. 1hour chart, and selecting 5min in chart settings.
This is not recommended by the team themselves and should be noted for use always use HTF: www.tradingview.com
To understand how to use fair value gaps I recommend learning about the subject some more, searching online will provide you resources. The internet is your friend when learning. All the best.

ICT – Sweep + FVG + Displacement The ICT (Inner Circle Trader) strategy is a sophisticated trading philosophy rooted in institutional market behavior. It revolves around understanding how large players manipulate price to trigger retail stop-losses, create liquidity, and execute their orders. At its core, ICT focuses on market structure, identifying Higher Highs, Lower Lows, and shifts that signal potential reversals. Key concepts include Order Blocks—zones where institutions placed significant orders—and Fair Value Gaps (FVG), untraded areas that price tends to return to. The Liquidity Grab is a crucial phase: price sweeps through key levels to trap retail traders before reversing. Traders use higher timeframes (H4/H1) for structure analysis and lower ones (M15/M5) for precise entries. Entries occur after a Market Structure Shift, confirmed by FVG fill or OB retest, with strict risk management. A minimum 3:1 risk-reward ratio ensures long-term profitability. The strategy demands deep market awareness, patience, and discipline. It’s not about indicators, but about reading the "invisible hand" of the market—where supply and demand meet, and where smart money moves. For advanced traders, ICT offers a window into the true mechanics of price action, transforming trading from speculation into strategic insight. It’s not just a method—it’s a mindset.
