Sunmool's Trend Reversal Detection AlgorithmSunmool's Trend Reversal Detection Algorithm 사용 설명서
📋 알고리즘 개요
Sunmool's Trend Reversal Detection Algorithm은 Fair Value Gap(FVG), Change in State of Direction(CISD), Break of Structure(BOS) 개념을 활용하여 추세 반전을 단계별로 감지하는 트레이딩뷰 인디케이터입니다.
조건이 단계별로 달성될수록 추세 반전의 신뢰도가 높아지며, 최대 20단계까지 추적하여 극도로 높은 신뢰도의 신호를 제공합니다.
🎯 핵심 개념
Fair Value Gap (FVG)
정의: 3개 캔들 사이에 생긴 가격 공백 (갭)
상승 FVG: 현재 캔들의 저점 > 2캔들 전 고점
하락 FVG: 현재 캔들의 고점 < 2캔들 전 저점
역할: 시장의 불균형을 나타내며, 향후 되돌림 지역으로 작용
Change in State of Direction (CISD)
정의: 추세의 방향성 변화
감지 방법: 단기 이동평균(5)과 장기 이동평균(10)의 교차
역할: 추세 전환의 초기 신호 확인
Break of Structure (BOS)
정의: 중요한 지지/저항 레벨의 돌파
조건: 종가와 고점/저점이 모두 기준 레벨을 넘어설 때
역할: 추세 전환의 확정적 신호
📊 단계별 조건 설명
🔵 1번 조건 - FVG 형성
조건: Fair Value Gap이 형성되었을 때
표시: 파란색 박스 + 파란색 원 마크
의미: 시장 불균형 발생, 추세 반전 가능성의 시작점
신뢰도: ⭐ (매우 낮음)
🟠 2번 조건 - FVG 터치 + CISD
조건: 1번 FVG를 가격이 터치한 후 → CISD 발생
표시: 주황색 삼각형 마크
의미: FVG 반응 + 추세 변화 신호 확인
신뢰도: ⭐⭐ (낮음)
🟢 3번 조건 - 몸통 돌파 + 새 FVG
조건: 캔들 몸통이 기존 FVG 레벨을 돌파 + 새로운 FVG 형성
표시: 초록색 박스 + 초록색 다이아몬드 마크
의미: 구조적 돌파와 새로운 불균형 생성
신뢰도: ⭐⭐⭐ (보통)
🔴 4번+ 조건 - BOS + 새 FVG (반복)
조건: FVG 터치 → BOS 발생 → 새로운 FVG 형성
표시: 조건 레벨에 따른 색상 박스 + 빨간색 깃발 마크
의미: 추세 전환 확정 및 연속적 강화
신뢰도:
4-6번: ⭐⭐⭐⭐ (높음)
7-9번: ⭐⭐⭐⭐⭐ (매우 높음)
10번+: ⭐⭐⭐⭐⭐⭐ (최고)
🖥️ 인터페이스 설명
시각적 표시
FVG 박스: 각 단계별 Fair Value Gap 영역을 색상별로 표시
조건 라벨: 각 조건 달성 시 상세 정보가 담긴 라벨 표시
백테스트 마크: 차트 하단에 조건별 다른 모양의 마크 표시
통계 테이블: 우상단에 실시간 상태 정보 표시
색상 체계
파란색: 1번 조건 (FVG 형성)
주황색: 2번 조건 (CISD)
초록색: 3번 조건 (몸통 돌파)
남색: 4-5번 조건
적갈색: 6-7번 조건
빨간색: 8-9번 조건
보라색: 10번+ 조건
통계 테이블 항목
현재 조건: 현재 달성된 최고 조건 레벨
신뢰도: 조건 레벨에 따른 신뢰도 (낮음~최고)
상태: 다음 조건을 위해 기다리는 상황
경과바: 마지막 조건 달성 이후 경과한 캔들 수
⚙️ 설정 옵션
표시 옵션
FVG 영역 표시: FVG 박스 표시 여부
조건 라벨 표시: 조건 라벨 표시 여부
연결선 표시: 조건들 간 연결선 표시 여부
통계 표시: 우상단 통계 테이블 표시 여부
백테스트 마크 표시: 차트 하단 마크 표시 여부
필터링 옵션
최소 FVG 크기: 감지할 최소 FVG 크기 (기본 0.0005% = 0.05%)
최대 조건 개수: 추적할 최대 조건 레벨 (기본 20개)
📈 사용 방법
1단계: 기본 설정
트레이딩뷰에서 새 인디케이터 추가
파인스크립트 코드 복사/붙여넣기
저장 후 차트에 적용
2단계: 신호 해석
1번 조건: FVG 형성 확인 (관심 지역 설정)
2-3번 조건: 초기 추세 전환 신호 (관찰 단계)
4-6번 조건: 신뢰할 만한 진입 신호 (거래 고려)
7번+ 조건: 높은 확신의 진입 신호 (적극적 거래)
3단계: 리스크 관리
낮은 조건 (1-3번): 작은 포지션으로 테스트
중간 조건 (4-6번): 적정 포지션 크기
높은 조건 (7번+): 더 큰 포지션 고려 (개인 리스크 관리 원칙 내에서)
🎯 실전 활용 팁
진입 전략
4번 이상 조건: 첫 진입 고려점
7번 이상 조건: 추가 진입 또는 포지션 확대
10번 이상 조건: 최고 신뢰도 진입 기회
청산 전략
반대 방향으로 3번 이상 조건 발생 시 청산 고려
새로운 FVG 형성 후 반대 방향 신호 주의
필터링
시간대: 주요 거래 시간대에서 더 신뢰성 높음
볼륨: 거래량이 평소보다 높을 때 더 유효
시장 상황: 트렌드 시장에서 더 효과적
⚠️ 주의사항
리스크 요소
가짜 신호: 낮은 조건 레벨에서는 가짜 신호 가능
지연 신호: 높은 조건일수록 진입 타이밍이 늦을 수 있음
시장 환경: 횡보 시장에서는 효율성 저하
권장사항
백테스트 필수: 실제 거래 전 충분한 백테스트 진행
다른 지표 병행: 다른 기술적 분석과 함께 사용
자금 관리: 항상 적절한 리스크 관리 원칙 준수
🚀 버전 정보
현재 버전: v1.0
Pine Script v5 기반
최대 500개 라벨/박스/라인 지원
실시간 알림 기능 내장
백테스트 친화적 설계
📞 문의 및 지원
이 알고리즘에 대한 문의사항이나 개선 제안이 있으시면 언제든 연락 주세요. 지속적인 업데이트를 통해 더 나은 도구로 발전시켜 나가겠습니다.
면책 조항: 이 인디케이터는 교육 및 분석 목적으로 제작되었습니다. 실제 거래에서의 손실에 대해서는 책임지지 않으니, 반드시 충분한 테스트와 개인 판단 하에 사용하시기 바랍니다.
Sunmool's Trend Reversal Detection Algorithm User Manual
📋 Algorithm Overview
Sunmool's Trend Reversal Detection Algorithm is a TradingView indicator that utilizes Fair Value Gap (FVG), Change in State of Direction (CISD), and Break of Structure (BOS) concepts to detect trend reversals through progressive stages.
As conditions are met step by step, the reliability of trend reversal increases, tracking up to 20 stages to provide extremely high-confidence signals.
🎯 Core Concepts
Fair Value Gap (FVG)
Definition: Price gap between 3 candles
Bullish FVG: Current candle's low > 2 candles ago high
Bearish FVG: Current candle's high < 2 candles ago low
Purpose: Represents market imbalance, acts as future retracement zone
Change in State of Direction (CISD)
Definition: Change in trend direction
Detection Method: Crossover between short-term MA(5) and long-term MA(10)
Purpose: Confirms initial trend reversal signal
Break of Structure (BOS)
Definition: Breaking through important support/resistance levels
Condition: When both close and high/low exceed the reference level
Purpose: Definitive signal of trend reversal
📊 Stage-by-Stage Conditions
🔵 Condition 1 - FVG Formation
Condition: When Fair Value Gap is formed
Display: Blue box + Blue circle mark
Meaning: Market imbalance occurs, starting point of potential trend reversal
Reliability: ⭐ (Very Low)
🟠 Condition 2 - FVG Touch + CISD
Condition: Price touches Condition 1 FVG → CISD occurs
Display: Orange triangle mark
Meaning: FVG reaction + trend change signal confirmation
Reliability: ⭐⭐ (Low)
🟢 Condition 3 - Body Break + New FVG
Condition: Candle body breaks existing FVG level + new FVG formation
Display: Green box + Green diamond mark
Meaning: Structural breakout and new imbalance creation
Reliability: ⭐⭐⭐ (Medium)
🔴 Condition 4+ - BOS + New FVG (Repeated)
Condition: FVG touch → BOS occurs → new FVG formation
Display: Color-coded boxes by condition level + Red flag mark
Meaning: Trend reversal confirmation and continuous strengthening
Reliability:
4-6: ⭐⭐⭐⭐ (High)
7-9: ⭐⭐⭐⭐⭐ (Very High)
10+: ⭐⭐⭐⭐⭐⭐ (Maximum)
🖥️ Interface Description
Visual Display
FVG Boxes: Color-coded Fair Value Gap zones for each stage
Condition Labels: Detailed information labels when each condition is met
Backtest Marks: Different shaped marks below chart for each condition
Statistics Table: Real-time status information in top-right corner
Color Scheme
Blue: Condition 1 (FVG Formation)
Orange: Condition 2 (CISD)
Green: Condition 3 (Body Break)
Navy: Conditions 4-5
Maroon: Conditions 6-7
Red: Conditions 8-9
Purple: Conditions 10+
Statistics Table Items
Current Condition: Highest condition level achieved
Reliability: Confidence level based on condition level (Low~Maximum)
Status: Current waiting situation for next condition
Bars Since: Number of candles since last condition achievement
⚙️ Settings Options
Display Options
Show FVG Areas: Toggle FVG box display
Show Condition Labels: Toggle condition label display
Show Connection Lines: Toggle connection lines between conditions
Show Statistics: Toggle top-right statistics table
Show Backtest Marks: Toggle chart bottom marks
Filtering Options
Minimum FVG Size: Minimum FVG size to detect (default 0.0005% = 0.05%)
Maximum Conditions: Maximum condition levels to track (default 20)
📈 How to Use
Step 1: Basic Setup
Add new indicator in TradingView
Copy/paste Pine Script code
Save and apply to chart
Step 2: Signal Interpretation
Condition 1: Confirm FVG formation (set interest zone)
Conditions 2-3: Initial trend reversal signals (observation phase)
Conditions 4-6: Reliable entry signals (consider trading)
Conditions 7+: High-confidence entry signals (active trading)
Step 3: Risk Management
Low Conditions (1-3): Test with small position
Medium Conditions (4-6): Appropriate position size
High Conditions (7+): Consider larger position (within personal risk management principles)
🎯 Practical Trading Tips
Entry Strategy
Condition 4+: First entry consideration point
Condition 7+: Additional entry or position increase
Condition 10+: Maximum reliability entry opportunity
Exit Strategy
Consider exit when 3+ conditions occur in opposite direction
Watch for opposite direction signals after new FVG formation
Filtering
Time Frame: More reliable during major trading hours
Volume: More valid when volume is higher than usual
Market Condition: More effective in trending markets
⚠️ Important Warnings
Risk Factors
False Signals: Possible false signals at low condition levels
Delayed Signals: Higher conditions may result in late entry timing
Market Environment: Reduced efficiency in sideways markets
Recommendations
Backtesting Required: Conduct thorough backtesting before live trading
Use with Other Indicators: Combine with other technical analysis
Money Management: Always follow proper risk management principles
🚀 Version Information
Current Version: v1.0
Based on Pine Script v5
Supports up to 500 labels/boxes/lines
Built-in real-time alert functionality
Backtest-friendly design
📞 Support & Contact
If you have any questions about this algorithm or suggestions for improvement, please feel free to contact anytime. We will continue to develop it into a better tool through continuous updates.
Disclaimer: This indicator is created for educational and analytical purposes. We are not responsible for losses in actual trading. Please use it after sufficient testing and personal judgment.
在腳本中搜尋"fvg"

Smart Money Concepts by WeloTradesThe "Smart Money Concepts by WeloTrades" indicator is designed to offer traders a comprehensive tool that integrates multiple advanced features to aid in market analysis. By combining order blocks, liquidity levels, fair value gaps, trendlines, and market structure analysis, the indicator provides a holistic approach to understanding market dynamics and making informed trading decisions.
Components and Their Integration:
Order Blocks and Breaker Blocks Detection
Functionality: Order blocks represent areas where significant buying or selling occurred, creating potential support or resistance zones. Breaker blocks signal potential reversals.
Integration: By detecting and visualizing these blocks, the indicator helps traders identify key levels where price might react, aiding in entry and exit decisions. The customizable settings allow traders to adjust the visibility and parameters to suit their specific trading strategy.
Liquidity Levels Analysis
Functionality: Liquidity levels indicate zones where significant price movements can occur due to the presence of large orders. These are areas where smart money might be executing trades.
Integration: By tracking these high-probability liquidity areas, traders can anticipate potential price movements. Customizable display limits and mitigation strategies ensure that the information is tailored to the trader’s needs, providing precise and actionable insights.
Fair Value Gaps (FVG)
Functionality: Fair value gaps highlight areas where there is an imbalance between buyers and sellers. These gaps often represent potential trading opportunities.
Integration: The ability to identify and analyze FVGs helps traders spot potential entries based on market inefficiencies. The touch and break detection functionalities provide further refinement, enhancing the precision of trading signals.
Trendlines
Functionality: Trendlines help in identifying the direction of the market and potential reversal points. The additional trendline adds a layer of confirmation for breaks or retests.
Integration: Automatically drawn trendlines assist traders in visualizing market trends and making decisions about potential entries and exits. The additional trendline for stronger confirmation reduces the risk of false signals, providing more reliable trading opportunities.
Market Structure Analysis
Functionality: Understanding market structure is crucial for identifying key support and resistance levels and overall market dynamics. This component displays internal, external, and composite market structures.
Integration: By automatically highlighting shifts in market structure, the indicator helps traders recognize important levels and potential changes in market direction. This analysis is critical for strategic planning and execution in trading.
Customizable Alerts
Functionality: Alerts ensure that traders do not miss significant market events, such as the formation or breach of order blocks, liquidity levels, and trendline interactions.
Integration: Customizable alerts enhance the user experience by providing timely notifications of key events. This feature ensures that traders can act quickly and efficiently, leveraging the insights provided by the indicator.
Interactive Visualization
Functionality: Customizable visual aspects of the indicator allow traders to tailor the display to their preferences and trading style.
Integration: This feature enhances user engagement and usability, making it easier for traders to interpret the data and make informed decisions. Personalization options like colors, styles, and display formats improve the overall effectiveness of the indicator.
How Components Work Together
Comprehensive Market Analysis
Each component of the indicator addresses a different aspect of market analysis. Order blocks and liquidity levels highlight potential support and resistance zones, while fair value gaps and trendlines provide additional context for potential entries and exits. Market structure analysis ties everything together by offering a broad view of market dynamics.
Synergistic Insights
The integration of multiple features allows for cross-validation of trading signals. For instance, an order block coinciding with a high-probability liquidity level and a fair value gap can provide a stronger signal than any of these features alone. This synergy enhances the reliability of the insights and trading signals generated by the indicator.
Enhanced Decision Making
By combining these advanced features into a single tool, traders are equipped with a powerful resource for making informed decisions. The customizable alerts and interactive visualization further support this by ensuring that traders can act quickly on the insights provided.
Order Blocks ( OB) & Breaker Blocks (BB) Visuals:
📝 OB Input Settings
📊 Timeframe #1
TF #1🕑: Enable or disable Timeframe 1.
What it is: A boolean input to toggle the use of the first timeframe.
What it does: Enables or disables Timeframe 1 for the OB settings.
How to use it: Check or uncheck the box to enable or disable.
📊 Timeframe 1 Selection
Timeframe #1🕑: Select the timeframe for Timeframe 1.
What it is: A dropdown to select the desired timeframe.
What it does: Sets the timeframe for Timeframe 1.
How to use it: Choose a timeframe from the dropdown list.
📊 Timeframe #2
TF #2🕑: Enable or disable Timeframe 2.
What it is: A boolean input to toggle the use of the second timeframe.
What it does: Enables or disables Timeframe 2 for the OB settings.
How to use it: Check or uncheck the box to enable or disable.
📊 Timeframe 2 Selection
Timeframe #2🕑: Select the timeframe for Timeframe 2.
What it is: A dropdown to select the desired timeframe.
What it does: Sets the timeframe for Timeframe 2.
How to use it: Choose a timeframe from the dropdown list.
Additional Info: Higher TF Chart & Lower TF Setting / Lower TF Chart & Higher TF Setting.
📏 Show OBs
OB (Length)📏: Toggle the display of Order Blocks.
What it is: A boolean input to enable or disable the display of Order Blocks.
What it does: Shows or hides Order Blocks based on the selected swing length.
How to use it: Check or uncheck the box to enable or disable.
📏 Swing Length Option
Swing Length Option: Select the swing length option.
What it is: A dropdown to choose between SHORT, MID, LONG, or CUSTOM.
What it does: Sets the length of swings for Order Blocks.
How to use it: Choose an option from the dropdown.
Additional Info: Default lengths are SHORT=10, MID=28, LONG=50.
🔧 Custom Swing Length
🔧custom: Specify a custom swing length.
What it is: An integer input for setting a custom swing length.
What it does: Overrides the default swing lengths if set to CUSTOM.
How to use it: Enter a custom integer value (only shown when CUSTOM is selected).
📛 Show BBs
BB (Method)📛: Toggle the display of Breaker Blocks.
What it is: A boolean input to enable or disable the display of Breaker Blocks.
What it does: Shows or hides Breaker Blocks.
How to use it: Check or uncheck the box to enable or disable.
📛 OB End Method
OB End Method: Select the method for determining the end of a Breaker Block.
What it is: A dropdown to choose between Wick and Close.
What it does: Sets the criteria for when a Breaker Block is considered mitigated.
How to use it: Choose an option from the dropdown.
Additional Info: Wicks: OB is mitigated when the price wicks through the OB Level. Close: OB is mitigated when the closing price is within the OB Level.
🔍 Max Bullish Zones
🔍Max Bullish: Set the maximum number of Bullish Order Blocks to display.
What it is: A dropdown to select the maximum number of Bullish Order Blocks.
What it does: Limits the number of Bullish Order Blocks shown on the chart.
How to use it: Choose a value from the dropdown (1-10).
🔍 Max Bearish Zones
🔍Max Bearish: Set the maximum number of Bearish Order Blocks to display.
What it is: A dropdown to select the maximum number of Bearish Order Blocks.
What it does: Limits the number of Bearish Order Blocks shown on the chart.
How to use it: Choose a value from the dropdown (1-10).
🟩 Bullish OB Color
Bullish OB Color: Set the color for Bullish Order Blocks.
What it is: A color picker to set the color of Bullish Order Blocks.
What it does: Changes the color of Bullish Order Blocks on the chart.
How to use it: Select a color from the color picker.
🟥 Bearish OB Color
Bearish OB Color: Set the color for Bearish Order Blocks.
What it is: A color picker to set the color of Bearish Order Blocks.
What it does: Changes the color of Bearish Order Blocks on the chart.
How to use it: Select a color from the color picker.
🔧 OB & BB Range
↔ OB & BB Range: Select the range option for OB and BB.
What it is: A dropdown to choose between RANGE and CUSTOM.
What it does: Sets how far the OB or BB should extend.
How to use it: Choose an option from the dropdown.
Additional Info: RANGE = Current price, CUSTOM = Adjustable Range.
🔧 Custom OB & BB Range
🔧Custom: Specify a custom range for OB and BB.
What it is: An integer input for setting a custom range.
What it does: Defines how far the OB or BB should go, based on a custom value.
How to use it: Enter a custom integer value (range: 1000-500000).
💬 Text Options
💬Text Options: Set text size and color for OB and BB.
What it is: A dropdown to select text size and a color picker to choose text color.
What it does: Changes the size and color of the text displayed for OB and BB.
How to use it: Select a size from the dropdown and a color from the color picker.
💬 Show Timeframe OB
Text: Toggle to display the timeframe of OB.
What it is: A boolean input to show or hide the timeframe text for OB.
What it does: Displays the timeframe information for Order Blocks on the chart.
How to use it: Check or uncheck the box to enable or disable.
💬 Show Volume
Volume: Toggle to display the volume of OB.
What it is: A boolean input to show or hide the volume information for Order Blocks.
What it does: Displays the volume information for Order Blocks on the chart.
How to use it: Check or uncheck the box to enable or disable.
Additional Info:
What it represents: The volume displayed represents the total trading volume that occurred during the formation of the Order Block. This can indicate the level of participation or interest in that price level.
How it's calculated: The volume is the sum of all traded volumes within the candles that form the Order Block.
What it means: Higher volume at an Order Block level may suggest stronger support or resistance. It shows the amount of trading activity and can be an indicator of the potential strength or validity of the Order Block.
Why it's shown: To give traders an idea of the market participation and to help assess the strength of the Order Block.
💬 Show Percentage
%: Toggle to display the percentage of OB.
What it is: A boolean input to show or hide the percentage information for Order Blocks.
What it does: Displays the percentage information for Order Blocks on the chart.
How to use it: Check or uncheck the box to enable or disable.
Additional Info:
What it represents: The percentage displayed usually represents the proportion of price movement relative to the Order Block.
How it's calculated: This can be the percentage move from the start to the end of the Order Block or the retracement level that price has reached relative to the Order Block's range.
What it means: It helps traders understand the extent of price movement within the Order Block and can indicate the significance of the price level.
Why it's shown: To provide a clearer understanding of the price dynamics and the importance of the Order Block within the overall price movement.
Additional Information
Volume Example: If an Order Block forms over three candles with volumes of 100, 150, and 200, the total volume displayed for that Order Block would be 450.
Percentage Example: If the price moves from 100 to 110 within an Order Block, and the total range of the Order Block is from 100 to 120, the percentage shown might be 50% (since the price has moved halfway through the Order Block's range).
Liquidity Levels visuals:
📊 Liquidity Levels Input Settings
📊 Current Timeframe
TF #1🕑: Enable or disable the current timeframe.
What it is: A boolean input to toggle the use of the current timeframe.
What it does: Enables or disables the display of liquidity levels for the current timeframe.
How to use it: Check or uncheck the box to enable or disable.
📊 Higher Timeframe
Higher Timeframe: Select the higher timeframe for liquidity levels.
What it is: A dropdown to select the desired higher timeframe.
What it does: Sets the higher timeframe for liquidity levels.
How to use it: Choose a timeframe from the dropdown list.
📏 Liquidity Length Option
📏Liquidity Length: Select the length for liquidity levels.
What it is: A dropdown to choose between SHORT, MID, LONG, or CUSTOM.
What it does: Sets the length of swings for liquidity levels.
How to use it: Choose an option from the dropdown.
Additional Info: Default lengths are SHORT=10, MID=28, LONG=50.
🔧 Custom Liquidity Length
🔧custom: Specify a custom length for liquidity levels.
What it is: An integer input for setting a custom swing length.
What it does: Overrides the default liquidity lengths if set to CUSTOM.
How to use it: Enter a custom integer value (only shown when CUSTOM is selected).
📛 Mitigation Method
📛Mitigation (Method): Select the method for determining the mitigation of liquidity levels.
What it is: A dropdown to choose between Close and Wick.
What it does: Sets the criteria for when a liquidity level is considered mitigated.
How to use it: Choose an option from the dropdown.
Additional Info:
Wick: Level is mitigated when the price wicks through the level.
Close: Level is mitigated when the closing price is within the level.
📛 Display Mitigated Levels
-: Select to display or hide mitigated levels.
What it is: A dropdown to choose between Remove and Show.
What it does: Displays or hides mitigated liquidity levels.
How to use it: Choose an option from the dropdown.
Additional Info:
Remove: Hide mitigated levels.
Show: Display mitigated levels.
🔍 Max Buy Side Liquidity
🔍Max Buy Side Liquidity: Set the maximum number of Buy Side Liquidity Levels to display.
What it is: An integer input to set the maximum number of Buy Side Liquidity Levels.
What it does: Limits the number of Buy Side Liquidity Levels shown on the chart.
How to use it: Enter a value between 0 and 50.
🟦 Buy Side Liquidity Color
Buy Side Liquidity Color: Set the color for Buy Side Liquidity Levels.
What it is: A color picker to set the color of Buy Side Liquidity Levels.
What it does: Changes the color of Buy Side Liquidity Levels on the chart.
How to use it: Select a color from the color picker.
Additional Info:
Tooltip: Set the maximum number of Buy Side Liquidity Levels to display. Default: 5, Min: 1, Max: 50.
If liquidity levels are not displayed as expected, try increasing the max count.
🔍 Max Sell Side Liquidity
🔍Max Sell Side Liquidity: Set the maximum number of Sell Side Liquidity Levels to display.
What it is: An integer input to set the maximum number of Sell Side Liquidity Levels.
What it does: Limits the number of Sell Side Liquidity Levels shown on the chart.
How to use it: Enter a value between 0 and 50.
🟥 Sell Side Liquidity Color
Sell Side Liquidity Color: Set the color for Sell Side Liquidity Levels.
What it is: A color picker to set the color of Sell Side Liquidity Levels.
What it does: Changes the color of Sell Side Liquidity Levels on the chart.
How to use it: Select a color from the color picker.
Additional Info:
Tooltip: Set the maximum number of Sell Side Liquidity Levels to display. Default: 5, Min: 1, Max: 50.
If liquidity levels are not displayed as expected, try increasing the max count.
✂ Box Style (Height)
✂ Box Style (↕): Set the box height style for liquidity levels.
What it is: A float input to set the height of the boxes.
What it does: Adjusts the height of the boxes displaying liquidity levels.
How to use it: Enter a value between -50 and 50.
Additional Info: Default value is -5.
📏 Box Length
b: Set the box length of liquidity levels.
What it is: An integer input to set the length of the boxes.
What it does: Adjusts the length of the boxes displaying liquidity levels.
How to use it: Enter a value between 0 and 500.
Additional Info: Default value is 20.
⏭ Extend Liquidity Levels
Extend ⏭: Toggle to extend liquidity levels beyond the current range.
What it is: A boolean input to enable or disable the extension of liquidity levels.
What it does: Extends liquidity levels beyond their default range.
How to use it: Check or uncheck the box to enable or disable.
Additional Info: Extend liquidity levels beyond the current range.
💬 Text Options
💬 Text Options: Set text size and color for liquidity levels.
What it is: A dropdown to select text size and a color picker to choose text color.
What it does: Changes the size and color of the text displayed for liquidity levels.
How to use it: Select a size from the dropdown and a color from the color picker.
💬 Show Text
Text: Toggle to display text for liquidity levels.
What it is: A boolean input to show or hide the text for liquidity levels.
What it does: Displays the text information for liquidity levels on the chart.
How to use it: Check or uncheck the box to enable or disable.
💬 Show Volume
Volume: Toggle to display the volume of liquidity levels.
What it is: A boolean input to show or hide the volume information for liquidity levels.
What it does: Displays the volume information for liquidity levels on the chart.
How to use it: Check or uncheck the box to enable or disable.
Additional Info:
What it represents: The volume displayed represents the total trading volume that occurred during the formation of the liquidity level. This can indicate the level of participation or interest in that price level.
How it's calculated: The volume is the sum of all traded volumes within the candles that form the liquidity level.
What it means: Higher volume at a liquidity level may suggest stronger support or resistance. It shows the amount of trading activity and can be an indicator of the potential strength or validity of the liquidity level.
Why it's shown: To give traders an idea of the market participation and to help assess the strength of the liquidity level.
💬 Show Percentage
%: Toggle to display the percentage of liquidity levels.
What it is: A boolean input to show or hide the percentage information for liquidity levels.
What it does: Displays the percentage information for liquidity levels on the chart.
How to use it: Check or uncheck the box to enable or disable.
Additional Info:
What it represents: The percentage displayed usually represents the proportion of price movement relative to the liquidity level.
How it's calculated: This can be the percentage move from the start to the end of the liquidity level or the retracement level that price has reached relative to the liquidity level's range.
What it means: It helps traders understand the extent of price movement within the liquidity level and can indicate the significance of the price level.
Why it's shown: To provide a clearer understanding of the price dynamics and the importance of the liquidity level within the overall price movement.
Fair Value Gaps visuals:
📊 Fair Value Gaps Input Settings
📊 Show FVG
TF #1🕑: Enable or disable Fair Value Gaps for Timeframe 1.
What it is: A boolean input to toggle the display of Fair Value Gaps.
What it does: Shows or hides Fair Value Gaps on the chart.
How to use it: Check or uncheck the box to enable or disable.
📊 Select Timeframe
Timeframe: Select the timeframe for Fair Value Gaps.
What it is: A dropdown to select the desired timeframe.
What it does: Sets the timeframe for Fair Value Gaps.
How to use it: Choose a timeframe from the dropdown list.
Additional Info: Higher TF Chart & Lower TF Setting or Lower TF Chart & Higher TF Setting.
📛 FVG Break Method
📛FVG Break (Method): Select the method for determining when an FVG is mitigated.
What it is: A dropdown to choose between Touch, Wicks, Close, or Average.
What it does: Sets the criteria for when a Fair Value Gap is considered mitigated.
How to use it: Choose an option from the dropdown.
Additional Info:
Touch: FVG is mitigated when the price touches the gap.
Wicks: FVG is mitigated when the price wicks through the gap.
Close: FVG is mitigated when the closing price is within the gap.
Average: FVG is mitigated when the average price (average of high and low) is within the gap.
📛 Show Mitigated FVG
show: Toggle to display mitigated FVGs.
What it is: A boolean input to show or hide mitigated Fair Value Gaps.
What it does: Displays or hides mitigated Fair Value Gaps.
How to use it: Check or uncheck the box to enable or disable.
📛 Fill FVG
Fill: Toggle to fill Fair Value Gaps.
What it is: A boolean input to fill the Fair Value Gaps with color.
What it does: Adds a color fill to the Fair Value Gaps.
How to use it: Check or uncheck the box to enable or disable.
📛 Shade FVG
Shade: Toggle to shade Fair Value Gaps.
What it is: A boolean input to shade the Fair Value Gaps.
What it does: Adds a shade effect to the Fair Value Gaps.
How to use it: Check or uncheck the box to enable or disable.
Additional Info: Select the method to break FVGs and toggle the visibility of FVG Breaks (fill FVG and/or shade FVG).
🔍 Max Bullish FVG
🔍Max Bullish FVG: Set the maximum number of Bullish Fair Value Gaps to display.
What it is: An integer input to set the maximum number of Bullish Fair Value Gaps.
What it does: Limits the number of Bullish Fair Value Gaps shown on the chart.
How to use it: Enter a value between 0 and 50.
🔍 Max Bearish FVG
🔍Max Bearish FVG: Set the maximum number of Bearish Fair Value Gaps to display.
What it is: An integer input to set the maximum number of Bearish Fair Value Gaps.
What it does: Limits the number of Bearish Fair Value Gaps shown on the chart.
How to use it: Enter a value between 0 and 50.
🟥 Bearish FVG Color
Bearish FVG Color: Set the color for Bearish Fair Value Gaps.
What it is: A color picker to set the color of Bearish Fair Value Gaps.
What it does: Changes the color of Bearish Fair Value Gaps on the chart.
How to use it: Select a color from the color picker.
Additional Info:
Tooltip: Set the maximum number of Bearish Fair Value Gaps to display. Default: 5, Min: 1, Max: 50.
If Fair Value Gaps are not displayed as expected, try increasing the max count.
🟦 Bullish FVG Color
Bullish FVG Color: Set the color for Bullish Fair Value Gaps.
What it is: A color picker to set the color of Bullish Fair Value Gaps.
What it does: Changes the color of Bullish Fair Value Gaps on the chart.
How to use it: Select a color from the color picker.
Additional Info:
Tooltip: Set the maximum number of Bullish Fair Value Gaps to display. Default: 5, Min: 1, Max: 50.
If Fair Value Gaps are not displayed as expected, try increasing the max count.
📏 FVG Range
↔ FVG Range: Set the range for Fair Value Gaps.
What it is: An integer input to set the range of the Fair Value Gaps.
What it does: Adjusts the range of the Fair Value Gaps displayed.
How to use it: Enter a value between 0 and 100.
Additional Info: Adjustable length only works when both RANGE & EXTEND display OFF. Range=current price, Extend=Full Range.
⏭ Extend FVG
Extend⏭: Toggle to extend Fair Value Gaps beyond the current range.
What it is: A boolean input to enable or disable the extension of Fair Value Gaps.
What it does: Extends Fair Value Gaps beyond their default range.
How to use it: Check or uncheck the box to enable or disable.
⏯ FVG Range
Range⏯: Toggle the range of Fair Value Gaps.
What it is: A boolean input to enable or disable the range display for Fair Value Gaps.
What it does: Sets the range of Fair Value Gaps displayed.
How to use it: Check or uncheck the box to enable or disable.
↕ Max Width
↕ Max Width: Set the maximum width of Fair Value Gaps.
What it is: A float input to set the maximum width of Fair Value Gaps.
What it does: Limits the width of Fair Value Gaps as a percentage of the price range.
How to use it: Enter a value between 0 and 5.0.
Additional Info: FVGs wider than this value will be ignored.
♻ Filter FVG
Filter FVG ♻: Toggle to filter out small Fair Value Gaps.
What it is: A boolean input to filter out small Fair Value Gaps.
What it does: Ignores Fair Value Gaps smaller than the specified max width.
How to use it: Check or uncheck the box to enable or disable.
➖ Mid Line Style
➖Mid Line Style: Select the style of the mid line for Fair Value Gaps.
What it is: A dropdown to choose between Solid, Dashed, or Dotted.
What it does: Sets the style of the mid line within Fair Value Gaps.
How to use it: Choose an option from the dropdown.
🎨 Mid Line Color
Mid Line Color: Set the color for the mid line within Fair Value Gaps.
What it is: A color picker to set the color of the mid line.
What it does: Changes the color of the mid line within Fair Value Gaps.
How to use it: Select a color from the color picker.
Additional Information
Mitigation Methods: Each method (Touch, Wicks, Close, Average) provides different criteria for when a Fair Value Gap is considered mitigated, helping traders to understand the dynamics of price movements within gaps.
Volume and Percentage: Displaying volume and percentage information for Fair Value Gaps helps traders gauge the strength and significance of these gaps in relation to trading activity and price movements.
Trendlines visuals:
📊 Trendlines Input Settings
📊 Show Trendlines
Trendlines & Trendlines Difference(%) ↕: Enable or disable trendlines and set the percentage difference from the first trendline.
What it is: A boolean input to toggle the display of trendlines.
What it does: Shows or hides trendlines on the chart and allows setting a percentage difference from the first trendline.
How to use it: Check or uncheck the box to enable or disable.
Additional Info: The percentage difference determines the distance of the second trendline from the first one.
📏 Trendline Length Option
📏Trendline Length: Select the length for trendlines.
What it is: A dropdown to choose between SHORT, MID, LONG, or CUSTOM.
What it does: Sets the length of trendlines.
How to use it: Choose an option from the dropdown.
Additional Info: Default lengths are SHORT=50, MID=100, LONG=200.
🔧 Custom Trendline Length
🔧custom: Specify a custom length for trendlines.
What it is: An integer input for setting a custom trendline length.
What it does: Overrides the default trendline lengths if set to CUSTOM.
How to use it: Enter a custom integer value (only shown when CUSTOM is selected).
🔍 Max Bearish Trendlines
🔍Max Trendlines Bearish: Set the maximum number of bearish trendlines to display.
What it is: A dropdown to select the maximum number of bearish trendlines.
What it does: Limits the number of bearish trendlines shown on the chart.
How to use it: Choose a value from the dropdown (2-20).
🟩 Bearish Trendline Color
Bearish Trendline Color: Set the color for bearish trendlines.
What it is: A color picker to set the color of bearish trendlines.
What it does: Changes the color of bearish trendlines on the chart.
How to use it: Select a color from the color picker.
Additional Info: Adjust to control how many bearish trendlines are displayed.
🔍 Max Bullish Trendlines
🔍Max Trendlines Bullish: Set the maximum number of bullish trendlines to display.
What it is: A dropdown to select the maximum number of bullish trendlines.
What it does: Limits the number of bullish trendlines shown on the chart.
How to use it: Choose a value from the dropdown (2-20).
🟥 Bullish Trendline Color
Bullish Trendline Color: Set the color for bullish trendlines.
What it is: A color picker to set the color of bullish trendlines.
What it does: Changes the color of bullish trendlines on the chart.
How to use it: Select a color from the color picker.
Additional Info: Adjust to control how many bullish trendlines are displayed.
📐 Degrees Text
📐Degrees ° (💬 Size): Enable or disable degrees text and set its size and color.
What it is: A boolean input to show or hide the degrees text for trendlines.
What it does: Displays the degrees text for trendlines.
How to use it: Check or uncheck the box to enable or disable.
📏 Text Size for Degrees
Text Size: Set the text size for degrees on trendlines.
What it is: A dropdown to select the size of the degrees text.
What it does: Changes the size of the degrees text displayed for trendlines.
How to use it: Choose a size from the dropdown (XS, S, M, L, XL).
🎨 Degrees Text Color
Degrees Text Color: Set the color for the degrees text on trendlines.
What it is: A color picker to set the color of the degrees text.
What it does: Changes the color of the degrees text on the chart.
How to use it: Select a color from the color picker.
♻ Filter Degrees
♻ Filter Degrees °: Enable or disable angle filtering and set the angle range.
What it is: A boolean input to filter trendlines by their angle.
What it does: Shows only trendlines within a specified angle range.
How to use it: Check or uncheck the box to enable or disable.
Additional Info: Angles outside this range will be filtered out.
🔢 Angle Range
Angle Range: Set the angle range for filtering trendlines.
What it is: Two float inputs to set the minimum and maximum angle for trendlines.
What it does: Defines the range of angles for which trendlines will be shown.
How to use it: Enter values for the minimum and maximum angles.
➖ Line Style
➖Style #1 & #2: Select the style of the primary and secondary trendlines.
What it is: Two dropdowns to choose between Solid, Dashed, or Dotted for the trendlines.
What it does: Sets the style of the primary and secondary trendlines.
How to use it: Choose a style from each dropdown.
📏 Line Thickness
: Set the thickness for the trendlines.
What it is: An integer input to set the thickness of the trendlines.
What it does: Adjusts the thickness of the trendlines displayed on the chart.
How to use it: Enter a value between 1 and 5.
Additional Information
Trendline Percentage Difference: Setting a percentage difference helps in analyzing the relative position and angle of trendlines.
Filtering by Angle: This feature allows focusing on trendlines within a specific angle range, enhancing the clarity of trend analysis.
BOS & CHOCH Market Structure visuals:
📊 BOS & CHOCH Market Structure Input Settings
📏 Market Structure Length Option
📏Market Structure: Select the market structure length option.
What it is: A dropdown to choose between INTERNAL, EXTERNAL, ALL, CUSTOM, or NONE.
What it does: Sets the type of market structure to be displayed.
How to use it: Choose an option from the dropdown.
Additional Info:
INTERNAL: Only internal structure.
EXTERNAL: Only external structure.
ALL: Both internal and external structures.
CUSTOM: Custom lengths.
NONE: No structure.
🔧 Custom Internal Length
🔧Custom Internal: Specify a custom length for internal market structure.
What it is: An integer input for setting a custom internal length.
What it does: Defines the length of internal market structures if CUSTOM is selected.
How to use it: Enter a custom integer value (only shown when CUSTOM is selected).
💬 Internal Label Size
💬Internal Label Size: Set the label size for internal market structures.
What it is: A dropdown to select the size of the labels.
What it does: Changes the size of the labels for internal market structures.
How to use it: Choose a size from the dropdown (XS, S, M, L, XL).
🟩 Internal Bullish Color
Internal Bullish Color: Set the color for bullish internal market structures.
What it is: A color picker to set the color of bullish internal market structures.
What it does: Changes the color of bullish internal market structures on the chart.
How to use it: Select a color from the color picker.
🟥 Internal Bearish Color
Internal Bearish Color: Set the color for bearish internal market structures.
What it is: A color picker to set the color of bearish internal market structures.
What it does: Changes the color of bearish internal market structures on the chart.
How to use it: Select a color from the color picker.
🔧 Custom External Length
🔧Custom External: Specify a custom length for external market structure.
What it is: An integer input for setting a custom external length.
What it does: Defines the length of external market structures if CUSTOM is selected.
How to use it: Enter a custom integer value (only shown when CUSTOM is selected).
💬 External Label Size
💬External Label Size: Set the label size for external market structures.
What it is: A dropdown to select the size of the labels.
What it does: Changes the size of the labels for external market structures.
How to use it: Choose a size from the dropdown (XS, S, M, L, XL).
🟩 External Bullish Color
External Bullish Color: Set the color for bullish external market structures.
What it is: A color picker to set the color of bullish external market structures.
What it does: Changes the color of bullish external market structures on the chart.
How to use it: Select a color from the color picker.
🟥 External Bearish Color
External Bearish Color: Set the color for bearish external market structures.
What it is: A color picker to set the color of bearish external market structures.
What it does: Changes the color of bearish external market structures on the chart.
How to use it: Select a color from the color picker.
📐 Show Equal Highs and Lows
EQL & EQH📐: Toggle visibility for equal highs and lows.
What it is: A boolean input to show or hide equal highs and lows.
What it does: Displays or hides equal highs and lows on the chart.
How to use it: Check or uncheck the box to enable or disable.
📏 Equal Highs and Lows Threshold
Equal Highs and Lows Threshold: Set the threshold for equal highs and lows.
What it is: A float input to set the threshold for equal highs and lows.
What it does: Defines the range within which highs and lows are considered equal.
How to use it: Enter a value between 0 and 10.
💬 Label Size for Equal Highs and Lows
💬Label Size for Equal Highs and Lows: Set the label size for equal highs and lows.
What it is: A dropdown to select the size of the labels.
What it does: Changes the size of the labels for equal highs and lows.
How to use it: Choose a size from the dropdown (XS, S, M, L, XL).
🟩 Bullish Color for Equal Highs and Lows
Bullish Color for Equal Highs and Lows: Set the color for bullish equal highs and lows.
What it is: A color picker to set the color of bullish equal highs and lows.
What it does: Changes the color of bullish equal highs and lows on the chart.
How to use it: Select a color from the color picker.
🟥 Bearish Color for Equal Highs and Lows
Bearish Color for Equal Highs and Lows: Set the color for bearish equal highs and lows.
What it is: A color picker to set the color of bearish equal highs and lows.
What it does: Changes the color of bearish equal highs and lows on the chart.
How to use it: Select a color from the color picker.
📏 Show Swing Points
Swing Points📏: Toggle visibility for swing points.
What it is: A boolean input to show or hide swing points.
What it does: Displays or hides swing points on the chart.
How to use it: Check or uncheck the box to enable or disable.
📏 Swing Points Length Option
Swing Points Length Option: Select the length for swing points.
What it is: A dropdown to choose between SHORT, MID, LONG, or CUSTOM.
What it does: Sets the length of swing points.
How to use it: Choose an option from the dropdown.
Additional Info: Default lengths are SHORT=10, MID=28, LONG=50.
💬 Swing Points Label Size
💬Swing Points Label Size: Set the label size for swing points.
What it is: A dropdown to select the size of the labels.
What it does: Changes the size of the labels for swing points.
How to use it: Choose a size from the dropdown (XS, S, M, L, XL).
🎨 Swing Points Color
Swing Points Color: Set the color for swing points.
What it is: A color picker to set the color of swing points.
What it does: Changes the color of swing points on the chart.
How to use it: Select a color from the color picker.
🔧 Custom Swing Points Length
🔧Custom Swings: Specify a custom length for swing points.
What it is: An integer input for setting a custom length for swing points.
What it does: Defines the length of swing points if CUSTOM is selected.
How to use it: Enter a custom integer value (only shown when CUSTOM is selected).
Additional Information
Market Structure Types: Understanding internal and external structures helps in analyzing different market behaviors.
Equal Highs and Lows: This feature identifies areas where price action is balanced, which can be significant for trading strategies.
Swing Points: Highlighting swing points aids in recognizing significant market reversals or continuations.
Benefits
Enhance your trading strategy by visualizing smart money's influence on price movements.
Make informed decisions with real-time data on significant market structures.
Reduce manual analysis with automated detection of key trading signals.
Ideal For
Traders looking for an edge in forex, equities, and cryptocurrency markets by understanding the underlying forces driving market dynamics.
Acknowledgements
Special thanks to these amazing creators for inspiration and their creations:
I want to thank these amazing creators for creating there amazing indicators , that inspired me and also gave me a head start by making this indicator! Without their amazing indicators it wouldn't be possible!
Flux Charts: Volumized Order Blocks
LuxAlgo: Trend Lines
UAlgo: Fair Value Gaps (FVG)
By Leviathan: Market Structure
Sonarlab: Liquidity Levels
Note
Remember to always backtest the indicator first before integrating it into your strategy! For any questions about the indicator, please feel free to ask for assistance.

AQPRO Block Force
📝 INTRODUCTION
AQPRO Block Force is a powerful trading tool designed to identify and track Orderblocks (OBs) in real-time based on Fair Value Gap (FVG) principles. This indicator employs quite strict yet effective FVG filtering criteria to ensure only significant OBs are displayed, avoiding minor inefficiencies or duplicates within the same impulse or corrective moves. Each OB adapts dynamically to price action and can be categorized as Classic, Strong, or Extreme, based on proprietary conditions and best ideas from SMC (Smart Money Concepts).
In addition to plotting Orderblocks, the indicator offers useful filtering systems like an Age Filter to ensure cleanliness of the OB data on the chart and prevent old, irrelevant OBs from obstructing the chart. Users can also enable MTF (Multi-Timeframe) functionality to view OBs from other timeframes, providing a comprehensive analysis across multiple levels of market structure. With extensive customization options, AQPRO Block Force allows traders to tailor the visuals and behavior to fit their specific trading preferences.
This indicator does not parse any instituotinal data, order books and other fancy financial sources for finding order blocks nor it uses them for confirmation purposes. Calculations algorithms of order blocks are based purely on current asset's price history.
IMPORTANT NOTE: in the sections below term 'quality' will be applied to orderblocks quite a number of times. By 'quality' in the context of orderblocks we mean the reaction of price upon the sweep of orderblock. Basically, if the price reverses after reaching the orderblock, this orderblock is considered to be of high quality. Definition for low -quality orderblock can be deducted by analogy.
🎯 PURPOSE OF USAGE
This indicator serves one and only purpose — help traders identify most lucrative institutional orderblocks on the chart in real time. Even though event of price reaching an orderblock cannot be considered as a sole signal in many trading strategies without proper confirmation, such event nevertheless is quite important in SMC-based trading, because when price sweeps OB it usually means, that a reversal will soon follow, but, of course, this is not the case every time.
Traders should not expect from this indicator detection of perfect orderblocks, which would surely revese the price on encounter, but they can expect is a time-proven algorithm of determing orderblocks that on average produces more high-quality orderblocks than simple similar tools from open-source libraries.
More in-depth advices on the usage will be given in the sections below, but for now let's summarise subgoals of the indicator:
Detecting orderblocks filtered through strict FVG validation rules to improve overall quality of orderblocks;
Classifying orderblocks as Classic, Strong, or Extreme based on wether or not classic orderblocks pass filtering conditions, which are based on crossing critical price levels and SMC principles like ChoCh (Change of Character);
Eliminating clutter and manage chart space with the Age Filter, removing old OBs outside a user-defined age range;
Utilizing MTF functionality to track significant OBs from other timeframes alongside current timeframe analysis;
Providing traders with customization options for indicator's visuals to help them organize information on the chart in a clean way.
⚙️ SETTINGS OVERVIEW
This indicator's customization options allow you to fully control its functionality and visuals. Below is a breakdown of the settings grouped by the exact setting sections and parameters from the indicator:
🔑 Main Settings
Show OBs from current timeframe — toggles the display of OBs from the current timeframe on the chart;
Show classic OBs — enables or disables the display of Classic OBs;
Show strong OBs — enables or disables the display of Strong OBs, which meet the ChoCh-based filter criteria;
Show extreme OBs — enables or disables the display of Extreme OBs, which exceed proprietary price level risk thresholds.
⏳ Filter: Age
Use Age Filter — toggles the Age Filter, which removes old OBs based on their age;
Max Age — sets the maximum age of OBs to be displayed (in bars). OBs older than this value will be hidden;
Min Age — sets the minimum age of OBs to be displayed (in bars). OBs younger than this value will not be shown.
🌋 MTF Settings
Show MTF OBs — toggles the display of OBs from higher timeframes;
Timeframe — select the timeframe to use for MTF OB detection (e.g., 15m, 1h).
⏳ MTF / Filter: Age
Use Age Filter (MTF) — toggles the Age Filter for MTF OBs;
Max Age — sets the maximum age of MTF OBs to be displayed (in bars);
Min Age — sets the minimum age of MTF OBs to be displayed (in bars).
🎨 Visual Settings
Classic OB (Bullish) — sets the color for bullish Classic OBs;
Classic OB (Bearish) — sets the color for bearish Classic OBs;
Strong OB (Bullish) — sets the color for bullish Strong OBs;
Strong OB (Bearish) — sets the color for bearish Strong OBs;
Extreme OB (Bullish) — sets the color for bullish Extreme OBs;
Extreme OB (Bearish) — sets the color for bearish Extreme OBs.
📈 APPLICATION GUIDE
Application methodology of this indicator is pretty much the same as with any other indicator, whose purpose is to find and display orderblocks on the chart. However, before actually diving into the guide on application, we want to make a small step back to remind traders of the history of orderblocks as a concept, its limitations and benefits.
Orderblocks themselves are essentially just zones of potential institutional interest, which if reached are expected to reverse the price in the opposite direction. 'Potential' is a suitable remark for indicator's success probability, because, as was mentioned above, orderblocks don't guarantee price reversal regardless of quality of the indicator. This is the case for the simplest of reasons — orderblocks are based solely on price history and thus are to be considered a mathematical model , degree of success of which is never 100%, because all mathematical models abide by a "golden rule of trading" : past performance doesn't guarantee future results.
However, the extensive history of orderblocks clearly shows that this tool, despite being decades old, can still help traders produce market insights and improve any strategy's performance. Orderblocks can be used both as a primary source of signals and as confirmation tool, but from our experience they are better to be used as confirmation tool. Our indicator is not an exception in this matter and we advice any trader to use it mainly for confirmation purposes, because use-case of orderblocks as confirmation tools have much success stories on average than being used as primary signal source.
This being said, let's return to the application guide and start reviewing the indicator from the most basic step — how it will look like when you first load it on your chart:
This indicator consisis of 3 main logic blocks:
Orderblock evaluation;
MTF Orderblock evaluation;
Orderblock post-filtering.
The principles behind these logic blocks will be easy to understand for truly experiences traders, but we understand the need to explain them to a wider audience, so let's review each of these logic blocks below.
ORDERBLOCK EVALUATION
Principles behind our orderblock detection logic are as follows:
Find FVG (Fair Value Gap) .
Note: this indicator uses only three-candle FVGs and doesn't track FVGs with insidebars after third (farther) candle.
If you don't know what FVG means, we recommend researching this term in the Internet, but the basic explanation is this: FVG is the formation of candles, which are positioned in a way that there are an unclosed price area between 1st and 3rd candle.
Conditions:
bullish FVG = high of 3rd candle < low of 1st candle AND high of 3rd candle < close of 2nd candle AND high of 2nd candle < close of 1st candle AND low of 3rd candle < low of 2nd candle ;
bearish FVG = low of 3rd candle < high of 1st candle AND low of 3rd candle > close of 2nd candle AND low of 2nd candle > close of 1st candle AND high of 3rd candle > high of 2nd candle .
See visual showcase of valid & invalid bullish & bearish FVGs on the screenshot below:
As was shown on the screenshot above, the only correc t formation for FVGs are considered to be just like on pictures 1 and 2 (leftmost column of patterns) . Only these formations will take part in further determenings orderblocks.
Send FVGs through filtering conditions.
This is the truly important part. Without properly filtering FVGs we would get huge clusters of FVGs on the chart and they will not make sense to be reviewed, because there will be just too much of them and their quality will be very questionable .
Even though there is a quite number of ways to filter FVGs, we decided to go with the ones we deem actually useful. For this indicator we chose two methods, that work in tandem — 1) base candle's inside bar condition and 2) single appearance on current impulse/correction line. Let's review these conditions below and start with looking at the examples of them on the screenshot below:
Examples of 1st & 2nd conditions are displayed on the left and right charts respectively.
The filtering logic in 1st and 2nd is quite connected and further explanation should help you understand it just enough to start trading with our indicator.
Let's start with explaining the term 'base candle' and logic behind it. Base candle candle be explained quite shortly: it is the latest candle on the chart, whose high or low broke previous base candle's high or low respectively. The first candle in the time series of price data is by default considered the base candle. If any new candle after base candle doesn't overtake base candle's high or low (meaning, that this candle is inside the range of base candle), such candle is called an "inside bar" .
Inside bar's term is important to understand, because FVGs, which appear inside the inside bars are usually quite useless, because price doesn't react from them, so orderblocks with such FVGs are also of bad quality as well. Clear depiction of inside bar was provided in the screenshot of conditions above on the left chart, so we won't waste time making another example.
However, this is not it. Base candle, inside bars and a few other types of bars are all a part of SMC ideas and in the world of SMC there is a special term, that hold the most important place and is considered the cornerstone of SMC methodology — impulse/correction lines (valid pullbacks) . The average definition of impulse/correction lines is quite hard to understand for an average trader, but we can summarise like this:
Impulse/correction line is a line, that starts at the beginning of the sequence of base candles, each new candle of which consistently updates previous base candle's respective high/low.
We won't go into description of this principle because it is outside of scope of this indicator, but you can research this topic in the Internet by keywords ' impulse correction trading ' or 'valid pullback principles trading '. The general idea of usage of impulse/correction lines in the context of this indicator is that each such lines 'holds' inside at least one FVG and we need to find exactly the first FVG, while leaving all other FVGs behind, because they to be of worse quality on average.
Basically, by using translating these terms into conditions from example above, we have achieved a simple yet powerful filtering system. system for FVGs, which allows us to work with orderblocks of much higher quality than average open-source indicators.
If FVG passed filters, evaluate its OB.
When FVG is confirmed, we can start the evaluation of its orderblock. The evaluation of orderblocks consists of several checkpoints: 1) is orderblock beyond current ChoCh* AND/OR 2) is orderblock from extreme price levels, calculated by our proprietary risk system. Let's review these checkpoints below.
* ChoCh (Change of Character, fundamental SMC idea) — price level, which if broken by close of price can potentially cause a revesal of the trend to direction opposite to the the previous one. To learn more about ChoCh please research the term on the Internet, because this indicator uses its standard definition and explaining of this term goes beyond the scope of this indicator.
To determine if orderblock is beyond current ChoCh levels, we need to first determine where these levels are on the chart. ChoCh levels of this indicator are calculated with a very lite approach, which is based on pivot points.
You can see basic demonstration of ChoCh levels in action on the screenshot below:
IMPORTANT NOTE: pivot period for pivots points inside our indicator is by default equal to 5 and cannot be changed in settings at the moment of publication.
On the screenshot above you can clearly see that ChoCh levels are essentially highest/lowest pivot point levels in between certain range of bars, where price doesn't update its extremum. You can see on there screenshot a new type of line — BoS (Break of Structure). BoS is almost the same thing as ChoCh, but with one change: it is a confirmation of price updating its extremum in the same direction as it was before, while ChoCh updates price extremum in the direction opposite to which it was before .
Why do these levels matter when evaluating the orderblocks? Orderblocks, which are located beyond current BoS/ChoCh levels, are of much higher quality on average than average orderblocks and they are called Strong Orderblocks .
On the chart such orderblocks are marked with 'Strong OB' label inside the body of an orderblock.
You can see the examples of Strong OBs on the screenshot below:
That was the explanation of the 1st orderblock evaluation criteria. Now let's talk about the 2nd one.
Our 2nd evaluation criteria for orderblocks is a test on whether or price is behind specific price level, which is calculated by our proprietary risk system, which is based on fundamental of statistics, such as 'standard deviation' and etc.
This criteria allows us to catch orderblocks, which are located at quite extreme price levels, and mark them on trader's chart explicitly. Orderblocks, which are above our custom price levels, are called Extreme Orderblocks an are marked with 'Extreme OB' label inside orderblock's body.
You can see the example of Extreme OB on the screenshot below:
That was the explanation of the 2nd evaluation criteria of the orderblock.
If an orderblock doesn't pass any of these two criterias, it is considered a classic orderblock. These orderblock are most common ones and have the lowest success rate among other types of orderblocks, listed above. Such orderblocks are marked with 'OB' label inside the orderblock's body.
You can see the examples of classic OB on the screenshot below:
This is it for orderblock evaluation logic. After doing all these steps, all orderblocks that we found are collected and displayed on the chart with their bodies and label marks.
What happens after the detection of the orderblocks?
All active orderblocks are being tracked in real time and their statuses are being updated as well (Strong orderblock can become Extreme orderblock and vice versa) . By an active orderblock we mean an orderblock, which wasn't swept by price's high or low. Bodies of active orderblocks are prolonged to the next candle on each new candle.
If an orderblock was swept, indicator will stop prolonging this orderblock and will mark it as swept on the chart with almost hollow body and dashed border line of the orderblock's body. Also swept orderblocks lose their name label, so you won't see any text in the orderblock after it was swept, but you will see its colour.
You can see the example of an active & swept orderblocks on the screenshot below:
This functionality helps distinguish active orderblocks from swept ones (inactive) and make more informed decisions.
MTF OB EVALUATION
Principles of MTF OBs evaluation are exactly the same as they are for current timeframe's OBs.
MTF OBs are displayed on the chart in same way as other OBs, but with one little change: to the right side of MTF OB's status will be postfix of the timeframe, from which this OB came from. Timeframe for MTF OBs can be chosen by user in the settings of the indicator.
MTF OBs also preserve their statuses (Strong, Extreme and Classic) when displayed on the current timeframe, so you won't stack of mistakenly marked MTF OBs as Extreme just because they are far away from the price.
You can see the example of MTF OBs on the screenshot below:
Also MTF OBs when swept lose only their name label, but the timeframe postfix will still be there, so you could distinguish MTF OBs from OBs of the current timeframe.
See the example of swept MTF OBs below:
Overall MTF orderblocks is a very useful to get a sense of where the higher timeframe liquidity reside and then adjust your strategy accordingly. Taking your trades from the place of high liquidity, like orderblocks, doesn't guarantee certain solid price reaction, but it definitely provides a trader with much a greater change of 1) catching a decent price move 2) not losing money white trading against institutional players.
As was stated above, we recommend using this tool as a confirmation system for your main trading strategy, because its usage as primary source of signals in the long-run is not viable, judging from historical backtest results and general public opinions of traders.
ORDERBLOCK POST-FILTERING
To enhance filtering capabilities of this indicator even further, we decided to add two filters, which would help reduce the amount of bad and untradeable orderblocks. These two filters are 1) age filter and 2) cancellation filter. Let's review both of them below.
Talking about the age filter , this filter was designed to help get rid of old orderblocks, which clutter the chart with visual noise and make it harder to find valueable orderblocks. This filter has to parameters: min age and max age . What does age mean in the context of an orderblock? It is the distance between OB's left border's bar and current bar. If this distance is between min age and max age values, such orderblock is considered valid and age filter passes it for further evaluation, but this distance is too short or too long, age filter deletes this orderblock from the chart.
You can the example of an orderblock which didn't pass age filter requirements and was deleted from the chart on the screenshot below:
It is important to mention that the missing orderblock from the right chart will be appear on the chart right when its age will exceed min age parameter of age filter.
The principle of work for max age parameter can be deducted by analogy: if the orderblock's age in bigger than max age value of age filter, this orderblock will be deleted from the chart .
For MTF OBs we decided to their own age filter, so that it won't abide by current timeframe's restrictions, because MTF OBs are usually much older than OB from current timeframe, so they would deleted a lot of time before they even appear on the chart, if they would abide by the age filter of current timeframe.
Default parameters of age filter are "max age = 500" and "min age = 0" . "Min age = 0" means that there is restrictions on the minimum age of orderblocks and they will appear on the chart as soon as the indicator validates them.
That was the explanation of the age filter.
Talking about the cancellation filter , this filter was intended to spot orderblocks which were extremely untradable and visually alert traders about them on the chart. In this indicator this filter works like this: for each orderblock cancellation filter creates a special price level and checks if it was broken by the close of price.
This special price level consists of the farthest border. of the orderblock ( top border for bearish OBs and bottom border for bullish OBs) and a certain threshold, which is added to the farthest border. This threshold is based on the current ATR value of the asset. This filter helps detect the orderblocks which should not be considered for trading, because price has already went too far beyond the liquidity of this orderblock.
Orderblocks, which are spotted by this filter, are marked with '❌' emoji on the price history.
You can see the example of an orderblock which was spotted by the cancellation filter in the screenshot below:
This filter is applied to both current timeframe and MTF timeframe and is NOT configurable in the settings.
🔔 ALERTS
This indicator employs alerts for an event when new signal occurs on the current timeframe or on MTF timeframe. While creating the alert below 'Condition' field choose 'any alert() function call'.
When this alert is triggered, it will generate this kind of message:
// Alerts for current timeframe
string msg_template = "EXCHANGE:ASSET, TIMEFRAME: BULLISH_OR_BEARISH OB at SWEPT_OB_BORDER_PRICE was reached."
string msg_example = "BINANCE:BTCUSDT, 15m: bearish OB at 170000.00 was reached."
// Alerts for MTF timeframe
string msg_template_mtf = "EXCHANGE:ASSET, TIMEFRAME: BULLISH_OR_BEARISH MTF OB at SWEPT_OB_BORDER_PRICE was reached."
string msg_example_mtf = "BINANCE:BTCUSDT, 15m: bearish MTF OB at 170000.00 was reached."
📌 NOTES
These OBs work on any timeframe, but we would advise to to use on higher timeframes, starting from at least 15m, because liquidity from higher timeframe tends to be much valuable when deciding which orderblock to take for a trade;
Use these OBs as a confirmation tool for your main strategy and refrain from using them as primary signal source. Traders, which use SMC-based strategies, will benefit from these orderblocks the most;
We recommend trading only with Strong and Extreme orderblocks, because they are proved to be of much greater quality than classic orderblocks and they work quite well in mid-term and long-term trading strategies. Classic orderblocs can be used for short-term trading strategies, but even in this case these OBs cannot be blindly trusted;
We strongly advise against take for a trading orderblocks, which were spotted by cancellation filter, because they are considered to be voided of liquidity;
Don't forget that you can toggle different types of OBs, MTF settings and visual settings in the settings of the indicator and fine-tune them to your liking.
🏁 AFTERWORD
AQPRO Block Force is an indicator which designed with idea of helping trading save time on automatically detecting valuable orderblocks on the chart, evaluate their strength and filter out bad orderblocks. These employ the best principles of SMC, including FVGs, valid pullbacks and etc. FVGs play the key role in validating the existence of a particular orderblock and work in tandem with valid pullback to determine the maximum amount of true FVGs even in the most cluttered impulse/correction moves of the price. Our filters — Age Filter and Cancellation Filter — enhance the quality of the orderblocks by allowing only the newest and liquid orderblocks to appear on the chart. Additional MTF functionality allow trader to see orderblocks from other timeframe, which can be chosen in the settings, and get a sense of where the global liquidity resides. This indicator will be a useful confirmation tool to any trading strategy, but the SMC traders will surely get the most benefits out of it.
ℹ️ If you have questions about this or any other our indicator, please leave it in the comments.

D3m4h GIFVGDescription
D3m4h GIFVG is an indicator designed to automatically detect market imbalances—often referred to as FVGs (Fair Value Gaps)—and potential pivot-based shifts in market structure. It offers a dynamic approach to visualizing supply/demand inefficiencies and pivot-based trend changes. Key features include:
1. Pivot-Based Bullish/Bearish Detection
The indicator identifies higher-high/lower-low pivot logic as well as “outside bar” pivots.
It tracks when the market transitions from bullish to bearish ranges, or vice versa, by using multiple checks:
Pivot low/high detection
Break-of-structure (when price crosses the last pivot)
Opposing FVG detection to confirm an intraday pivot shift
2. FVG (Fair Value Gap) Detection
The script automatically scans for bullish or bearish FVG conditions:
Bullish FVG: Candle at position (bar_index - 2) has a high below the current candle’s low.
Bearish FVG: Candle at position (bar_index - 2) has a low above the current candle’s high.
When it detects an FVG, it draws a box on the chart to highlight the price gap (yellow boxes by default).
3. Pivot Range FVG
If an FVG forms while the market is in a bullish pivot range, the script can paint a special “blue” FVG to underscore its significance. The same logic applies if a newly formed FVG appears in a bearish pivot range.
4. Filled Gap Cleanup
You can optionally hide standard FVG boxes once they’re filled. For example, if the candle’s body (or candle range) covers that gap, the box is removed to keep your chart clean.
5. Pivot-Range FVG “Raided” Cleanup
If the pivot-based FVG is later filled from the opposing direction, it turns green and can optionally remove itself after a set number of bars.
6. Informative Table
A small table on the chart optionally displays whether or not the pivot-based FVG has been “raided”. You can toggle this table on/off in the settings.
How It Works
1. Pivot Shifts
The script tracks the last pivot high/low using a combination of candle-based pivot detection and break-of-structure checks (when price crosses the last pivot in the opposite direction).
When a shift is detected, the pivot range ID increments—this helps the script know when to remove old pivot-based FVGs or draw new ones.
2. FVG Formation
Each new bar checks if a bullish or bearish FVG formed (comparing the high of bar two bars ago to the current low, or the low of bar two bars ago to the current high).
If one is found, a box is drawn to highlight the imbalance. Its color and extension depend on script settings.
3. Imbalance or Pivot FVG
Standard imbalance boxes appear in yellow.
If the new imbalance coincides with a bullish or bearish pivot range, a special “pivot imbalance” box in blue is drawn.
3. Hide Filled
If a newly formed candle’s body fully covers the FVG, the box is considered filled. If Hide Filled Gaps is enabled, the box is deleted once it’s covered.
4. Raid Status
For the pivot-based (blue) FVG, once price invalidates it from the opposite side, it changes color to green and gets removed after a user-defined number of bars.
How to Use
1. Look for FVGs
Observe yellow boxes to identify potential intraday imbalances. Watch for price returning to fill these zones.
If you see a “blue” box, it signifies a pivot-based FVG in line with a recognized shift in structure—arguably a higher-probability zone.
2. “Hide Filled Gaps”
Turn this on if you only want to see currently active or partially filled imbalances. The script cleans up old, fully covered boxes to keep your chart neat.
3. Pivot Shifts
Note the script’s internal pivot logic. Each new pivot re-defines bullish or bearish states. Use these states to gauge the short-term trend shifts.
4. Toggle the Table
You can show or hide the chart table by enabling/disabling “Show Table” from the inputs. This table indicates if the pivot-based “GIFVG” has been “raided” or not.
5. Extend Count
Adjust the extendCount in the code if you want FVG boxes to extend further or shorter in time.
Underlying Concepts
Fair Value Gaps
Market inefficiencies that occur when price jumps, leaving a “gap” from the candle 2 bars ago to the current candle. They can act like mini supply/demand zones where price may revisit for balance.
Pivot Ranges
The script tries to maintain an internal sense of whether the market is in a bullish or bearish pivot range. When it sees a contrary FVG or break-of-structure, it flips the pivot state.
Outside Bars
A candle that has both a higher high and a lower low than the previous bar. The script uses these to mark significant pivot shifts.
By combining pivot-based logic with FVG detection, the D3m4h GIFVG indicator helps highlight potential areas of liquidity or unfilled value. Traders can use these zones to plan entries/exits or to confirm short-term trend shifts.

lib_smcLibrary "lib_smc"
This is an adaptation of LuxAlgo's Smart Money Concepts indicator with numerous changes. Main changes include integration of object based plotting, plenty of performance improvements, live tracking of Order Blocks, integration of volume profiles to refine Order Blocks, and many more.
This is a library for developers, if you want this converted into a working strategy, let me know.
buffer(item, len, force_rotate)
Parameters:
item (float)
len (int)
force_rotate (bool)
buffer(item, len, force_rotate)
Parameters:
item (int)
len (int)
force_rotate (bool)
buffer(item, len, force_rotate)
Parameters:
item (Profile type from robbatt/lib_profile/32)
len (int)
force_rotate (bool)
swings(len)
INTERNAL: detect swing points (HH and LL) in given range
Parameters:
len (simple int) : range to check for new swing points
Returns: values are the price level where and if a new HH or LL was detected, else na
method init(this)
Namespace types: OrderBlockConfig
Parameters:
this (OrderBlockConfig)
method delete(this)
Namespace types: OrderBlock
Parameters:
this (OrderBlock)
method clear_broken(this, broken_buffer)
INTERNAL: delete internal order blocks box coordinates if top/bottom is broken
Namespace types: map
Parameters:
this (map)
broken_buffer (map)
Returns: any_bull_ob_broken, any_bear_ob_broken, broken signals are true if an according order block was broken/mitigated, broken contains the broken block(s)
create_ob(id, mode, start_t, start_i, top, end_t, end_i, bottom, break_price, early_confirmation_price, config, init_plot, force_overlay)
INTERNAL: set internal order block coordinates
Parameters:
id (int)
mode (int) : 1: bullish, -1 bearish block
start_t (int)
start_i (int)
top (float)
end_t (int)
end_i (int)
bottom (float)
break_price (float)
early_confirmation_price (float)
config (OrderBlockConfig)
init_plot (bool)
force_overlay (bool)
Returns: signals are true if an according order block was broken/mitigated
method align_to_profile(block, align_edge, align_break_price)
Namespace types: OrderBlock
Parameters:
block (OrderBlock)
align_edge (bool)
align_break_price (bool)
method create_profile(block, opens, tops, bottoms, closes, values, resolution, vah_pc, val_pc, args, init_calculated, init_plot, force_overlay)
Namespace types: OrderBlock
Parameters:
block (OrderBlock)
opens (array)
tops (array)
bottoms (array)
closes (array)
values (array)
resolution (int)
vah_pc (float)
val_pc (float)
args (ProfileArgs type from robbatt/lib_profile/32)
init_calculated (bool)
init_plot (bool)
force_overlay (bool)
method create_profile(block, resolution, vah_pc, val_pc, args, init_calculated, init_plot, force_overlay)
Namespace types: OrderBlock
Parameters:
block (OrderBlock)
resolution (int)
vah_pc (float)
val_pc (float)
args (ProfileArgs type from robbatt/lib_profile/32)
init_calculated (bool)
init_plot (bool)
force_overlay (bool)
track_obs(swing_len, hh, ll, top, btm, bull_bos_alert, bull_choch_alert, bear_bos_alert, bear_choch_alert, min_block_size, max_block_size, config_bull, config_bear, init_plot, force_overlay, enabled, extend_blocks, clear_broken_buffer_before, align_edge_to_value_area, align_break_price_to_poc, profile_args_bull, profile_args_bear, use_soft_confirm, soft_confirm_offset, use_retracements_with_FVG_out)
Parameters:
swing_len (int)
hh (float)
ll (float)
top (float)
btm (float)
bull_bos_alert (bool)
bull_choch_alert (bool)
bear_bos_alert (bool)
bear_choch_alert (bool)
min_block_size (float)
max_block_size (float)
config_bull (OrderBlockConfig)
config_bear (OrderBlockConfig)
init_plot (bool)
force_overlay (bool)
enabled (bool)
extend_blocks (simple bool)
clear_broken_buffer_before (simple bool)
align_edge_to_value_area (simple bool)
align_break_price_to_poc (simple bool)
profile_args_bull (ProfileArgs type from robbatt/lib_profile/32)
profile_args_bear (ProfileArgs type from robbatt/lib_profile/32)
use_soft_confirm (simple bool)
soft_confirm_offset (float)
use_retracements_with_FVG_out (simple bool)
method draw(this, config, extend_only)
Namespace types: OrderBlock
Parameters:
this (OrderBlock)
config (OrderBlockConfig)
extend_only (bool)
method draw(blocks, config)
INTERNAL: plot order blocks
Namespace types: array
Parameters:
blocks (array)
config (OrderBlockConfig)
method draw(blocks, config)
INTERNAL: plot order blocks
Namespace types: map
Parameters:
blocks (map)
config (OrderBlockConfig)
method cleanup(this, ob_bull, ob_bear)
removes all Profiles that are older than the latest OrderBlock from this profile buffer
Namespace types: array
Parameters:
this (array type from robbatt/lib_profile/32)
ob_bull (OrderBlock)
ob_bear (OrderBlock)
_plot_swing_points(mode, x, y, show_swing_points, linecolor_swings, keep_history, show_latest_swings_levels, trail_x, trail_y, trend)
INTERNAL: plot swing points
Parameters:
mode (int) : 1: bullish, -1 bearish block
x (int) : x-coordingate of swing point to plot (bar_index)
y (float) : y-coordingate of swing point to plot (price)
show_swing_points (bool) : switch to enable/disable plotting of swing point labels
linecolor_swings (color) : color for swing point labels and lates level lines
keep_history (bool) : weater to remove older swing point labels and only keep the most recent
show_latest_swings_levels (bool)
trail_x (int) : x-coordinate for latest swing point (bar_index)
trail_y (float) : y-coordinate for latest swing point (price)
trend (int) : the current trend 1: bullish, -1: bearish, to determine Strong/Weak Low/Highs
_pivot_lvl(mode, trend, hhll_x, hhll, super_hhll, filter_insignificant_internal_breaks)
INTERNAL: detect whether a structural level has been broken and if it was in trend direction (BoS) or against trend direction (ChoCh), also track the latest high and low swing points
Parameters:
mode (simple int) : detect 1: bullish, -1 bearish pivot points
trend (int) : current trend direction
hhll_x (int) : x-coordinate of newly detected hh/ll (bar_index)
hhll (float) : y-coordinate of newly detected hh/ll (price)
super_hhll (float) : level/y-coordinate of superior hhll (if this is an internal structure pivot level)
filter_insignificant_internal_breaks (bool) : if true pivot points / internal structure will be ignored where the wick in trend direction is longer than the opposite (likely to push further in direction of main trend)
Returns: coordinates of internal structure that has been broken (x,y): start of structure, (trail_x, trail_y): tracking hh/ll after structure break, (bos_alert, choch_alert): signal whether a structural level has been broken
_plot_structure(x, y, is_bos, is_choch, line_color, line_style, label_style, label_size, keep_history)
INTERNAL: plot structural breaks (BoS/ChoCh)
Parameters:
x (int) : x-coordinate of newly broken structure (bar_index)
y (float) : y-coordinate of newly broken structure (price)
is_bos (bool) : whether this structural break was in trend direction
is_choch (bool) : whether this structural break was against trend direction
line_color (color) : color for the line connecting the structural level and the breaking candle
line_style (string) : style (line.style_dashed/solid) for the line connecting the structural level and the breaking candle
label_style (string) : style (label.style_label_down/up) for the label above/below the line connecting the structural level and the breaking candle
label_size (string) : size (size.small/tiny) for the label above/below the line connecting the structural level and the breaking candle
keep_history (bool) : weater to remove older swing point labels and only keep the most recent
structure_values(length, super_hh, super_ll, filter_insignificant_internal_breaks)
detect (and plot) structural breaks and the resulting new trend
Parameters:
length (simple int) : lookback period for swing point detection
super_hh (float) : level/y-coordinate of superior hh (for internal structure detection)
super_ll (float) : level/y-coordinate of superior ll (for internal structure detection)
filter_insignificant_internal_breaks (bool) : if true pivot points / internal structure will be ignored where the wick in trend direction is longer than the opposite (likely to push further in direction of main trend)
Returns: trend: direction 1:bullish -1:bearish, (bull_bos_alert, bull_choch_alert, top_x, top_y, trail_up_x, trail_up): whether and which level broke in a bullish direction, trailing high, (bbear_bos_alert, bear_choch_alert, tm_x, btm_y, trail_dn_x, trail_dn): same in bearish direction
structure_plot(trend, bull_bos_alert, bull_choch_alert, top_x, top_y, trail_up_x, trail_up, hh, bear_bos_alert, bear_choch_alert, btm_x, btm_y, trail_dn_x, trail_dn, ll, color_bull, color_bear, show_swing_points, show_latest_swings_levels, show_bos, show_choch, line_style, label_size, keep_history)
detect (and plot) structural breaks and the resulting new trend
Parameters:
trend (int) : crrent trend 1: bullish, -1: bearish
bull_bos_alert (bool) : if there was a bullish bos alert -> plot it
bull_choch_alert (bool) : if there was a bullish choch alert -> plot it
top_x (int) : latest shwing high x
top_y (float) : latest swing high y
trail_up_x (int) : trailing high x
trail_up (float) : trailing high y
hh (float) : if there was a higher high
bear_bos_alert (bool) : if there was a bearish bos alert -> plot it
bear_choch_alert (bool) : if there was a bearish chock alert -> plot it
btm_x (int) : latest swing low x
btm_y (float) : latest swing low y
trail_dn_x (int) : trailing low x
trail_dn (float) : trailing low y
ll (float) : if there was a lower low
color_bull (color) : color for bullish BoS/ChoCh levels
color_bear (color) : color for bearish BoS/ChoCh levels
show_swing_points (bool) : whether to plot swing point labels
show_latest_swings_levels (bool) : whether to track and plot latest swing point levels with lines
show_bos (bool) : whether to plot BoS levels
show_choch (bool) : whether to plot ChoCh levels
line_style (string) : whether to plot BoS levels
label_size (string) : label size of plotted BoS/ChoCh levels
keep_history (bool) : weater to remove older swing point labels and only keep the most recent
structure(length, color_bull, color_bear, super_hh, super_ll, filter_insignificant_internal_breaks, show_swing_points, show_latest_swings_levels, show_bos, show_choch, line_style, label_size, keep_history, enabled)
detect (and plot) structural breaks and the resulting new trend
Parameters:
length (simple int) : lookback period for swing point detection
color_bull (color) : color for bullish BoS/ChoCh levels
color_bear (color) : color for bearish BoS/ChoCh levels
super_hh (float) : level/y-coordinate of superior hh (for internal structure detection)
super_ll (float) : level/y-coordinate of superior ll (for internal structure detection)
filter_insignificant_internal_breaks (bool) : if true pivot points / internal structure will be ignored where the wick in trend direction is longer than the opposite (likely to push further in direction of main trend)
show_swing_points (bool) : whether to plot swing point labels
show_latest_swings_levels (bool) : whether to track and plot latest swing point levels with lines
show_bos (bool) : whether to plot BoS levels
show_choch (bool) : whether to plot ChoCh levels
line_style (string) : whether to plot BoS levels
label_size (string) : label size of plotted BoS/ChoCh levels
keep_history (bool) : weater to remove older swing point labels and only keep the most recent
enabled (bool)
_check_equal_level(mode, len, eq_threshold, enabled)
INTERNAL: detect equal levels (double top/bottom)
Parameters:
mode (int) : detect 1: bullish/high, -1 bearish/low pivot points
len (int) : lookback period for equal level (swing point) detection
eq_threshold (float) : maximum price offset for a level to be considered equal
enabled (bool)
Returns: eq_alert whether an equal level was detected and coordinates of the first and the second level/swing point
_plot_equal_level(show_eq, x1, y1, x2, y2, label_txt, label_style, label_size, line_color, line_style, keep_history)
INTERNAL: plot equal levels (double top/bottom)
Parameters:
show_eq (bool) : whether to plot the level or not
x1 (int) : x-coordinate of the first level / swing point
y1 (float) : y-coordinate of the first level / swing point
x2 (int) : x-coordinate of the second level / swing point
y2 (float) : y-coordinate of the second level / swing point
label_txt (string) : text for the label above/below the line connecting the equal levels
label_style (string) : style (label.style_label_down/up) for the label above/below the line connecting the equal levels
label_size (string) : size (size.tiny) for the label above/below the line connecting the equal levels
line_color (color) : color for the line connecting the equal levels (and it's label)
line_style (string) : style (line.style_dotted) for the line connecting the equal levels
keep_history (bool) : weater to remove older swing point labels and only keep the most recent
equal_levels_values(len, threshold, enabled)
detect (and plot) equal levels (double top/bottom), returns coordinates
Parameters:
len (int) : lookback period for equal level (swing point) detection
threshold (float) : maximum price offset for a level to be considered equal
enabled (bool) : whether detection is enabled
Returns: (eqh_alert, eqh_x1, eqh_y1, eqh_x2, eqh_y2) whether an equal high was detected and coordinates of the first and the second level/swing point, (eql_alert, eql_x1, eql_y1, eql_x2, eql_y2) same for equal lows
equal_levels_plot(eqh_x1, eqh_y1, eqh_x2, eqh_y2, eql_x1, eql_y1, eql_x2, eql_y2, color_eqh, color_eql, show, keep_history)
detect (and plot) equal levels (double top/bottom), returns coordinates
Parameters:
eqh_x1 (int) : coordinates of first point of equal high
eqh_y1 (float) : coordinates of first point of equal high
eqh_x2 (int) : coordinates of second point of equal high
eqh_y2 (float) : coordinates of second point of equal high
eql_x1 (int) : coordinates of first point of equal low
eql_y1 (float) : coordinates of first point of equal low
eql_x2 (int) : coordinates of second point of equal low
eql_y2 (float) : coordinates of second point of equal low
color_eqh (color) : color for the line connecting the equal highs (and it's label)
color_eql (color) : color for the line connecting the equal lows (and it's label)
show (bool) : whether plotting is enabled
keep_history (bool) : weater to remove older swing point labels and only keep the most recent
Returns: (eqh_alert, eqh_x1, eqh_y1, eqh_x2, eqh_y2) whether an equal high was detected and coordinates of the first and the second level/swing point, (eql_alert, eql_x1, eql_y1, eql_x2, eql_y2) same for equal lows
equal_levels(len, threshold, color_eqh, color_eql, enabled, show, keep_history)
detect (and plot) equal levels (double top/bottom)
Parameters:
len (int) : lookback period for equal level (swing point) detection
threshold (float) : maximum price offset for a level to be considered equal
color_eqh (color) : color for the line connecting the equal highs (and it's label)
color_eql (color) : color for the line connecting the equal lows (and it's label)
enabled (bool) : whether detection is enabled
show (bool) : whether plotting is enabled
keep_history (bool) : weater to remove older swing point labels and only keep the most recent
Returns: (eqh_alert) whether an equal high was detected, (eql_alert) same for equal lows
_detect_fvg(mode, enabled, o, h, l, c, filter_insignificant_fvgs, change_tf)
INTERNAL: detect FVG (fair value gap)
Parameters:
mode (int) : detect 1: bullish, -1 bearish gaps
enabled (bool) : whether detection is enabled
o (float) : reference source open
h (float) : reference source high
l (float) : reference source low
c (float) : reference source close
filter_insignificant_fvgs (bool) : whether to calculate and filter small/insignificant gaps
change_tf (bool) : signal when the previous reference timeframe closed, triggers new calculation
Returns: whether a new FVG was detected and its top/mid/bottom levels
_clear_broken_fvg(mode, upper_boxes, lower_boxes)
INTERNAL: clear mitigated FVGs (fair value gaps)
Parameters:
mode (int) : detect 1: bullish, -1 bearish gaps
upper_boxes (array) : array that stores the upper parts of the FVG boxes
lower_boxes (array) : array that stores the lower parts of the FVG boxes
_plot_fvg(mode, show, top, mid, btm, border_color, extend_box)
INTERNAL: plot (and clear broken) FVG (fair value gap)
Parameters:
mode (int) : plot 1: bullish, -1 bearish gap
show (bool) : whether plotting is enabled
top (float) : top level of fvg
mid (float) : center level of fvg
btm (float) : bottom level of fvg
border_color (color) : color for the FVG box
extend_box (int) : how many bars into the future the FVG box should be extended after detection
fvgs_values(o, h, l, c, filter_insignificant_fvgs, change_tf, enabled)
detect (and plot / clear broken) FVGs (fair value gaps), and return alerts and level values
Parameters:
o (float) : reference source open
h (float) : reference source high
l (float) : reference source low
c (float) : reference source close
filter_insignificant_fvgs (bool) : whether to calculate and filter small/insignificant gaps
change_tf (bool) : signal when the previous reference timeframe closed, triggers new calculation
enabled (bool) : whether detection is enabled
Returns: (bullish_fvg_alert, bull_top, bull_mid, bull_btm): whether a new bullish FVG was detected and its top/mid/bottom levels, (bearish_fvg_alert, bear_top, bear_mid, bear_btm): same for bearish FVGs
fvgs_plot(bullish_fvg_alert, bull_top, bull_mid, bull_btm, bearish_fvg_alert, bear_top, bear_mid, bear_btm, color_bull, color_bear, extend_box, show)
Parameters:
bullish_fvg_alert (bool)
bull_top (float)
bull_mid (float)
bull_btm (float)
bearish_fvg_alert (bool)
bear_top (float)
bear_mid (float)
bear_btm (float)
color_bull (color) : color for bullish FVG boxes
color_bear (color) : color for bearish FVG boxes
extend_box (int) : how many bars into the future the FVG box should be extended after detection
show (bool) : whether plotting is enabled
Returns: (bullish_fvg_alert, bull_top, bull_mid, bull_btm): whether a new bullish FVG was detected and its top/mid/bottom levels, (bearish_fvg_alert, bear_top, bear_mid, bear_btm): same for bearish FVGs
fvgs(o, h, l, c, filter_insignificant_fvgs, change_tf, color_bull, color_bear, extend_box, enabled, show)
detect (and plot / clear broken) FVGs (fair value gaps)
Parameters:
o (float) : reference source open
h (float) : reference source high
l (float) : reference source low
c (float) : reference source close
filter_insignificant_fvgs (bool) : whether to calculate and filter small/insignificant gaps
change_tf (bool) : signal when the previous reference timeframe closed, triggers new calculation
color_bull (color) : color for bullish FVG boxes
color_bear (color) : color for bearish FVG boxes
extend_box (int) : how many bars into the future the FVG box should be extended after detection
enabled (bool) : whether detection is enabled
show (bool) : whether plotting is enabled
Returns: (bullish_fvg_alert): whether a new bullish FVG was detected, (bearish_fvg_alert): same for bearish FVGs
OrderBlock
Fields:
id (series int)
dir (series int)
left_top (chart.point)
right_bottom (chart.point)
break_price (series float)
early_confirmation_price (series float)
ltf_high (array)
ltf_low (array)
ltf_volume (array)
plot (Box type from robbatt/lib_plot_objects/49)
profile (Profile type from robbatt/lib_profile/32)
trailing (series bool)
extending (series bool)
awaiting_confirmation (series bool)
touched_break_price_before_confirmation (series bool)
soft_confirmed (series bool)
has_fvg_out (series bool)
hidden (series bool)
broken (series bool)
OrderBlockConfig
Fields:
show (series bool)
show_last (series int)
show_id (series bool)
show_profile (series bool)
args (BoxArgs type from robbatt/lib_plot_objects/49)
txt (series string)
txt_args (BoxTextArgs type from robbatt/lib_plot_objects/49)
delete_when_broken (series bool)
broken_args (BoxArgs type from robbatt/lib_plot_objects/49)
broken_txt (series string)
broken_txt_args (BoxTextArgs type from robbatt/lib_plot_objects/49)
broken_profile_args (ProfileArgs type from robbatt/lib_profile/32)
use_profile (series bool)
profile_args (ProfileArgs type from robbatt/lib_profile/32)

Fair Value Gap [UkutaLabs]█ OVERVIEW
Fair Value Gaps are price jumps caused by the imbalance buying and selling pressures in trading and are most commonly used amongst price action traders. Fair Value Gaps are formed via a three-candle sequence in which a large candle’s neighbouring candles’ upper and lower wicks do not fully overlap the large candle.
The Fair Value Gaps Indicator also supports Multi Time Frame Plotting, allowing you to plot the Fair Value Gaps from higher time frames onto lower time frame charts.
The Fair Value Gaps Indicator is a powerful trading toolkit that provides users with more information than they would typically have available to them by allowing them to configure several charts worth of information onto one single chart.
█ USAGE
The script automatically identifies imbalances between buying and selling pressure in the market in real time, offering traders valuable insight into current market sentiment. These gaps are considered to be levels where the supply and demand of a commodity are imbalanced, and the price tends to return to fill these gaps (But are not guaranteed to).
The Fair Value Gaps Indicator also allows gaps from higher time frames to be drawn on lower time frame charts, providing traders with more information than they would typically have access to to further simplify the decision making process.
█ SETTINGS
Configuration
• Show Labels: Determines whether labels that identify which time frame a FVG is calculated from.
• Max FVG Display: Determines the limit to the number of FVGs that can be drawn from all time frames. Set this value to 0 to remove this limit.
Current Time Frame
• Display: Determines whether or not FVGs from the current time frame will be drawn on the chart.
• Bullish Color: Determines the color of Bullish FVGs calculated from the current time frame.
• Bearish Color: Determines the color of Bearish FVGs calculated from the current time frame.
5 Minute (Higher Time Frame)
• Display: Determines whether or not FVGs from the 5 minute time frame will be drawn on the chart.
• Bullish Color: Determines the color of Bullish FVGs calculated from the 5 minute time frame.
• Bearish Color: Determines the color of Bearish FVGs calculated from the 5 minute time frame.
15 Minute (Higher Time Frame)
• Display: Determines whether or not FVGs from the 15 minute time frame will be drawn on the chart.
• Bullish Color: Determines the color of Bullish FVGs calculated from the 15 minute time frame.
• Bearish Color: Determines the color of Bearish FVGs calculated from the 15 minute time frame.
30 Minute (Higher Time Frame)
• Display: Determines whether or not FVGs from the 30 minute time frame will be drawn on the chart.
• Bullish Color: Determines the color of Bullish FVGs calculated from the 30 minute time frame.
• Bearish Color: Determines the color of Bearish FVGs calculated from the 30 minute time frame.
60 Minute (Higher Time Frame)
• Display: Determines whether or not FVGs from the 60 minute time frame will be drawn on the chart.
• Bullish Color: Determines the color of Bullish FVGs calculated from the 60 minute time frame.
• Bearish Color: Determines the color of Bearish FVGs calculated from the 60 minute time frame.
240 Minute (Higher Time Frame)
• Display: Determines whether or not FVGs from the 240 minute time frame will be drawn on the chart.
• Bullish Color: Determines the color of Bullish FVGs calculated from the 240 minute time frame.
• Bearish Color: Determines the color of Bearish FVGs calculated from the 240 minute time frame.
Daily (Higher Time Frame)
• Display: Determines whether or not FVGs from the daily time frame will be drawn on the chart.
• Bullish Color: Determines the color of Bullish FVGs calculated from the daily time frame.
• Bearish Color: Determines the color of Bearish FVGs calculated from the daily time frame.
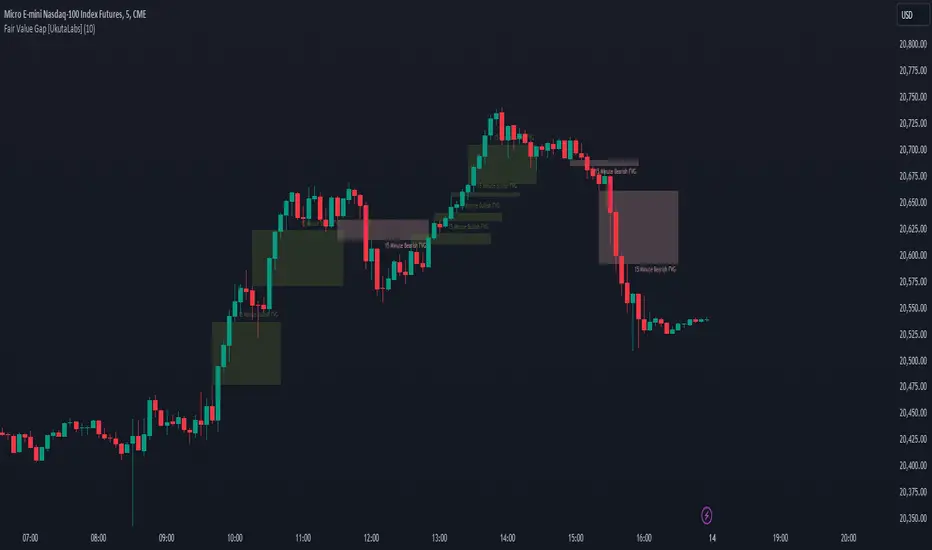
ICT Silver Bullet with signals
The "ICT Silver Bullet with signals" indicator (inspired from the lectures of "The Inner Circle Trader" (ICT)),
goes a step further than the ICT Silver Bullet publication, which I made for LuxAlgo :
• uses HTF candles
• instant drawing of Support & Resistance (S/R) lines when price retraces into FVG
• NWOG - NDOG S/R lines
• signals
The Silver Bullet (SB) window which is a specific 1-hour interval where a Fair Value Gap (FVG) pattern can be formed.
When price goes back to the FVG, without breaking it, Support & Resistance lines will be drawn immediately.
There are 3 different Silver Bullet windows (New York local time):
The London Open Silver Bullet (03 AM — 04 AM ~ 03:00 — 04:00)
The AM Session Silver Bullet (10 AM — 11 AM ~ 10:00 — 11:00)
The PM Session Silver Bullet (02 PM — 03 PM ~ 14:00 — 15:00)
🔶 USAGE
This technique can visualise potential support/resistance lines, which can be used as targets.
The script contains 2 main components:
• forming of a Fair Value Gap (FVG)
• drawing support/resistance (S/R) lines
🔹 Forming of FVG
When HTF candles forms an FVG, the FVG will be drawn at the end (close) of the last HTF candle.
To make it easier to visualise the 2 HTF candles that form the FVG, you can enable
• SHOW -> HTF candles
During the SB session, when a FVG is broken, the FVG will be removed, together with its S/R lines.
The same goes if price did not retrace into FVG at the last bar of the SB session
Only exception is when "Remove broken FVG's" is disabled.
In this case a FVG can be broken, as long as price bounces back before the end of the SB session, it will remain to be visible:
🔹 Drawing support/resistance lines
S/R target lines are drawn immediately when price retraces into the FVG.
They will remain updated until they are broken (target hit)
Potential S/R lines are formed by:
• previous swings (swing settings (left-right)
• New Week Opening Gap (NWOG): close on Friday - weekly open
• New Day Opening Gap (NWOG): close previous day - current daily open
Only non-broken lines are included.
Broken =
• minimum of open and close below potential S/R line
• maximum of open and close above potential S/R line
NDOG lines are coloured fuchsia (as in the ICT lectures), NWOG are coloured white (darkmode) or black (lightmode ~ ICT lectures)
Swing line colour can be set as desired.
Here S/R includes NDOG lines:
The same situation, with "Extend Target-lines to their source" enabled:
Here with NWOG lines:
This publication contains a "Minimum Trade Framework (mTFW)", which represents the best-case expected price delivery, this is not your actual trade entry - exit range.
• 40 ticks for index futures or indices
• 15 pips for Forex pairs
The minimum distance (if applicable) can be shown by enabling "Show" - "Minimum Trade Framework" -> blue arrow from close to mTFW
Potential S/R lines needs to be higher (bullish) or lower (bearish) than mTFW.
🔶 SETTINGS
(check USAGE for deeper insights and explanation)
🔹 Only last x bars: when enabled, the script will do most of the calculations at these last x candles, potentially this can speeds calculations.
🔹 Swing settings (left-right): Sets the length, which will set the lookback period/sensitivity of the ZigZag patterns (which directs the trend and points for S/R lines)
🔹 FVG
HTF (minutes): 1-15 minutes.
• When the chart TF is equal of higher, calculations are based on current TF.
• Chart TF > 15 minutes will give the warning: "Please use a timeframe <= 15 minutes".
Remove broken FVG's: when enabled the script will remove FVG (+ associated S/R lines) immediately when FVG is broken at opposite direction.
FVG's still will be automatically removed at the end of the SB session, when there is no retrace, together with associated S/R lines,...
~ trend: Only include FVG in the same direction as the current trend
Note -> when set 'right' (swing setting) rather high ( > 3), he trend change will be delayed as well (default 'right' max 5)
Extend: extend FVG to max right side of SB session
🔹 Targets – support/resistance
Extend Target-lines to their source: extend lines to their origin
Colours (Swing S/R lines)
🔹 Show
SB session: show lines and labels of SB session (+ colour)
• Labels can be disabled separately in the 'Style' section, colour is set at the 'Inputs' section
Trend : Show trend (ZigZag, coloured ~ trend)
HTF candles: Show the 2 HTF candles that form the FVG
Minimum Trade Framework: blue arrow (if applicable)
🔶 ALERTS
There are 4 signals provided (bullish/bearish):
FVG Formed
FVG Retrace
Target reached
FVG cancelled
You can choose between dynamic alerts - only 1 alert needs to be set for all signals, or you can set specific alerts as desired.
💜 PURPLE BARS 😈
• Since TradingView has chosen to give away our precious Purple coloured Wizard Badge, bars are coloured purple 😊😉

[GetSparx] Lacuna Pro⚡ Lacuna Pro – Institutional Liquidity Framework
This indicator is a premium Smart Money Concepts (SMC) trading toolkit designed to help traders identify high-probability entry and exit zones by visualizing real-time market inefficiencies. It combines Fair Value Gaps (FVGs), Break of Structure (BOS), Change of Character (CHoCH), and Supply & Demand Zones into a unified, configurable framework.
Unlike many public indicators that simply "overlay concepts", this indicator implements strict internal validation to filter out noise and provide only institutional-grade levels — making it a valuable execution layer for SMC-based strategies.
🧠 What the Script Does – and Why the Combination Matters
This is more than just a combination of known SMC tools — it's a complete workflow assistant:
-FVGs highlight where liquidity is likely resting due to institutional imbalance.
-BOS & CHoCH define structural context: whether the market is trending or shifting.
-Supply & Demand Zones show where institutions are likely to react.
-Each component works together to create a layered confluence system:
-FVG inside a Demand Zone after a Bullish CHoCH → High-probability Long Setup
-Bearish BOS into a Supply Zone + fresh Bearish FVG → High-probability Short Setup
📘 Core Concepts Explained
Fair Value Gap (FVG)
FVGs occur when price moves with strong momentum and leaves a gap between candles — suggesting inefficiency. Bullish FVGs lie below price; bearish ones above. Price often returns to these levels before continuing.
An FVG is detected when a three-candle sequence reveals a price imbalance:
- Bullish : Candle 2’s low is higher than Candle 1’s high
- Bearish : Candle 2’s high is lower than Candle 1’s low
These setups indicate a sudden burst of institutional momentum, often causing price to revisit the gap for rebalancing.
Break of Structure (BOS)
A BOS signals trend continuation when price breaks the previous swing high or low in the direction of the current trend.
The script uses a 3-bar pivot system to detect local swing highs and lows — a swing high forms when the highest candle is flanked by two lower highs on each side (and vice versa for swing lows).
A BOS is confirmed when price closes beyond the most recent swing point in alignment with the current trend direction.
Change of Character (CHoCH)
A CHoCH signals a potential trend reversal by breaking a structure level in the opposite direction of the prevailing trend.
It is detected when price breaks the most recent opposing swing and simultaneously flips the internal trend state.
CHoCH events always take precedence over BOS to avoid conflicting signals.
The internal trend engine ensures that these structural shifts are valid and not caused by random volatility.
Supply & Demand Zones
These zones mark institutional interest and are formed using precise price action rules — not arbitrary support/resistance.
A valid zone begins when a small-bodied base candle (such as a star or doji) appears at a local swing point. This candle must be followed by a strong impulse candle — either a bullish engulfing (for demand) or bearish breakout (for supply).
- Demand Zone : From the base candle's low to the impulse candle's high
- Supply Zone : From the base candle's high to the impulse candle's low
These zones represent likely institutional entries or exits, often acting as magnets or rejection areas. Once price decisively breaks through a zone, it is automatically removed — keeping the chart clean and relevant.
Zone Detection Logic – When a Zone Is Drawn or Skipped
Below are the precise rules used to determine whether a Supply or Demand Zone is valid and shown on the chart
A Supply or Demand Zone is only drawn if all of the following conditions are met:
-A small-bodied base candle forms at a local high or low (body size below threshold)
-The base candle is followed by a strong impulse candle (engulfing or breakout)
-The impulse direction matches the expected context (e.g., bearish impulse from swing high = Supply)
-The candle wicks do not invalidate the structure (e.g., no long opposing wick that retraces the move)
-The zone meets the minimum size threshold based on % or ATR filter
If any of these criteria are not satisfied, the zone is skipped to avoid false or weak levels.
This ensures only clean, institutional-grade Supply & Demand Zones are shown on the chart.
(e.g. small-bodied star + bullish engulfing at swing low = Demand Zone, or bearish breakout at swing high = Supply Zone).
🔍 Core Functionality & Original Features
1. 📉 Fair Value Gaps (FVGs) – Dynamic, Validated, and Clean
Unlike scripts that draw every gap, this script applies strict quality control to ensure only meaningful FVGs appear:
Minimum Threshold Filtering
Filters out small or noisy gaps by requiring each FVG to exceed a % or ATR-based size threshold. Prevents micro-gap clutter on lower timeframes.
Momentum Candle Verification
Requires a strong middle candle (candle 2) between two extremes. Large opposing wicks invalidate the setup.
Partial Fill Adjustment
When price partially fills a gap, the FVG box automatically shrinks to show only the remaining imbalance. If fully filled, the box is removed.
Multi-Timeframe Overlays
View institutional gaps from 15m, 1H, 4H, or Daily overlaid onto any chart for top-down analysis and entry refinement.
2. 🧱 Structural Shifts – BOS & CHoCH
Structural logic is built around pivot detection with real-time trend state awareness:
Pivot Logic (Customizable Strength)
Local highs/lows are detected using pivot length (default: 3 bars left/right). Breaks are only confirmed if they align with the internal trend state.
BOS = Continuation
Breaks a swing in trend direction (e.g., HL → HH → BOS at previous HH)
CHoCH = Reversal
Breaks a structure against trend (e.g., HH → HL → break of HL = Bearish CHoCH)
Conflict Resolution
If both BOS and CHoCH could trigger, CHoCH takes priority. This avoids false positives and ensures a single, clear structure signal per swing.
Styling & Visibility
All structure lines and labels are customizable — colors, line style (solid/dashed), and which signals to display (BOS/CHoCH/both).
3. 🧠 Supply & Demand Zones – Smart Detection & Maintenance
These zones are generated using strict price action logic, not arbitrary support/resistance lines:
-Formation Conditions
-Small-bodied "base candle" at a local high/low
-Followed by an impulse candle (bullish/bearish engulfing or breakout)
-Zone Bounds
- Demand : From base candle low to impulse high
- Supply : From base candle high to impulse low
Automatic Cleanup
Once price decisively pierces a zone, it’s automatically removed from the chart. This keeps the display relevant and clutter-free.
Multi-Timeframe Zones
Toggle zones from your current timeframe or overlay from 1H, 4H, and Daily — ideal for confluence stacking.
Zone Compression Filtering
Optional compression % ensures overlapping zones are combined logically to reduce redundancy.
🧩 How It Works Together – Practical Usage Flow
This indicator is designed to follow a structured workflow used by institutional-style traders:
Trend Structure
Identify trend using BOS and CHoCH on your timeframe.
Liquidity Zones
Look for supply/demand zones aligning with the structural bias.
Execution Areas
Wait for an unfilled FVG in confluence with the above conditions.
📸 Screenshot Captions
Screenshot 1: CHoCH + Demand Zone + Bullish FVG
📌 Reversal Setup with Confluence
A Bullish CHoCH confirms a structural shift. Price enters a Demand Zone and reacts from an unfilled Bullish FVG, creating a high-probability long opportunity.
Screenshot 2: Bearish BOS + FVG Fill
📌 Trend Continuation Confirmation
Price breaks a swing low, triggering a Bearish BOS. A Bearish FVG forms and price returns to fill it before continuing lower — validating the trend and the gap.
Screenshot 3: Multi-Timeframe Overlay (FVGs from 1H and 4H)
📌 Top-Down Liquidity Mapping
Overlaid 1H and 4H FVGs provide institutional-level insight on lower timeframes. Combined with structure signals, this supports precise entry alignment across timeframes.
As price partially fills a bullish gap, the FVG box auto-adjusts to show only the remaining imbalance. Fully filled zones are automatically removed, keeping the chart clean.
Screenshot 4: Supply Zone Rejection
📌 Institutional Supply in Action
Price enters a Supply Zone formed from a base candle + bearish impulse. A sharp rejection confirms active sell-side interest at this level. Zone opgevuld box verdwijnt
Screenshot 5: Bullish BOS + Internal Trend Logic
📌 Trend Continuation with Structure Awareness
A Higher Low forms, followed by a Higher High, triggering a Bullish BOS. The internal trend engine confirms direction and filters false reversals.
Screenshot 6: Zone Compression Logic
📌 Smart Zone Consolidation
Closely overlapping supply zones are merged using compression logic to prevent clutter. Only the strongest institutional levels remain visible.
⚙ Full Customization Panel
You can configure:
-FVG display per timeframe + color scheme
-BOS/CHoCH styling, label text, and detection toggles
-Zone settings: visibility, compression %, length
-Auto-cleanup behavior for FVGs and zones
🔐 Why Invite-Only?
This indicator contains original logic not available in public indicators, including:
-Momentum-candle verified FVGs
-Real-time partial fill trimming
-Auto-removal of invalidated structure/zones
-Conflict-aware BOS/CHoCH logic
-Multi-timeframe overlays with internal state tracking
-Proprietary compression-based zone filtering
This script is part of a private paid offering. It is not based on reused or repackaged educational code. The logic and structure management are exclusive to this implementation.
⚠ Disclaimer
This tool is for educational and analytical use only. It does not provide financial advice or trading signals. Always use proper risk management and do your own due diligence.

Plyo Tap'n'Slap (TnS) by OutOfOptionsThe Model
This Strategy/Model takes advantage of the strongest trend signature in the market, which is also the most basic move in the market. This basic move is what most traders consider to be a staircase, or trendline. ICT traders call this setup a “unicorn” which is just another word for when an Order block overlaps with an FVG. The beauty of this model is that you don't need to know what ANY of these things are.
The entry comes when a candles High or Low overlaps with a FVG that is at least 3 points away from both edges of the FVG. If the candle is too close to the edge then the setups is invalid (see rules for more). TO find a candle that overlaps with the FVG it also can not cut through any other price action, for example, A potential entry cant cut through another wick to make it overlap with the FVG. (see rules for more)
TnS gets its TP by analyzing what is called the "OG TP" The OG TP is determined by looking for the first tapped into the FVG, then looking for an immediate High or Low to the left of the candle that first tapped the FVG. IF there is no immediate High or low next to the candle that first tapped the FVG, then target the candle itself (see rules for more). IF the "OG TP" has already been hit before TnS gets its entry, then look to the left of the TnS entry candle for the immediate High or Low next to it. If there is no immediate High or Low next to the TnS Entry candle, then target the Entry candles, High or Low (see rules for more)
Model Rules
Overlapping H/L MUST be at least 3 points away from both edges of the FVG,
Overlapping H/L cannot cut through PA to make it overlap with the FVG,
Entries can only be the highest overlapping high or the lowest overlapping low,
If TnS Has already played out within the FVG then it should no longer be used,
If the FVGs OG TP has already been hit then use the TnS entry to re-align for your target,
No using NWOGs/NDOGs for setups. A NWOG is NOT the same thing as an FVG so this example
V2 Rules
If its a Bullish FVG then you need a bearish candle H/L that overlaps for your entry
If its a Bearish FVG then you need a bullish candle H/L that overlaps for your entry
Indicator Functionality
The indicator uses specific logic to identify FVGs that match the requirements of the TnS model, ensuring at least one valid entry exists per the default V1 rules of the model, or the stricter V2 rules if configured via settings. If entries (up to 2 per model rules) are identified, the FVG is highlighted, and each entry and its stop loss is marked with a line. The line styles, colors, and FVG color, which can vary depending on whether the entry is bullish or bearish, are configurable via settings.
Once the FVG is tapped into, the indicator will highlight the take profit spot and list all applicable entries, stop losses, and take profits in a table, the position and presence of which can be controlled within the indicator settings. When price action hits either stop loss or take profit, all elements are removed from the chart to avoid clutter.
Additionally, the indicator allows filtering of entries based on Risk/Reward (R:R), filtering out entries where take profit is less than the model stop loss and entries for which the stop loss resides inside the FVG itself. To help visualize setups where the FVG is outside the current visual range, the indicator has options to extend the FVG box and lines by a configurable number of bars. Once the FVG is tapped, the indicator will automatically extend lines/FVG box to the bar that tapped the FVG plus the configured number of bars.

IMGPro - V1.0IMG PRO uses nine sequential stages to analyse price action and alert users to potential Trade Setups using various Price Action Concepts as detailed below:
1. Identify Higher Timeframe Market Structure and Points of Interest (HTF-POIs)
2. Calculate position size based on your risk appetite, fees and account leverage and customisable maximum trade risk
3. Verify price is in a premium or discount
4. Determine Lower Timeframe Market Structure Break Type
5. Apply Early Warning Systems if enabled
6. Alert you to risk managed trade setups at enabled HTF-POIs
7. Alert you to unentered trade invalidations
8. Alert you to trade exits based on your set criteria
9. Provide Additional Alerts such as Higher Timeframe SFPs and Market Structure Breaks that act as potential early warnings that a trade setup may be forming
1. HTF POIs Available with IMG PRO:
a. HTF Market Structure Range Highs and Lows
b. HTF Order Blocks
c. HTF Order Blocks & FVG Overlaps
d. HTF Breakers
e. HTF Breakers & FVG Overlaps
f. HTF FVGs
g. Internal Liquidity Levels
These levels are used for Trade Signals based on user settings applied. Details provided in the trade setup section below
a. Higher Timeframe Market Structure Range High and Low through Multiple Timeframe Analysis:
Market Structure can be defined using several techniques. The IMG indicators employ the Close through High/Low technique, which necessitates a candle to close through a structural level to validate a structural break and designate a new range.
Example: H12 Market Structure visualisation on a H12 Chart with annotations:
By selecting a particular Market Structure timeframe in the settings, the indicator immediately illustrates both current and historical market structures for the chosen timeframe across all subordinate timeframes, subject to the limitations of your Tradingview subscription.
Example: H12 Market Structure visualisation on a H1 Chart with annotations:
b. Higher Timeframe Order Blocks
An Order Block represents the last candle of the opposite direction preceding a Market Structure Break. For instance, a bullish Order Block is identified as the final bearish candle leading to a bullish market structure break, and vice versa for bearish Order Blocks.
Example: H12 OB visualisation on a H12 Chart with annotations:
When activated, the indicator will highlight the Higher Timeframe Order Blocks responsible for a Market Structure Break on all subordinate timeframes relative to the chosen Market Structure Timeframe.
Note: if multiple OBs exist, the indicator will display the OB closest to the new range extreme
Example: H12 OB visualisation on a H1 Chart with annotations:
c. HTF Order Blocks & HTF FVG Overlaps
When enabled, the IMG Pro will only display overlaps of Order Blocks and FVGs. These are strong points of interest to look for trade setups
Example of the indicator displaying a Higher Timeframe’s (HTF) OBs + FVGs on a Lower Timeframe (LTF) chart:
The upper chart labelled H12/H12 is the indicator displaying H12 Structure and OB+FVGs on a H12 chart.
The lower chart labelled H12/H1 is the indicator displaying H12 OB+FVGs on a H1 chart:
d. Higher Timeframe Breakers
A Breaker Block is identified as the most recent Order Block that has been breached by price, leading to an opposite Market Structure Break. For example, a bullish Breaker Block is the last bearish Order Block that price has passed through, confirming a bullish structural break, and the inverse is true for bearish Breakers.
Example: H12 Breaker visualisation on a H12 Chart with annotations:
Once enabled, the system will display Higher Timeframe Breaker Blocks after an opposite Market Structure Break is confirmed on all subordinate timeframes.
Example: H12 Breaker visualisation on a H1 Chart with annotations:
e. HTF Breakers & HTF FVG Overlaps
When enabled, the IMG Pro will only display overlaps of Breakers and FVGs. These are strong points of interest to look for trade setups
Example:
The upper chart labelled H12/H12 is the indicator displaying H12 Structure and Breakers+FVGs on a H12 chart
The lower chart labelled H12/H1 is the indicator displaying H12 Breakers+FVGs on a H1 chart
f. Higher Timeframe Fair Value Gaps (FVGs)
A Fair Value Gap is a concept used by price action traders to identify market inefficiencies, where buying and selling are not balanced. It appears on a chart as a triple-candle pattern, with a large candle flanked by two others whose highs and lows do not overlap with the large candle, creating a gap. This gap often attracts the price towards it before the market resumes its previous direction.
Example of the indicator displaying a Higher Timeframe’s FVGs on a Lower Timeframe (LTF) chart:
-The upper chart labelled H12/H12 is the indicator displaying H12 Structure and FVGs on a H12 chart.
-The lower chart labelled H12/H1 is the indicator displaying H12 FVGs on a H1 chart
g. HTF Internal Liquidity Levels (FVGs)
A HTF Liquidity Level is a Higher Timeframe three bar Pivot that forms inside an active range.
When enabled, the system will display all UNTESTED HTF pivots formed within an active range. Lines will stop extending once they are either tested or HTF Market Structure Breaks
Example: H12 Liquidity Levels on a H1 Chart:
2. Risk Management and Position Sizing:
a. Automated Position Sizing:
The System will automatically calculate position size based on the account size, max leverage and risk appetite (capital risk per trade) details input in settings. Calculated trade details are included in the Tradingview Alerts as well as interactive labels on the charts.
Details include but are not limited to:
Trade Timeframe
Side: Long/Short
Type: Limit/Market
Position Size in $ and Units
Lot sizes if applicable
Trade Risk %
Take Profit Level
Entry Price
Stoploss Price
b. Maximum Trade Risk:
IMG PRO has the ability to invalidate potential trade entries if it exceeds your maximum Trade Risk threshold. Trade Risk is the % price difference between entry and stoploss.
When an invalid signal is generated, the signal will not be shaded and the interactive label will display the reason for invalidation
In the example below, Max Trade Risk is set to 2% , but the trade signal had a trade risk of 5.11% invalidating the signal with a grey triangle
3. Verify Premium / Discount:
The system can be setup to only display signals that are in the top or bottom n% of the Market Structure Range
A value of 0 (default) will disable the premium/discount system and utilize the entire range for all signal types (bullish and bearish)
EXAMPLES:
A value of 50% will only display bullish signals that have, at minimum, tagged the bottom half of the range and vice versa for bearish signals.
A value of 25% will only display bullish signals that have tagged the bottom quarter of the range and vice versa.
A value of 38.2% will display signals that tag the top and bottom 38.2% of the range (equivalent of the 61.8% OTE. retracement) Etc.
4. Determine Lower Timeframe Market Structure Break Type
IMG Pro has two options for Lower Timeframe Structure Breaks:
Market Structure Breaks: When selected, the system will use the first opposite pivot (in the current chart timeframe) to the left of a confirmed SFP to calculate a break in market structure when price closes through it:
Market Structure Shifts: When selected, the system will use the first opposite pivot (in the current chart timeframe) to the left OR right of a confirmed SFP to calculate a break in market structure when price closes through it. MSS’ are more sensitive and may provide more false signals but are useful when there are big spike liquidity runs:
5. Apply Early Warning Systems if enabled:
The IMG Pro indicator has an early warning system that will generate a potential setup alert before a HTF SFP is confirmed
There are two types of early warnings:
LTF Structure Break Early Warning:
If enabled, the system will generate a potential setup alert if price cuts through a HTF level (Range Extreme / Internal Liquidity) and prints an opposite LTF MSB back through that level. This is a more aggressive approach where the system does not wait for the HTF SFP to be confirmed.
Example: In the screenshot below, the system did not wait for a H12 SFP to be confirmed, allowing it to signal an entry that would have otherwise been missed if the LTF Structure Break early warning system was not enabled
LTF FVG Early Warning:
If enabled, the system will generate a potential setup alert if price cuts through a HTF level (Range Extreme / Internal Liquidity) and prints an opposite LTF FVG back through that level. No LTF MSB is required and a limit order at the FVG is signalled. This is a more aggressive approach where the system does not wait for the HTF SFP to be confirmed.
Example: In the screenshot below, the system did not wait for a H12 SFP to be confirmed, signalling an entry as soon as an opposite LTF FVG is confirmed pushing price back through the HTF Liquidity Levels
6. Trade Setup Types Available with IMG PRO:
The system will alert you to potential trade setups at these HTF POIs: .
a. Higher Timeframe (HTF) Swing Failure followed by a Lower Timeframe (LTF) MSB at Range Extremes
b. Higher Timeframe (HTF) Swing Failure followed by a Lower Timeframe (LTF) MSB at enabled HTF POIs
c. Higher Timeframe (HTF) Swing Failure followed by a Lower Timeframe (LTF) MSB at All Internal Liquidity Levels (With Trend and Counter Trend)
d. Higher Timeframe (HTF) Swing Failure followed by a Lower Timeframe (LTF) MSB at All Internal Liquidity Levels (With Trend ONLY)
e. Lower Timeframe (LTF) Swing Failure followed by a Lower Timeframe (LTF) MSB at enabled HTF POIs
f. Multiple LTF Entry Options once a signal is confirmed
a. HTF Swing Failure followed by a LTF MSB at Range Extremes
A Swing Failure Pattern (SFP) is a technical analysis concept used in trading to identify potential reversals in price trends. It occurs when the price attempts to surpass a previous high or low but fails to sustain that level, indicating a possible change in market direction. There are multiple methods to define a SFP but this indicator uses the failure to close through a Key Level. When confirmed, HTF SFPs will be displayed on-screen and an alert will fire if enabled.
Example: EURUSD H12 Trade Setup Alerts at Range Extremes on a H1 Chart:
Alerts to Enter at Lower Timeframe MSBs
When enabled, a potential trade setup label and alert will generate when a HTF SFP is confirmed at a Range Extreme followed by a Chart Timeframe (Lower Timeframe) Market Structure Break (MSB). These signals are agnostic to current Market Structure bias and will generate at both extremes.
b. HTF Swing Failure followed by a LTF MSB at HTF POIs:
When enabled, a trade setup label and alert will generate when a HTF SFP is confirmed at an enabled Higher Timeframe POI (Order Blocks / Breakers / FVGs) followed by a Chart Timeframe (Lower Timeframe) Market Structure Break (MSB). These signals are always in line current Market Structure bias.
Example: H12 SFPs and Trade Setups at HTF POIs with Fluid Exits on a H1 Chart:
c. HTF Swing Failure followed by a LTF MSB at All Internal Liquidity Levels ( With Trend and Counter Trend ):
When enabled, a trade setup label and alert will generate when a HTF SFP is confirmed at an Internal Liquidity Level followed by a LTF Market Structure Break (MSB) or Market Structure Shift(MSS). These signals are agnostic to HTF Market Structure bias and will alert to setups with and counter trend.
Example:
d. HTF Swing Failure followed by a LTF MSB at All Internal Liquidity Levels ( With Trend ONLY )
Same as (c), but will only signal trades that are in line with higher timeframe structure. I.e If HTF Structure is bullish, then only bullish trades will be signalled.
e. LTF Swing Failure followed by a LTF MSB at enabled HTF POIs
The system will alert you to a lower timeframe setup if these conditions are met inside enabled HTF POIs (OBs / Breakers / FVGs):
- LTF SFP
- LTF MSB
Example:
f. LTF Entry Options:
IMG PRO provides the following options for LTF Entries:
i. Limit Entry at MSB Level
ii. Limit Entry at Breaker
iii. Limit Entry at Raid Candle
iv. Limit Entry at OTE 70.5% Retracement
v. Market Entries (where applicable)
Trade entry alerts will detail limit entry prices based on the option selected here.
7. Unentered Trade Invalidations:
IMG Pro can invalidate unentered signals based on these custom criteria:
a. Opposite HTF SFP Before Entry
b. TP Hit Before Entry
c. Confirmed Opposite Signal Before Entry
If enabled and criteria met, the system will alert you to cancel any limit orders for the trade that is being invalidated.
8. Trade Exit Types Available with IMG PRO:
The system provides the following options for trade exit alerts:
a. Exit at Fixed R:R
b. Exit at a confirmed Opposite Signal (Fluid Exits)
c. Exit at enabled and untested HTF POIs
d. Exit on an opposite HTF SFP at a liquidity level
Example: H12 SFPs and Potential Trade Setups at Internal Liquidity Levels with Exit at closest untested HTF POI on a H1 Chart:
9. IMG PRO Alerts Overview
The system provides notifications of:
a. Confirmed HTF Market Structure Breaks
b. Confirmed HTF SFPs at Range Extremes
c. Confirmed HTF SFPs at HTF POIs
d. Confirmed HTF SFPs at Liquidity Levels
e. Potential Trade Setups at Range Extremes
f. Potential Trade Setups at HTF Points of Interest
g. Potential Trade Setups at HTF Liquidity Levels
h. LTF SFPs inside HTF POIs
i. Potential LTF Setups at HTF POIs
j. All Exit Types including Stoplosses
k. All Trade Invalidations
To enable alerts, right-click on the indicator and select “Add Alert on IMG ...”. You may customise the alert name as desired and then click 'Create' to finalise the alert setup.
General Note:
There is no system, indicator, algorithm, or strategy that can provide absolute certainty in predicting market movements. Use trading indicators as a tool to assist with trading decisions; manage your risk wisely.
Stay safe and Happy Trading!
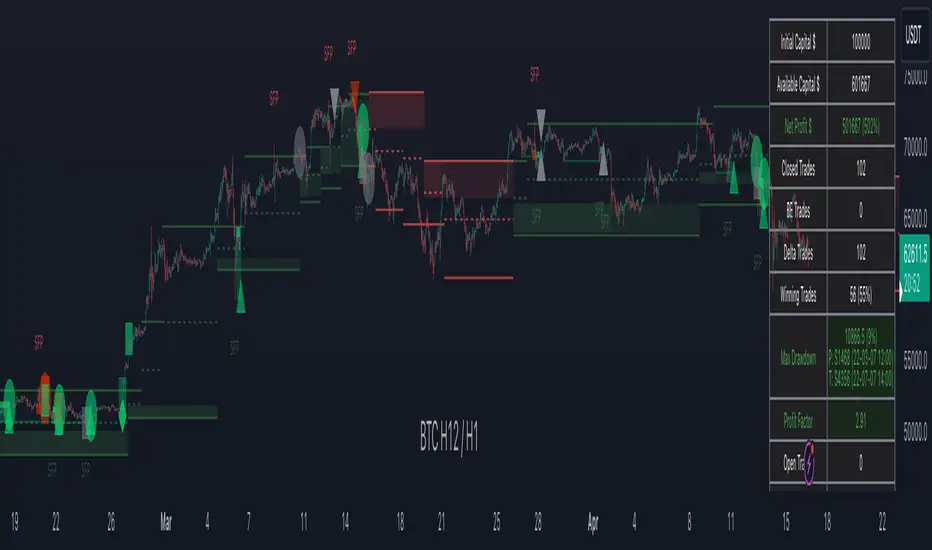
Rapid ICT Suite - MTF Concepts & iFVGTitle: Rapid ICT Suite - MTF Concepts & iFVG
Overview
Unlock a new level of market analysis with the Rapid ICT Suite, a comprehensive, all-in-one indicator designed for the discerning price action trader. This powerful tool merges two distinct analytical engines into one seamless experience, allowing you to overlay critical Higher Timeframe (HTF) market structure onto your current chart while simultaneously tracking real-time Fair Value Gaps (FVGs) and their inversions (iFVGs).
Whether you are a scalper needing to respect 1H structure, a day trader aligning with the 4H bias, or a swing trader mapping the daily trend, this indicator provides the clarity and context you need to make higher-probability trading decisions. It was built from the ground up to solve common issues traders face, delivering stable, precise, and flexible analysis.
The Strategy: Targeting IRL with iFVG Entries
The Destination (The "Why"): Internal Range Liquidity (IRL)
On a Higher Timeframe (HTF), we will identify major Internal Range Liquidity (IRL) zones. In the context of ICT, IRL simply refers to unmitigated Fair Value Gaps (FVGs) that exist within a broader trading range.
These HTF FVGs act as powerful magnets for price. The market will often seek out these zones to rebalance before continuing its next major move. By plotting these on our chart, we establish a clear directional bias and a high-probability target. Our indicator will now label these HTF FVG boxes as "IRL".
The Entry Signal (The "How"): Inverted Fair Value Gaps (iFVG)
Once we have our HTF IRL target, we drop down to our Lower Timeframe (LTF) for execution.
We wait for price to create an Inverted Fair Value Gap (iFVG). An iFVG is a regular FVG that has failed and been traded through, signifying a shift in momentum.
An iFVG appearing on the LTF provides a high-precision entry signal to take a trade in the direction of the HTF IRL zone. It's our confirmation that the market is likely now making its move towards that destination.
Key Features
Multi-Timeframe Order Blocks (Boxes): Automatically identify and plot key HTF demand and supply zones (Order Blocks) onto your chart.
Multi-Timeframe Fair Value Gaps (Boxes): See where HTF imbalances exist, giving you a clear map of institutional reference points and potential targets.
Multi-Timeframe Liquidity Pools (Boxes): Pinpoint where buy-side and sell-side liquidity is likely resting, based on clusters of old highs and lows.
Current Timeframe FVG & iFVG (Lines/Labels): A second, independent engine tracks FVGs on your chosen timeframe, monitors them for mitigation, and automatically identifies when an FVG has been inverted (iFVG), a crucial shift in market dynamics.
The "Rapid" Advantage: Solving Trader Frustrations
This indicator was engineered to overcome three of the most common problems with technical indicators:
1. ✅ No More Flickering or "Ghost" Signals
The Problem: Many indicators show signals on the live, forming candle. This causes zones or signals to appear and disappear ("flicker"), leading to confusion and false entries.
The Solution: The Rapid ICT Suite uses 100% confirmed, closed-candle data for all its calculations (OB, FVG, and Liquidity). A zone will only appear on your chart after the price action that confirms it is complete. This means every signal is stable, reliable, and non-repainting.
2. ✅ Frame-Perfect, Precise Placement
The Problem: Indicators that use lookback logic often draw their signals one candle too late, causing a visual disconnect between the price pattern and the signal itself.
The Solution: We have corrected this common flaw. Every box and line is drawn starting from the exact confirmation candle of the pattern. This frame-perfect precision is critical for accurate analysis and planning your entries.
3. ✅ The Dual Analysis Engine: Uncluttered & Flexible
The Problem: Trying to analyze multiple timeframes at once can lead to cluttered charts and mental overload .
The Solution: This suite contains two independent parts that you can control separately.
Part 1 gives you the macro context—the HTF structure where big moves originate.
Part 2 gives you the micro details—the real-time FVG and iFVG story on your trading timeframe.
Use them together for a complete picture, or toggle one off to focus on a specific aspect of your strategy. This flexibility keeps your workspace clean and your analysis sharp.
How to Use & Settings Explained
The indicator settings are neatly organized into two main parts.
Part 1: MTF Concepts (OB, FVG, Liq)
This section controls the Higher Timeframe boxes that are overlaid onto your current chart.
Higher-TF for OB/FVG/Liq: This is the most important setting. Select the higher timeframe you want to analyze. For example, if you are trading on the 15-minute chart, you might set this to 240 (4-Hour) to see the key 4H zones.
Show Order-Blocks / FVGs / Liquidity: Simple toggles to turn each type of HTF zone on or off.
Max... Count: Controls how many of the most recent zones are displayed on the chart, preventing clutter from old, irrelevant zones.
Part 2: FVG & iFVG (Lines/Labels)
This section controls the second engine, which analyzes FVGs and iFVGs on its own selected timeframe.
Timeframe for FVG/iFVG: Choose the timeframe for this analysis. You can leave it blank to use your current chart's timeframe, or set it to a specific one.
Mitigation Type & Mitigation %: A powerful feature to define when an FVG is considered "used up."
Type: Choose if mitigation is counted from the candle's Wick or Close.
Percent: Set how far price must retrace into an FVG (e.g., 50%) before it is considered mitigated and the lines are removed from your chart.
FVG/iFVG Count: Controls how many of the most recent FVG/iFVG zones are displayed.
Style & Color Settings: Fully customize the appearance of the lines and labels to match your chart theme.
Final Words
This indicator was built to provide actionable clarity. By understanding the interplay between higher-timeframe structure and current price action, you can significantly enhance your trading edge. Thank you for choosing the Rapid ICT Suite.
Happy trading!
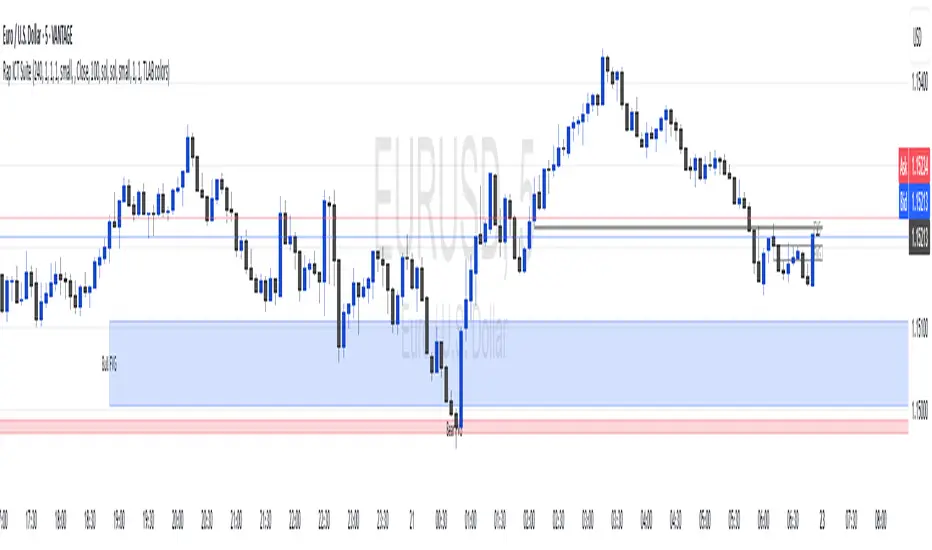
TIME-SPLT ACADEMY INDICATOR# TIME-SPLT ACADEMY CISD + FVG + TSM FRACTALS - Comprehensive Market Structure Analysis Tool
## Overview
This indicator combines three essential market structure analysis components into a unified trading tool: Change in State Direction (CISD), Fair Value Gaps (FVG), and TSM Fractals. This integration provides traders with a complete framework for identifying market structure breaks, price imbalances, and key pivot levels on any timeframe.
## Component 1: CISD (Change in State Direction)
**What it is:** CISD identifies significant breaks in market structure by tracking when price decisively breaks above previous swing highs (bullish CISD) or below previous swing lows (bearish CISD). This concept is fundamental to understanding trend changes and continuation patterns.
**How it works:**
- Monitors swing highs and lows using customizable pivot periods
- Tracks when price closes above a previous swing high (bullish structure break)
- Tracks when price closes below a previous swing low (bearish structure break)
- Draws horizontal lines from the pivot point to the break point with "CISD" labels
- Works on multiple timeframes simultaneously
**Trading Applications:**
- Identifies trend changes and continuation signals
- Provides entry signals on structure breaks
- Helps determine market bias and direction
## Component 2: FVG (Fair Value Gaps)
**What it is:** Fair Value Gaps are price imbalances that occur when there's a gap between the high of one candle and the low of another candle two periods later, with the middle candle not filling this gap. These represent areas where price moved inefficiently and often return to "fill" the gap.
**How it works:**
- Analyzes 3-candle patterns to identify gaps
- Bearish FVG: Gap between low and high where price dropped leaving unfilled space above
- Bullish FVG: Gap between high and low where price rose leaving unfilled space below
- Tracks 8 different candle body combinations for each direction (up, down, doji patterns)
- Monitors gap mitigation when price returns to fill the imbalance
- Changes color when gaps are partially or fully mitigated
**Gap Detection Logic:**
- Bearish FVG patterns: DDD, DDJ, JDD, UDJ, JDU, UDD, DDU, UDU
- Bullish FVG patterns: DUD, DUJ, JUD, UUJ, JUU, UUD, DUU, UUU
- (D=Down candle, U=Up candle, J=Doji candle)
**Trading Applications:**
- High-probability reversal zones when price returns to FVGs
- Support and resistance levels
- Target areas for limit orders
- Risk management reference points
## Component 3: TSM Fractals
**What it is:** TSM Fractals identify significant pivot highs and lows using Williams Fractal methodology. These mark potential reversal points and key support/resistance levels.
**How it works:**
- Identifies fractal highs: peaks where the center candle's high is higher than surrounding candles
- Identifies fractal lows: valleys where the center candle's low is lower than surrounding candles
- Uses customizable lookback periods (default 15) for fractal identification
- Displays horizontal lines with "$" symbols at fractal levels
- Maintains a configurable number of recent fractals on the chart
**Trading Applications:**
- Key support and resistance levels
- Potential reversal zones
- Confluence with other analysis tools
- Stop loss placement reference points
## Why This Combination Works
**Synergistic Analysis:** Each component provides different but complementary information:
1. **CISD** shows when market structure changes, indicating trend shifts or continuation
2. **FVGs** reveal where price has moved inefficiently and may return for rebalancing
3. **Fractals** highlight key pivot points that often act as support/resistance
**Trading Edge:** The combination allows for:
- **Entry Confirmation:** Wait for CISD breaks near unfilled FVGs at fractal levels
- **Risk Management:** Use FVG boundaries and fractal levels for stop placement
- **Target Selection:** Project moves to opposite FVGs or fractal levels
- **Market Context:** Understand whether you're trading with or against structure
## Key Features
**Multi-Timeframe CISD:**
- Customizable timeframe settings (Minute, Hour, Day, Week, Month)
- Adjustable swing length for pivot identification
- Customizable line styles, widths, and colors
- Optional alerts on structure breaks
**Advanced FVG Management:**
- Automatic gap size filtering
- Real-time mitigation tracking
- Color-coded active vs. mitigated gaps
- Optional pip value labels
- Large gap alerts for significant imbalances
**Intelligent Fractal Display:**
- Configurable fractal periods
- Maximum fractal count management
- Clean visual presentation
- Historical fractal preservation
## Settings & Customization
**CISD Settings:**
- Timeframe selection and multipliers
- Swing length adjustment (default 7)
- Line styling options
- Color customization for bullish/bearish breaks
- Alert toggle options
**FVG Settings:**
- Show/hide toggles for each direction
- Minimum gap size filtering
- Alert threshold for large gaps
- Color schemes for active and mitigated gaps
- Optional size labels in pips
**Fractal Settings:**
- Fractal period adjustment (default 15)
- Maximum display count (default 10)
- Show/hide toggle
## Educational Value
This indicator teaches traders to:
- Understand market structure concepts
- Recognize price inefficiencies
- Identify key pivot points
- Combine multiple analysis methods
- Develop systematic trading approaches
## Use Cases
**Swing Trading:** Identify major structure breaks with FVG confluence
**Day Trading:** Use lower timeframe CISDs with intraday FVGs
**Scalping:** Quick entries at FVG mitigation near fractal levels
**Position Trading:** Higher timeframe structure analysis with major FVGs
## Technical Implementation
- Utilizes Pine Script v6 for optimal performance
- Efficient array management for historical data
- Real-time calculations without repainting
- Memory-optimized box and line management
- Multi-timeframe data handling with proper security functions
This comprehensive tool eliminates the need for multiple separate indicators, providing everything needed for complete market structure analysis in one cohesive package. The educational component helps traders understand not just what the signals are, but why they work and how to use them effectively in different market conditions.

GEEKSDOBYTE IFVG w/ Buy/Sell Signals1. Inputs & Configuration
Swing Lookback (swingLen)
Controls how many bars on each side are checked to mark a swing high or swing low (default = 5).
Booleans to Toggle Plotting
showSwings – Show small triangle markers at swing highs/lows
showFVG – Show Fair Value Gap zones
showSignals – Show “BUY”/“SELL” labels when price inverts an FVG
showDDLine – Show a yellow “DD” line at the close of the inversion bar
showCE – Show an orange dashed “CE” line at the midpoint of the gap area
2. Swing High / Low Detection
isSwingHigh = ta.pivothigh(high, swingLen, swingLen)
Marks a bar as a swing high if its high is higher than the highs of the previous swingLen bars and the next swingLen bars.
isSwingLow = ta.pivotlow(low, swingLen, swingLen)
Marks a bar as a swing low if its low is lower than the lows of the previous and next swingLen bars.
Plotting
If showSwings is true, small red downward triangles appear above swing highs, and green upward triangles below swing lows.
3. Fair Value Gap (3‐Bar) Identification
A Fair Value Gap (FVG) is defined here using a simple three‐bar logic (sometimes called an “inefficiency” in price):
Bullish FVG (bullFVG)
Checks if, two bars ago, the low of that bar (low ) is strictly greater than the current bar’s high (high).
In other words:
bullFVG = low > high
Bearish FVG (bearFVG)
Checks if, two bars ago, the high of that bar (high ) is strictly less than the current bar’s low (low).
In other words:
bearFVG = high < low
When either condition is true, it identifies a three‐bar “gap” or unfilled imbalance in the market.
4. Drawing FVG Zones
If showFVG is enabled, each time a bullish or bearish FVG is detected:
Bullish FVG Zone
Draws a semi‐transparent green box from the bar two bars ago (where the gap began) at low up to the current bar’s high.
Bearish FVG Zone
Draws a semi‐transparent red box from the bar two bars ago at high down to the current bar’s low.
These colored boxes visually highlight the “fair value imbalance” area on the chart.
5. Inversion (Fill) Detection & Entry Signals
An inversion is defined as the price “closing through” that previously drawn FVG:
Bullish Inversion (bullInversion)
Occurs when a bullish FVG was identified on bar-2 (bullFVG), and on the current bar the close is greater than that old bar-2 low:
bullInversion = bullFVG and close > low
Bearish Inversion (bearInversion)
Occurs when a bearish FVG was identified on bar-2 (bearFVG), and on the current bar the close is lower than that old bar-2 high:
bearInversion = bearFVG and close < high
When an inversion is true, the indicator optionally draws two lines and a label (depending on input toggles):
Draw “DD” Line (yellow, solid)
Plots a horizontal yellow line from the current bar’s close price extending five bars forward (bar_index + 5). This is often referred to as a “Demand/Daily Demand” line, marking where price inverted the gap.
Draw “CE” Line (orange, dashed)
Calculates the midpoint (ce) of the original FVG zone.
For a bullish inversion:
ce = (low + high) / 2
For a bearish inversion:
ce = (high + low) / 2
Plots a horizontal dashed orange line at that midpoint for five bars forward.
Plot Label (“BUY” / “SELL”)
If showSignals is true, a green “BUY” label is placed at the low of the current bar when a bullish inversion occurs.
Likewise, a red “SELL” label at the high of the current bar when a bearish inversion happens.
6. Putting It All Together
Swing Markers (Optional):
Visually confirm recent swing highs and swing lows with small triangles.
FVG Zones (Optional):
Highlight areas where price left a 3-bar gap (bullish in green, bearish in red).
Inversion Confirmation:
Wait for price to close beyond the old FVG boundary.
Once that happens, draw the yellow “DD” line at the close, the orange dashed “CE” line at the zone’s midpoint, and place a “BUY” or “SELL” label exactly on that bar.
User Controls:
All of the above elements can be individually toggled on/off (showSwings, showFVG, showSignals, showDDLine, showCE).
In Practice
A bullish FVG forms whenever a strong drop leaves a gap in liquidity (three bars ago low > current high).
When price later “fills” that gap by closing above the old low, the script signals a potential long entry (BUY), draws a demand line at the closing price, and marks the midpoint of that gap.
Conversely, a bearish FVG marks a potential short zone (three bars ago high < current low). When price closes below that gap’s high, it signals a SELL, with similar lines drawn.
By combining these elements, the indicator helps users visually identify inefficiencies (FVGs), confirm when price inverts/fills them, and place straightforward buy/sell labels alongside reference lines for trade management.

DD IFVG [Pro+] (Dodgy)Introduction
DD IFVG° is an automated charting tool built to track inversion logic after displacement events—specifically when Fair Value Gaps (FVGs) are closed through and act as an inversion gap. The tool adheres to logic taught by DodgyDD and inspired by Inner Circle Trader (ICT) methodology, offering a clean visual interface to support traders studying price behaviour after liquidity sweeps, FVG closures, and delivery to targets.
This indicator does not draw zones or suggest direction. It operates entirely on confirmed price events and produces logic-bound visuals designed for traders who already understand IFVG-based reasoning and seek visual consistency across sessions and Timeframes.
Key Terms and Definitions
Swing High / Swing Low: A swing high is a local price peak with lower highs on either side. A swing low is a local trough with higher lows on either side. These are used to detect where liquidity may rest and are required for confirming the initial raid condition in the IFVG model.
Liquidity Raid: This occurs when price breaks a prior swing high or low, effectively “sweeping” a level where orders may be clustered. A raid is a required precursor to inversion logic in this model. The tool will not evaluate a potential Fair Value Gap or DD Inversion unless a swing high or low has been taken first.
Fair Value Gap (FVG): A Fair Value Gap is a price imbalance that occurs when a strong move leaves a gap between candles—specifically, when the high of one candle and the low of a later candle do not overlap. FVGs often emerge during displacement and are commonly studied as inefficiencies within a price leg.
DD Inversion: A DD inversion happens when price fully closes through an existing Fair Value Gap after raiding liquidity, suggesting the original imbalance rebalanced, and looks to reverse its original role. For example, when a bearish FVG is closed above after raiding a swing low, it may behave with a change of orderflow (bullish inversion). The tool recognizes IFVGs as “inverted” after a full-body candle closes through the gap post raid.
Displacement: A strong, directional price move—typically with momentum—that leaves a Fair Value Gap behind. Displacement is important in inversion logic, as it creates the context and confidence in comparing and contrasting FVGs and DD Inversions for obvious flips in market behaviour.
DD Line: Once inversion occurs, the tool draws a single horizontal array on the candle's close. It marks the model’s activation level—not a prediction level or a support/resistance zone. It serves as a reference for when model logic is sequentially active.
Opposing Swing: The swing high or low opposite the one that was swept during the initial raid. This becomes the model’s first target for mechanical delivery and is automatically drawn once the DD line is triggered. When price reaches this swing, the model has reached its objective and could offer opportunities for further continuation to additional liquidity pools.
Invalidation: A DD Inversion is considered invalid in one of two scenarios, which the user can toggle individually: a body print back above/below the inversion in bearish/bullish conditions, or trading above/below the most recent swing high/low after the liquidity raid in bearish/bullish conditions. The DD line will continue extending when traded to until the setup is invalidated, or when the Opposing Swing is reached.
Consequent Encroachment (CE): The midpoint (50%) of the FVG or IFVG. This line can be optionally displayed for users who use midpoint reference logic. It is not required by the model’s internal logic but may assist with discretionary interpretation.
Description
At its core, DD IFVG° follows a structured three-step logic sequence: a FVG is created, liquidity is taken, and the Fair Value Gap (FVG) inside of the leg of the raid is closed through, signally a potential orderflow shift. Once inversion is confirmed, a DD line is plotted at the close of the candle that caused the inversion, making it the structural anchor for the model.
The tool does not account for partial fills or candle wicks for FVGs or IFVGs. Only full-body closures through a qualifying FVG are recognized. When this occurs, a bullish or bearish inversion is validated and the model becomes active. From there, the opposing swing (the unswept high or low from the displacement leg) is automatically drawn as the target for the IFVG model.
The model remains active until either the opposing swing is tagged (completion) or Invalidation Condition is triggered (close through DD IFVG, or price violating the liquidity raid swing). Upon invalidation, the DD line turns gray, signalling that the structure is no longer valid for ongoing tracking.
Key Features
The Bias allows traders to define whether to track bullish inversions (closing above bearish FVGs), bearish inversions (closing below bullish FVGs), or neutral for both. This allows isolate directional focus or display all structures on the same chart mechanically.
The Liquidity Timeframe defines the Timeframe for swing highs and lows that are identified for the required liquidity raid. The Chart mode allows analysts to use the active chart Timeframe. Auto enables a custom Timeframe Alignment, explained inside of the setting tooltip. Custom allows for specific frame alignment, which is helpful when syncing with specific higher-Timeframe structure. Session allows the user to use session highs and lows for the liquidity raid. Observe the difference in the DD IFVG's frequency based on different Liquidity Timeframe configurations:
Chart:
Automatic:
Custom (1H):
Session:
The FVG Filter Timeframe requires the DD setup to trade into a FVG before qualifying the raid filter. For instance, setting this to 4H ensures that only setups that form within a 4-hour FVG. This gives analysts an additional filter to qualify the start of the mechanical model.
Session Filter enables traders to define up to four specific Time blocks when the model is permitted to trigger. The Macros Only toggle filters setups further by limiting activation to the first and last 10 minutes of each hour—a filter inspired for intraday traders and scalpers.
The Invalidation Condition determines when a DD inversion is considered not longer valid. Close will maintain the inversion as active until price prints a body past the DD IFVG. Swing will maintain the inversion as active until the most recent swing from the liquidity raid is traded through; in this case a warning will appear once price prints a candle body past the DD IFVG.
Model Style includes customizable controls for the DD line, the opposing swing marker, and invalidated states. Label appearance, line styles, and extension behaviour are fully user-controlled. Traders can also enable the Consequent Encroachment (CE) line, which marks the 50% midpoint of the FVG and IFVG.
An Info Table is available to display current model state, including user bias, active Timeframes, asset, and Time filter. Its position is fully customizable and can be moved to match chart preferences.
How Traders Can Use the Indicator Effectively
DD IFVG° is not meant to identify trade signals, entries, or exits. It is best used as a visual tracker and confluence for structure-based delivery, particularly for those following DodgyDD-style IFVG logic. The tool excels as a companion for:
Journaling and reviewing IFVG-based setups across Timeframes and sessions
Studying structural completion or invalidation behaviour
Tracking delayed deliveries and retracement-based logic
Traders using the tool should be familiar with FVG formation, inversion criteria, and the importance of opposing swing resolution.
Usage Guidance
Add DD IFVG° to a TradingView chart. This is a fractal script and can be applied across any Timeframe or asset pairing depending on your session model and preferences.
Use the DD line to track inversion structure, monitor when inversions are created and negated, and reference the opposing swing to determine whether structural delivery has completed.
Use the DD IFVG° in combination with your own discretion and narrative to assess when the model has flipped, held, or broken.
Terms and Conditions
Our charting tools are products provided for informational and educational purposes only and do not constitute financial, investment, or trading advice. Our charting tools are not designed to predict market movements or provide specific recommendations. Users should be aware that past performance is not indicative of future results and should not be relied upon for making financial decisions. By using our charting tools, the purchaser agrees that the seller and the creator are not responsible for any decisions made based on the information provided by these charting tools. The purchaser assumes full responsibility and liability for any actions taken and the consequences thereof, including any loss of money or investments that may occur as a result of using these products. Hence, by purchasing these charting tools, the customer accepts and acknowledges that the seller and the creator are not liable nor responsible for any unwanted outcome that arises from the development, the sale, or the use of these products. Finally, the purchaser indemnifies the seller from any and all liability. If the purchaser was invited through the Friends and Family Program, they acknowledge that the provided discount code only applies to the first initial purchase of any Toodegrees product. The purchaser is therefore responsible for cancelling – or requesting to cancel – their subscription in the event that they do not wish to continue using the product at full retail price. If the purchaser no longer wishes to use the products, they must unsubscribe from the membership service, if applicable. We hold no reimbursement, refund, or chargeback policy. Once these Terms and Conditions are accepted by the Customer, before purchase, no reimbursements, refunds or chargebacks will be provided under any circumstances.
By continuing to use these charting tools, the user acknowledges and agrees to the Terms and Conditions outlined in this legal disclaimer.

Price Action SuiteThe TRN Price Action Suite incorporates a treasure trove of time and price action concepts. It includes a set of trading tools that, when combined, allow for a more accurate view of the market. This enables traders to find high probability entry points before the market moves to the next liquidation level.
Features of the TRN Price Action Suite:
(Inverse) Fair Value Gaps (FVG)
Order Blocks (OB)
FVG and OB with Cumulative Volume Delta
Volume Imbalances
Market Structure
Liquidity levels
Sessions
Kill zones/Opening Range
The indicator helps traders to easily identify favorable market conditions and high probability trade setups. It automatically finds time and price action concepts and displays them in an intuitive way on the chart. One of the highlights is the detection of Fair Value Gaps and Order Blocks in connection with Cumulative Volume Delta (approx.). You will not find this connection anywhere else.
Fair Value Gaps (FVGs)
A fair value gap occurs when there are inefficiencies in the market or imbalanced buying and selling pressures. Fair value gaps can become a magnet for the price before continuing in the same direction. Special attention should be paid to FVGs that are supported by support and resistance levels, as these offer a higher probability of success for trades. Additionally, the indicator plots inverse FVG (iFVG). These are FVG that are “closed” by a FVG in the other direction. IFVGs are a strong sign of the market to continue in the direction of the iFVG.
In addition to the FVGs you see on the chart, you can add also FVGs from a higher timeframe including the cumulative buy/sell volume. For this you can set “Timeframe 1” and “Timeframe 2” in the settings to your preferred timeframes. E.g. you trade on a 5-minute chart, and you want to see FVGs from 4 hours and a daily chart, then you set Timeframe 1 to 4 h and to Timeframe 2 to 1 D.
Order Blocks and Volume Imbalances can also be shown from higher timeframes.
Order Blocks (OBs)
Order blocks are areas on the chart where a high concentration of limit orders was found in the past. They can serve as potential support or resistance areas. These represent areas in the market where there is an oversupply (supply) or an excess demand (demand). They are often key zones for potential turning points or continuations of the current trend. A bullish OB, for example, is the last bearish candle before a significant uptrend.
FVGs and OBs with Cumulative Volume Delta
The TRN Price Action Suite can show FVGs and OBs with the corresponding Cumulative Volume Delta (CVD). It is a metric to analyze market dynamics by tracking the net difference between buying and selling volumes over a specific timeframe. It is used to determine the strength of the FVG/OB. The FVG/OB includes two bars on the left side, indicating the cumulative buy volume in green as well es the cumulative sell volume in red. At the right side of the FVG/OB box the ratio of the cumulative buy/sell volume is displayed. A high ratio over 1, for example 1.5, indicates a lot of buying pressure. On the hand, a ratio far below 1, for example 0.66, indicates a lot of selling pressure.
Volume Imbalances (VIBs)
Volume Imbalances indicate a price gap from the previous close, but unlike gaps, there is no absence of trading activity within a specific price range. Bullish VIs have opening and closing prices above the previous close, with overlap between the current low and previous high. Bearish VIs are vice versa.
Market Structure
The market structure represents the dominant trend in the market. It is based on swing highs and lows. For instance, if the price makes higher highs (HH) and higher lows (HL) the market structure represents an uptrend. Vice versa if price makes lower lows (LL) and lower highs (LH) the market trend is down.
If the market structure is up, traders can enter positions in a pullback. For this, a trader could use a FVG or an OB as an entry condition.
Market Structure Shift (MSS) (Change of Character (ChoCh))
A market structure shift occurs when the market transitions from one dominant trend to a different one, often signaling a potential change in the underlying market dynamics. A MSS signals the start of a new trend. It signals the change from an uptrend to a down trend and vice versa. Therefore, it is sometimes called change of character (ChoCh). A valid MSS should ideally occur in a strong supply or demand zone. This indicates that the market may be approaching a trend reversal or consolidation.
Break of Structure (BOS)
A break of structure happens when the market breaks out of its established trading range or pattern. The market continues its dominant trend, indicated by the last MSS.
In an uptrend, for example, each time the price breaks through a new high, a "bullish BOS" is formed. This indicates that the market can overcome previous resistance levels and continue to rise.
Levels
One core concept in trading is that price flows to areas of liquidity. Natural liquidity areas are the current day open, high, low (CDO, CDH, CDL) or the previous day high, low, close (PDH, PDL, PDC). The same is true for the current week (CWO, CWH, CWL) and the previous week (PWH, PWL, PWC).
Pay special attention in case some of these levels are close together. Then these levels serve like a magnet for the price. The TRN Price Action Suite indicator can cluster these levels fully automatically together to give the trader the flexibility to focus solely on the trading part.
Sessions
Sessions are the trading hours during which the banks are actively trading. The three main trading sessions:
Asia: Most of the volume from the Asian players are handled within this session.
London: This is where the European players are most active.
New York: In the New York session all the USA players are active as well as all the other American players. Furthermore, a lot of global players are active in this session as well.
Killzones
A kill zone in trading refers to a specific time period during the trading day when the market experiences increased volatility and liquidity. It is an opportunity for traders to capitalize on potential price movements and generate profits. There are several different killzones during the day.
There are three different types of killzones:
Indices/Futures: This one is suitable if you trade products like the ES, NQ, FDAX, CL or Stocks, Options.
Forex: If you trade Forex this setting will mark the most liquid periods of the day.
Opening Range: In case you trade the opening range of the sessions, use this setting.
Trading Example
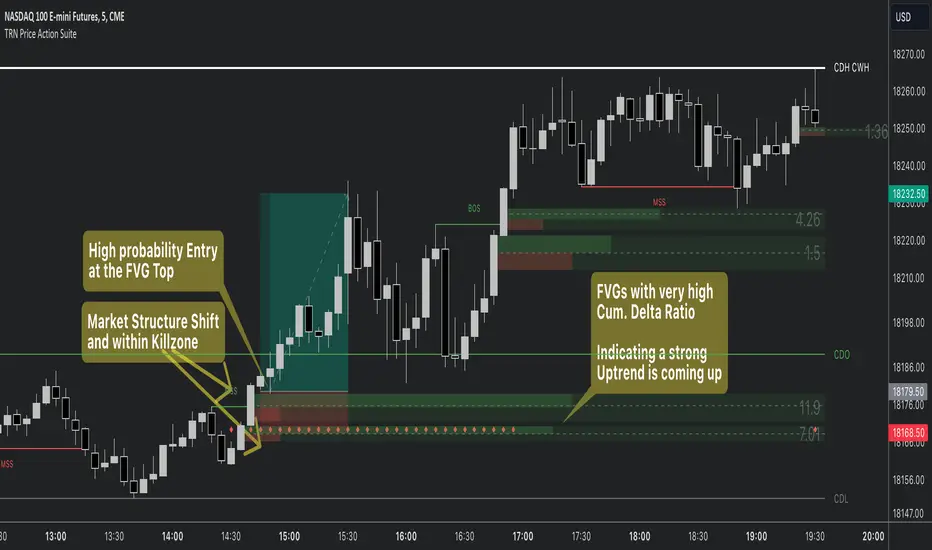
Price Action Toolkit | Flux Charts💎 GENERAL OVERVIEW
Introducing our new Price Action Toolkit indicator! Price Action Toolkit integrates key level strategy , traditional supply-demand analysis , and market structures to help traders in their decisions. Now with features that are available to use in multiple timeframes!
Features of the new Price Action Toolkit indicator :
Volumized Fair Value Gaps (FVGs)
Volumized Order & Breaker Blocks
Identification of Market Structures
Equal Highs & Lows
Buyside & Sellside Liquidity
Premium & Discount Zones
MTF Highs & Lows (Daily, Weekly, Monthly, Pre-Market)
Customizable Settings
📌 HOW DOES IT WORK ?
We believe that the analytical elements that are within this indicator work best when they co-exist with each other on the chart. Trading often requires taking multiple elements into consideration for better accuracy on market analysis. Thus, we combined some of the useful strategies in one indicator for ease of use.
1. Volumized Fair Value Gaps
Fair value gaps often occur when there is an imbalance in the market, and can be spotted with a specific formation on the chart.
The volume when the FVG occurs plays an important role when determining the strength of it, so we've placed two bars on the FVG zone, indicating the high & low volumes of the FVG. The high volume is the total volume of the last two bars on a bullish FVG, while the low volume is - of the FVG. For a bearish FVG, the total volume of the last two bars is the low volume. The indicator can also detect FVGs that exist in other timeframes than the current chart.
2. Volumized Order Blocks
Order blocks occur when there is a high amount of market orders exist on a price range. It is possible to find order blocks using specific formations on the chart.
The high & low volume of order blocks should be taken into consideration while determining their strengths. The determination of the high & low volume of order blocks are similar to FVGs, in a bullish order block, the high volume is the last 2 bars' total volume, while the low volume is the oldest bar's volume. In a bearish order block scenerio, the low volume becomes the last 2 bars' total volume.
3. Volumized Breaker Blocks
Breaker blocks form when an order block fails, or "breaks". It is often associated with market going in the opposite direction of the broken order block, and they can be spotted by following order blocks and finding the point they get broken, ie. price goes below a bullish order block.
The volume of a breaker block is simply the total volume of the bar that the original order block is broken. Often the higher the breaking bar's volume, the stronger the breaker block is.
4. Market Structures
Sometimes specific market structures form and break as the market fills buy & sell orders. Formed Change of Character (CHoCH) and Break of Structure (BOS) often mean that market will change direction, and they can be spotted by inspecting low & high pivot points of the chart.
5. Equal Highs & Lows
Equal Highs & Lows occur when there is a significant amount of difference between a candle's close price and it's high / low value, and it happens again in a specific range. EQH and EQL usually mean there is a resistance that blocks the price from going further up / down.
6. Buyside & Sellside Liquidity
Buyside & Sellside Liquidity zones are where most traders place their take-profits and stop-losses in their long / short positions. They are spotted by using high & low pivot points on the chart.
7. Premium & Discount Zones
The premium zone is a zone that is over the fair value of the asset's price, and the discount zone is the opposite. They are formed by the latest high & low pivot points.
8. MTF Highs / Lows
MTF Highs / Lows are actually pretty self-explanatory, you can enable / disable Daily, Weekly, Monthly & Pre-Market Highs and Lows.
🚩UNIQUENESS
Our new indicator offers a comprehensive toolkit for traders, combining multiple analytical elements with customizable settings to aid in decision-making across different market conditions and timeframes. The volumetric information of both FVGs and Order & Breaker Blocks will be present in your chart to serve you greater detail about them. The indicator also efficiently identifies market structures, liquidity zones and premium & discount zones to give you an insight about the current state of the market. And finally with the use of multiple timeframes , you can easily take a look at the bigger picture. We recommend reading the "How Does It Work" section of the descripton to get a better understanding about how this indicator is unique to others.
⚙️SETTINGS
1. General Configuration
Show Historic Zones -> This will show historic Fair Value Gaps, Order & Breaker Blocks and Sellside & Buyside liquidities which are expired.
2. Fair Value Gaps
Enabled -> Enables / Disables Fair Value Gaps
Volumetric Info -> The volumetric information of the FVG Zones will be rendered if activated.
Zone Invalidation -> Select between Wick & Close price for FVG Zone Invalidation.
Zone Filtering -> With "Average Range" selected, algorithm will find FVG zones in comparison with average range of last bars in the chart. With the "Volume Threshold" option, you may select a Volume Threshold % to spot FVGs with a larger total volume than average.
FVG Detection -> With the "Same Type" option, all 3 bars that formed the FVG should be the same type. (Bullish / Bearish). If the "All" option is selected, bar types may vary between Bullish / Bearish.
Detection Sensitivity -> You may select between Low, Normal or High FVG detection sensitivity. This will essentially determine the size of the spotted FVGs, with lower sensitivies resulting in spotting bigger FVGs, and higher sensitivies resulting in spotting all sizes of FVGs.
3. Order Blocks
Enabled -> Enables / Disables Order Blocks
Volumetric Info -> The volumetric information of the Order Blocks will be rendered if activated.
Zone Invalidation -> Select between Wick & Close price for Order Block Invalidation.
Swing Length -> Swing length is used when finding order block formations. Smaller values will result in finding smaller order blocks.
4. Breaker Blocks
Enabled -> Enables / Disables Breaker Blocks
Volumetric Info -> The volumetric information of the Breaker Blocks will be rendered if activated.
Zone Invalidation -> Select between Wick & Close price for Breaker Block Invalidation.
5. Timeframes
You can set and enable / disable up to 3 timeframes. Note that only higher timeframes than the current chart will work.
6. Market Structures
Break Of Structure ( BOS ) -> If the current structure of the market is broken in a bullish or bearish direction, it will be displayed.
Change Of Character ( CHoCH ) -> If the market shifts into another direction, it will be displayed.
Change Of Character+ ( CHoCH+ ) -> This will display stronger Change Of Characters if enabled.
7. Equal Highs & Lows
EQH -> Enables / Disables Equal Highs.
EQL -> Enables / Disables Equal Lows.
ATR Multiplier (0.1 - 1.0) -> Determines the maximum difference between highs / lows to be considered as equal. Lower values will result in more accurate results.
8. Buyside & Sellside Liquidity
Zone Width -> Determines the width of the liquidity zones, 1 = 0.025%, 2 = 0.05%, 3 = 0.1%.
9. Premium & Discount Zones
Enabled -> Enables / Disables Premium & Discount Zones.
10. MTF Highs / Lows
You can enable / disable Daily, Weekly, Monthly & Pre-Market Highs and Lows using this setting. You can also switch their line shapes between solid, dashed and dotted.

Radi IQ [TradingIQ]Introducing "Radi IQ".
Radi IQ is a comprehensive market structure indicator designed to provide traders with a detailed view of key price levels and market behavior. It combines several analytical methods—including internal and external structure analysis, fair value gaps, order blocks, breaker blocks, rejection blocks, premium discount zones, equal levels, directional liquidity grabs, and trend meters —to help users better understand areas of support and resistance, potential turning points, and liquidity events in the market.
Key Components and Their Functions
Market Structure Analysis
Internal and External Structure : The indicator evaluates market structure on two levels. The internal analysis focuses on immediate price action (e.g., recent support/resistance and swing points), while the external analysis uses a higher timeframe to provide context. This dual approach helps to confirm the strength of key levels by comparing short-term moves with the broader market trend.
Break of Structure (BoS) and Change of Character (CHoCH) : These signals highlight moments when the market shifts its behavior. A BoS indicates that a previous level of support or resistance has been overcome, while a CHoCH signals a change in the market’s character. Both are marked clearly on the chart using distinct color codes.
Break of Structure + (BoS+) and Change of Character + (CHoCH+) : These signals highlight moments when the market shifts its behavior and is confirmed by prior price action. A BoS + indicates that a previous level of support or resistance has been overcome, while price action achieves higher highs and higher lows (resistance break) or lower highs and lower lows (support break). CHoCH + signals a change in the market’s character when supported by prior price action - lower highs for a support break and higher lows for a resistance break.
BoS and CHoCH
The image above shows BoS and CHoCH identified on the price chart, and explains what each signifies.
A Break Of Structure (BoS) occurs when price decisively moves beyond a previously established support or resistance level. It indicates that the current trend or market pattern is being challenged, and the market may be ready to change direction.
A Change of Character (CHoCH) describes a shift in how the market behaves. A CHoCH occurs when, in an uptrend, a previously established support level breaks, or in a downtrend, a previously established resistance level breaks.
This break indicates that the market's typical structure is shifting, suggesting that the current trend may be losing its strength and that a reversal or a new trend could be developing.
CHoCH+
The image above explains CHoCH+ and how it forms, while highlighting an instance where a downside CHoCH+ formed following lower highs.
A Change of Character + (CHoCH+) describes a shift in how the market behaves that is supported by prior price action. For support breaks, price must form lower highs before breaking support.
The image above explains CHoCH+ for resistance breaks, while highlighting an instance where a resistance point broke that was supported by prior price action.
BoS+
The image above explains BoS+ and how it forms, while highlighting an instance where an upside BoS+ formed following higher highs and higher lows.
A BoS+ resistance break requires higher highs and higher lows prior to the resistance point being closed over.
The image above explains BoS+ support break, while highlighting an instance where a downside BoS+ formed following lower highs and lower lows.
A BoS+ support break requires lower highs and lower lows prior to the support point being closed under.
Future BoS and CHoCH
Radi IQ also displays where the next BoS and CHoCH points are located.
The image above shows the feature in action. With this, traders will always know where the next key support/resistance breakpoints are before they actually occur.
Fair Value Gaps (FVG)
The indicator identifies gaps in the price where little or no trading occurred—known as fair value gaps. These gaps can act as temporary support or resistance and may indicate areas where the market is likely to correct. FVGs are displayed with clear color gradients that differentiate between upward and downward gaps.
The image above shows an identified upside FVG. In the image, the identified upside FVG acted as a support point for price.
The image above shows an identified downside FVG. In the image, the identified downside FVG acted as a resistance point for price.
Low Volume FVG
In addition to identifying trading FVGs - Radi IQ can also specifically detect low volume fair value gaps. Ideally, these fair value gaps will form inside a low volume node on a volume profile.
Low volume node FVGs are important because these are areas where very little trading occurred and is confirmable, indicating an imbalance in supply and demand. Since few trades took place there, the market often moves quickly through these zones when revisited, which can lead to rapid price changes. This "gap" in trading activity can serve as a signal for potential reversals or fast moves, offering opportunities to enter or exit positions based on expected market behavior.
The image above shows identified FVGs that formed on low volume.
Large Area FVGs
Radi IQ is also capable of filtering out “inconsequential” FVGs. With this, Radi IQ can be enabled to only mark FVGs that cover a wide price range.
The image above shows the feature enabled, and all identified FVGs formed with a wide price range.
Large Area FVGs and Low Volume FVGs Combined
Traders can also enable Radi IQ to only mark FVGs that form on low volume and have a wide price range - allowing traders to only identify the highest quality FVGs on the chart.
Order Blocks and Premium Discount Zones
Order Blocks: Radi IQ detects areas where large orders have previously been placed by institutional traders. These blocks can act as strong levels of support or resistance, and the indicator marks bullish and bearish order blocks with dedicated colors.
What is an order block?
Order blocks are clusters of orders that institutions have executed to enter or exit a market position. They typically form when there is a period of consolidation before a significant move. For example, the last bullish candle before a strong down move may indicate a supply order block, while the last bearish candle before a sharp rally might be considered a demand order block.
Why They Form:
Institutions don’t trade in small, sporadic amounts; they accumulate or distribute large volumes of an asset. To avoid slippage and minimize market impact, they execute these orders over a zone rather than at a single price point. This creates a recognizable “block” on the chart.
Order Block Identification Types
Strength Score
The “Strength Score” order block detection mode is a TradingIQ proprietary ranking system for identified order blocks.
Purpose
The purpose of the “Strength Score” ranking system is to determine the “strength” or significance of an order block and rate the zone’s likelihood to act as support/resistance when retested in the future.
The scoring system ranks from 0 - 10, with “0” indicating a “weak” score or low likelihood of acting as a key support/resistance level when retested in the future.
A rating of “5” indicates a “moderate” score, indicating that the order block has a moderate likelihood of acting as a key support/resistance level when retested in the future.
A rating of “10” indicates a “strong” score, indicating that the order block has a strong likelihood of acting as a key support/resistance level when retested in the future.
How It Works
The score is calculated by examining the price move following the formation of an order block. The stronger the price move after an order block forms - the higher the Strength Score.
The image above shows a bearish order block with a score of “5” identified on the chart. The order block successfully operates as a resistance point when retested.
The image above shows a bullish order block with a score of “5” identified on the chart. The order block successfully operates as a resistance point when retested.
Volume-Based
The volume-based order block detection method detects traditional order blocks, but goes one step further by identifying the highest concentration point of volume for the bar and drawing the order block around this concentration point.
Key features when using the volume-based order block detection method:
The top of the order block is anchored to the top of the highest volume concentration point of the bar
The bottom of the order block is anchored to the bottom of the highest volume concentration point of the bar
The total volume that went into creation of the order block is displayed on the chart
The total volume of the order block is recorded as a percentage relative to the total volume for all order blocks on the chart
The image above shows the detection method in action.
Breaker Blocks
A breaker block is a specific type of order block that gains significance when price breaks through it and then often retests the level as a new area of support or resistance. Essentially, it’s a zone where, after the initial break, the previous level (which once acted as strong support or resistance) flips roles. For example, in an uptrend, if the price falls below a key support level, that level can become a breaker block and act as resistance if the price tries to move back up. Conversely, in a downtrend, a broken resistance level can serve as new support. Traders monitor breaker blocks because they often mark a shift in market sentiment and can provide potential entry or exit points once the market re-engages with these levels.
The image above shows a breaker block above price acting as resistance.
The image above shows a breaker block below price acting as support.
Rejection Blocks
A rejection block is a price area where the market shows a strong unwillingness to move beyond a certain level. This typically happens when price approaches a specific level but then is quickly rejected, leading to a bounce in the opposite direction. In other words, a rejection block forms when traders' orders create a barrier, causing the price to reverse rather than break through. Traders watch these areas closely, as they often signal a strong concentration of supply or demand that could provide potential entry or exit points for trades.
The image above shows both a verified upside rejection block acting as resistance, and an untested downside rejection block.
Rejection blocks are expected to function as strong support/resistance points when retested in the future.
Premium Discount Zones
Premium Discount Zones : These zones reflect areas where price is trading above (premium) or below (discount) a fair value range. They help traders gauge whether the current market price is relatively high or low compared to historical averages.
Premium Discount Zones account for recent swing highs and lows to calculate a fair value along with discount and premium prices over an intermediate time window.
The image above shows the premium and discount price zones in action.
Equal Levels
The indicator also tracks and highlights equal levels, which occur when the market repeatedly tests the same price levels. Equal levels can reinforce the significance of a support or resistance area and are represented by their own set of color markers.
The image above shows Radi IQ distinguishing equal highs and equal lows.
Equal Highs
When you see two or more highs that are approximately the same, it suggests that the market is repeatedly rejecting attempts to push higher. This signals a strong resistance level where sellers (or stop-hunters) are active.
Equal Lows
Similarly, consecutive lows at the same level indicate strong support, where buyers step in consistently, preventing further decline.
Strong Highs and Lows
Strong High
A strong high is a price level where the market repeatedly fails to push higher. Typically, it’s characterized by:
Rejection: Price approaches the high but then reverses sharply, often leaving long upper wicks on the candlestick chart.
Consolidation: Multiple bars might show highs that are very close in value (often termed "equal highs"), indicating a well-established resistance zone.
Market Sentiment: This pattern suggests that sellers are actively defending that level, preventing further upward movement.
Strong Lows
Conversely, a strong low is a price level where the market repeatedly fails to break lower. It is identified by:
Bounce Back: Price touches the low and then rebounds sharply, often leaving long lower wicks.
Consistency: Multiple lows occur around the same level (sometimes referred to as "equal lows"), marking a solid support area.
Market Sentiment: This indicates that buyers are stepping in at that level, absorbing selling pressure and supporting the price.
The image above shows Radi IQ detecting both a strong high and strong low, while the detected strong low acts as support when retested.
Liquidity Grabs
Liquidity grabs occur when the market temporarily moves to absorb liquidity, often triggering stop-loss orders and leading to rapid price movements. Radi IQ flags these events by identifying conditions where price moves against recent pivots, helping traders spot potential liquidity-related reversals or breakouts.
The image above shows Radi IQ identifying both an upside liquidity grab and a downside liquidity grab.
Upside Liquidity Grab (Bearish)
An upside liquidity grab happens when the price moves above a well-known resistance area or recent high. This move is often short-lived.
Many traders place stop-loss orders or pending buy orders just above resistance levels. Institutional players may intentionally push price upward to trigger these orders, thereby “grabbing” the liquidity available at that level.
Downside Liquidity Grab (Bullish)
A downside liquidity grab is the mirror image: the price briefly dips below a key support level or recent low.
Traders often place stop-loss orders or pending sell orders just below support levels. An intentional drop below this support can trigger these stops, allowing institutional players to capture liquidity.
Multi-Timeframe Analysis and Swings
By using data from different timeframes, Radi IQ offers a broader perspective on market trends. It highlights significant swing highs and swing lows, providing visual cues that indicate the market’s directional bias. This feature assists traders in identifying both short-term opportunities and long-term trends.
The image above shows Radi IQ detecting higher swings and lower swings.
IQ Meters / Fibometer
IQ Meters (Fibometers) are a proprietary TradingIQ tool that allows traders to easily identify the highs and lows of the current trend and where current price is relative to these points.
The image above depicts the IQ Meters—an exclusive TradingIQ tool designed to help traders evaluate trend strength and retracement opportunities.
When the lower timeframe Zig Zag IQ and the higher timeframe Zig Zag IQ are out of sync (i.e., one is uptrending while the other is downtrending, with no active positions), the meters display a neutral color as shown in the image.
The key to using these meters is to identify trend unison and pinpoint key trend retracement entry opportunities. Fibonacci retracement levels for the current trend are interlaced along each meter, and the current price is converted to a retracement ratio of the trend.
These meters can mathematically determine where price stands relative to the larger and smaller trends, aiding in identifying entry opportunities.
The top of each meter indicates the highest price achieved during the current price move.
The bottom of each meter indicates the lowest price achieved during the current price move.
When both the larger and smaller trends are in sync and uptrending, or when a long position is active, the IQ meters turn green, indicating uptrend strength.
When both meters are green, it indicates uptrend strength as both the higher timeframe trend and lower timeframe trend are in unison. Look for price to retrace to key fibonacci retracement levels during this time period.
When both trends are in sync and downtrending, or when a short position is active, the IQ meters turn red, indicating downtrend strength.
When both meters are red, it indicates downtrend strength as both the higher timeframe trend and lower timeframe trend are in unison. Look for price to retrace to key fibonacci retracement levels during this time period.
Summary
Radi IQ serves as a robust, data-driven tool for traders who seek a deeper understanding of market structure. By integrating internal and external analysis, fair value gap detection, order block identification, premium discount zoning, equal level tracking, liquidity grabs and much more into one indicator, it offers a multi-layered view of the market. This helps traders not only recognize potential turning points and areas of market stress but also manage risk more effectively and plan their trades with greater precision. The indicator’s clear visual representation and dynamic updates make it a practical addition to any trader’s toolkit.
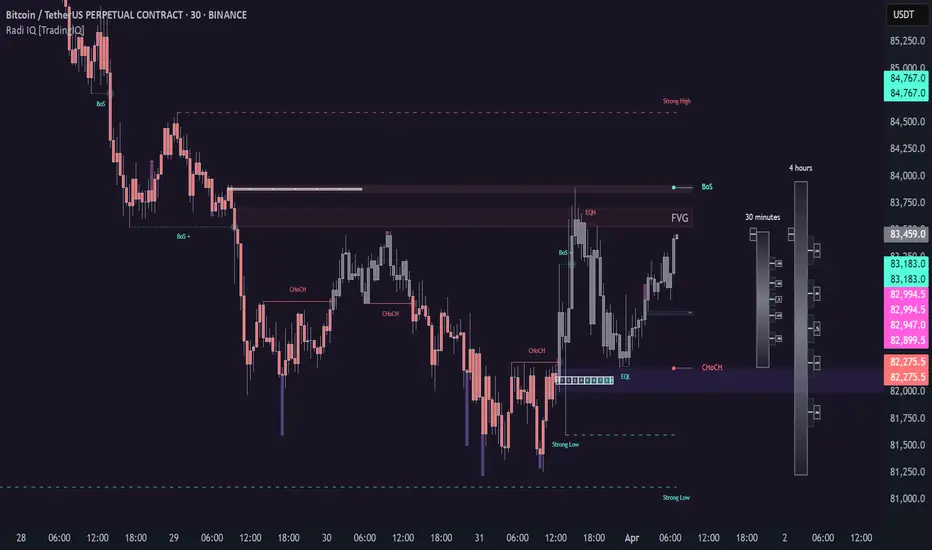
Trident Pattern [SpeculationLab]This indicator is based on the increasingly popular Trident strategy, and is best suited for the 30-minute timeframe. It performs particularly well on naturally bullish instruments such as gold, Bitcoin, and Nasdaq.All components of this indicator are original work by Speculation Lab.
Rather than stacking random features, this script is designed as a modular structure where each part works in synergy to build the Trident logic.
🔧 Modules Included:
Session Highlight — Visual display of the London Kill Zone
5 Customizable EMAs — Fully adjustable length, color, and toggling
Bullish Fair Value Gap (FVG) detection
Four types of Doji candlestick recognition
🧫 Logic Breakdown:
1. Time Session Filter
By default, the indicator highlights the London Kill Zone, defined as 03:00–06:30 New York time.Users can freely adjust the time zone, time range, and background color, with preconfigured zones including New York, London, Tokyo, Shanghai, and Sydney.
⚠️ Note: To maintain flexibility, the London Kill Zone is not enforced as a mandatory entry condition.
Users may apply it as an optional filter based on their own trading style.
2. 5 EMA Trend Filter
The script uses a five-EMA structure to confirm market trend.The default EMA lengths are 5, 9, 13, 21, and 200.A valid entry requires:
EMAs 5, 9, 13, 21 stacked in descending order
AND the 1-hour close is above EMA(200)
All EMAs are fully customizable and can be toggled on/off.
3. Bullish Fair Value Gap (FVG)
Bullish FVGs are detected using a 3-bar logic, from high to low .To filter noise, the gap must be greater than 0.7 × ATR(14) by default.Both the ATR period and multiplier are adjustable.
The FVG Extend setting has two roles:
It controls how many bars the FVG box extends to the right (default: 20)
It defines the active window for confirming entries within the FVG zone
Users can fully customize the box color, text, and center line.
4. Doji Detection
The script detects four types of Doji candlesticks:
Standard Doji
Long-legged Doji
Dragonfly Doji
Gravestone Doji
The Body Ratio setting controls how small the candle body must be relative to the full range (default ≤ 0.1).Long Wick Ratio and Short Wick Ratio further help fine-tune wick length criteria.
✅ Entry Signal Logic:
A Trident entry is confirmed when all the following conditions are met:
Trend Filter Passes
EMAs are stacked: 5 > 9 > 13 > 21
1H close is above EMA(200)
A Doji candle appears inside an active FVG zone
The next candle closes below the Doji’s high
If all conditions are satisfied, a Trident signal is triggered at the close of the confirming candle.
⚠️ Disclaimer
This indicator is intended for educational and research purposes only. It does not constitute financial advice or trading signals.Trading involves high risk. Please act according to your own risk management.Speculation Lab and the author bear no responsibility for any financial outcomes resulting from the use of this script.
本指标基于近年来日益流行的 Trident(三叉戟)策略,推荐使用在 30分钟时间框架,尤其适用于黄金、比特币、纳斯达克等具有自然上涨倾向的交易品种。本指标由 Speculation Lab 原创开发,结构严谨,逻辑清晰。
本指标采用模块化设计,各部分功能相辅相成,共同构建三叉戟策略逻辑,而非杂乱堆砌。
🔧 指标包含以下功能模块:
交易时段高亮 — 默认显示 伦敦杀戮区
五条可调节 EMA 均线 — 长度与颜色可自定义,模块可单独开关
看涨 Fair Value Gap(公平价值缺口)检测
四种 Doji(十字星)K线形态识别
🧫 逻辑说明:
1. 交易时段过滤
默认高亮显示的伦敦杀戮区为 纽约时间03:00–06:30。用户可自由调整 参考时区、具体时段和 背景颜色,支持预设时区包括纽约、伦敦、东京、上海和悉尼。
⚠️ 说明:为保持策略灵活性,伦敦杀戮区并非强制入场条件。
是否采用此过滤,可由用户自行决定。
2. 趋势过滤(五条EMA)
该指标采用五条 EMA 来确认市场趋势。默认长度为 5、9、13、21、200。入场信号要求满足以下条件:
EMA 5、9、13、21 从上到下依次排列(多头排列)
且 1小时图上的收盘价高于 EMA200
所有均线均可单独启用/关闭,长度与颜色均可自定义。
3. 看涨 FVG 区域识别
FVG 使用 3 根K线结构进行检测,从 high 到 low 。默认要求缺口 大于等于 0.7 × ATR(14),以过滤微小无效缺口。ATR周期与乘数均可自定义设置。
“FVG Extend”参数有两个作用:
控制图表上 FVG 区域箱体的右延伸长度(默认20根K线)
用作 FVG 活跃期的判断标准,仅在此区间内出现的 Doji 才会被视为有效信号触发条件
用户可自由设置 FVG 的背景颜色、文字样式与中线颜色。
4. Doji(十字星)识别
支持以下四种常见 Doji 形态识别:
标准十字星
长腿十字星
蜻蜓线(下影线长)
墓碑线(上影线长)
“Body Ratio” 控制实体占K线全长的比例,默认不超过0.2。“Long Wick Ratio” 与 “Short Wick Ratio” 可进一步调节影线长度识别标准。
✅ 入场信号逻辑:
符合以下所有条件时,触发三叉戟入场信号:
趋势过滤通过
EMA 依次排列为 5 > 9 > 13 > 21
且 1小时收盘价高于 EMA200
在 FVG 区域内出现有效 Doji 十字星
下一根K线收盘价 低于 Doji 的最高价
若以上条件均满足,则在确认K线收盘时触发三叉戟入场信号。
⚠️ 免责声明 Disclaimer
本指标旨在提供技术分析工具,仅用于教育与研究目的,不构成任何投资建议或交易指令。交易具有高风险,请根据自身风险承受能力合理操作。使用本脚本所导致的任何盈亏,作者与 Speculation Lab 不承担任何责任。
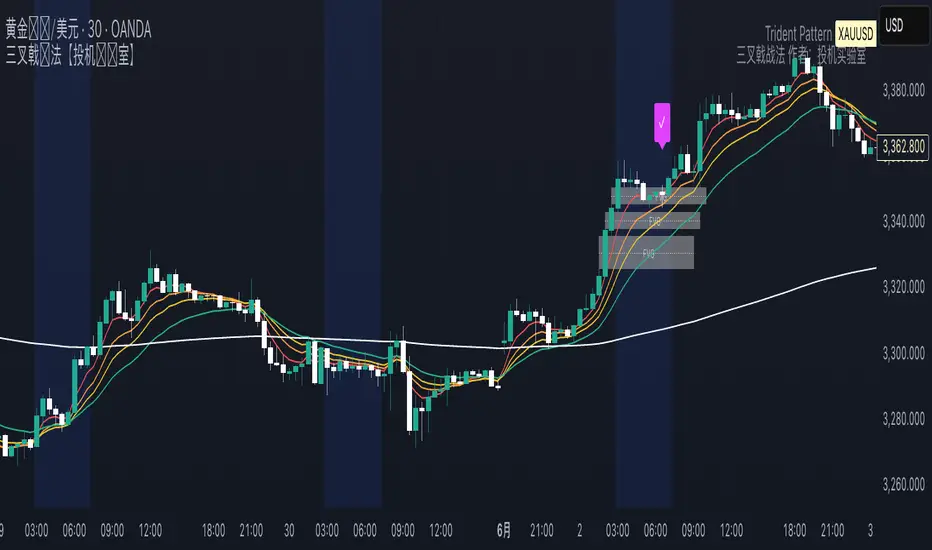
cd_full_poi_CxOverview
This indicator tracks the price in 16 different time frames (optional) in order to answer the question of where the current price has reacted or will react.
It appears on the chart and in the report table when the price approaches or touches the fvg or mitigations (order block / supply-demand), the rules of which will be explained below.
In summary, it follows the fvg and mitigations in the higher timeframe than the lower timeframe.
Many traders see fvg or mitigates as an point of interest and see the high, low swept in those zones as a trading opportunity. Key levels, Session high/lows and Equal high and lows also point of interest.
If we summarise the description of the point of interest ;
1- Fair value gaps (FVG) (16 time frames)
2- Mitigation zones (16 time frames)
3- Previous week, day, H4, H1 high and low levels
4- Sessions zones (Asia, London and New York)
5- Equal high and low levels are in indicator display.
Details:
1- Fair Value Gaps : It is simply described as a price gap and consists of a series of 3 candles. The reaction of the price to the gap between the 1st and 3rd candle wicks is observed.
The indicator offers 3 options for marking. These are :
1-1- ‘Colours are unimportant’: candle colours are not considered for marking. Fvg formation is sufficient.(Classical)
1-2- ‘First candle opposite colour’ : when a price gap occurs, the first candle of a series of 3 candles must be opposite.
For bullish fvg : bearish - bullish - free
For Bearish fvg : bullish - bearish - free
1-3- ‘All same colour’ : all candles in a series of 3 candles must be the same direction.
For bullish fvg: bullish - bullish - bullish
For bearish fvg : bearish - bearish – bearish
Examples:
2- Mitigation zones: Opposite candles with a fvg in front of them or candles higher/lower than the previous and next candle and with the same colour as the fvg series are marked.
Examples :
3- Previous week, day, H4, H1 high and low levels
4- Sessions regions (Asia, London and New York)
5- Equal high and low levels:
Annotation: Many traders want to see a liquidity grab on the poi, then try to enter the trade with the appropriate method.
Among the indicators, there is also the indication of grabs/swepts that occur at swing points. It is also indicated when the area previously marked as equal high/low is violated (grab).
At the end, sample setups will be shown to give an idea about the use of the indicator.
Settings:
- The options to be displayed from the menu are selected by ticking.
- 1m, 2m, 3m, 5m, 5m, 10m, 15m, 30m, h1, h4, h4, h6, h8, h12, daily, weekly, monthly and quarterly, 16 time zones in total can be displayed.
- The ‘Collapse when the price touches mitigate’ tab controls whether to collapse the box as the price moves into the inner region of the mitigate. If not selected, the size of the mitigate does not change.
- ‘Approach limit =(ATR / n)’ tab controls how close the price is to the fvg or mitigate. Instant ATR(10) value is calculated by dividing by the entered ‘n’ value.
- All boxes and lines are automatically removed from the screen when the beyond is closed.
- Colour selections, table, text features are controlled from the menu.
- Sessions hours are set as standard hours, the user can select special time zones. Timezone is set to GMT-4.
- On the candle when the price touches fvg or mitigate, the timeframe information of the POI is shown in the report table together with the graphical representation.
The benefits and differences :
1- We can evaluate the factors we use for setup together.
2- We are aware of what awaits us in the high time frame in the following candles.
3- It offers the user the opportunity to be selective with different candle selection options in fvg selection.
4- Mitige areas are actually unmitige areas because they have a price gap in front of them. The market likes to retest these areas.
5- Equal high/low zones are the levels that the price creates to accumulate liquidity or fails to go beyond (especially during high volume hours). Failure or crossing of the level may give a reversal or continuation prediction.
Sample setup 1:
Sample setup 2:
Sample setup 3:
Cheerful trades…
Enjoy…

DT_KEY_LEVELSDT_Key_Levels: Powerful Market Structure Analysis Indicator
DT_Key_Levels is an advanced indicator for fundamental market structure analysis, optimized for higher timeframes (D1, W, M). The indicator combines three powerful technical analysis tools — fractals, Fair Value Gaps (FVG), and psychological levels — in one comprehensive solution.
Three Components of the Indicator
1. Enhanced Fractal System
The indicator uses an improved version of Bill Williams' classic fractals, allowing for deeper market structure analysis:
Dual Identification System:
Standard 5-bar fractals (displayed with thick lines) for analyzing reliable support/resistance levels
Light 3-bar fractals (displayed with thin lines) for early identification of potential reversal points
Intelligent Tracking System:
Automatic detection and filtering of completed fractals
Marking fractals with corresponding timeframe designation (HTF-1D, HTF-1W, HTF-1M)
Tracking and marking the All-Time High (ATH)
2. Fair Value Gaps (FVG) System
The indicator identifies and visualizes price gaps in market structure — zones that often act as magnets for future price movements:
Precise Identification of Inefficient Zones:
Bullish FVG: when the current candle's low is above the -2 candle's high
Bearish FVG: when the current candle's high is below the -2 candle's low
Detailed Visualization:
Clear display of upper and lower boundaries of each FVG
Midline (0.5 FVG) for determining key reaction levels within the gap
Marking each FVG with "FF" (Fair value Fill) label for quick identification
Dynamic Management:
Automatic removal of FVGs when they are filled by price movement
Customizable line extension for improved tracking of target zones
3. Intelligent Psychological Levels
The indicator automatically determines key psychological levels with adaptation to the type of instrument being traded:
Specialized Calibration for Various Assets:
Forex (EUR/USD, GBP/USD, USD/JPY): optimization for standard figures and round values
Precious metals (XAUUSD): adaptation to typical gold reaction zones with a $50 step
Cryptocurrencies (BTC, ETH): dynamic step adjustment depending on current price zone
Stock indices (NASDAQ, S&P500, DAX): accounting for the movement characteristics of each index
Smart Adaptation System:
Automatic determination of the optimal step for any instrument
Generation of up to 24 key levels, evenly distributed around the current price
Intelligent filtering to display only significant levels
Practical Application
Strategic Analysis
Identifying Key Structural Levels:
Use monthly and weekly fractals to determine strategic support/resistance zones
Look for coincidences of fractals with psychological levels to identify particularly strong zones of interest
Determine long-term barriers using type 5 fractals on higher timeframes
Analysis of Market Inefficiencies:
Track the formation of FVGs as potential targets for future movements
Use FVG midlines (0.5) as important internal reaction levels
Analyze the speed of FVG filling to understand trend strength
Tactical Trading Decisions
Entry Points and Risk Management:
Use bounces from fractals in the direction of the larger trend as a signal for entry
Place stop-losses behind fractal levels or key psychological levels
Monitor the formation of new fractals as a signal of potential reversal
Determining Target Levels:
Use unfilled FVGs as natural price targets
Apply nearby psychological levels for partial position closing
Project higher timeframe fractals to determine long-term goals
Indicator Advantages
Comprehensive Approach: combining three methodologies for a complete understanding of market structure
Intelligent Adaptation: automatic adjustment to the characteristics of different types of assets
Clean Visual Presentation: despite the abundance of information, the indicator maintains clarity of display
Effective Signal Filtering: automatic removal of completed levels to reduce visual noise
Higher Timeframe Optimization: specifically designed for daily, weekly and monthly charts
Usage Recommendations
Use the indicator only on D1, W, and M timeframes for the most reliable signals
Pay special attention to areas where different types of signals coincide (e.g., fractal + psychological level)
Use higher timeframe fractals as key zones for medium and long-term trading
Track FVGs as potential target zones and focus on their filling

The Ultimate Indicator by ATK
The Ultimate Indicator By ATK
This all-in-one trading indicator integrates multiple advanced tools to provide ICT traders with deep insights into market structure, liquidity zones, Fair Value Gaps (FVG), and AI-powered signals. Whether you’re a scalper or a long-term trader, this indicator offers real-time analysis and helps identify potential trading opportunities in dynamic markets.
🔵 Key Features
🔹 2 options for checking SMT (Separation and Divergence) Detection:
First - Compares highs and lows of a primary symbol (e.g., NQ1!) with a user-defined comparison symbol (e.g., ES1!).
Automatically detects and visualizes discrepancies (red for highs, blue for lows) between the symbols.
Offers customizable comparison settings and alerts for divergence detection.
Second -
Real-time SMT comparison between two tickers - red/green lines.
🔹 Market Structure Change (MSS) & Break of Structure (BOS) Detection:
Identifies market structure shifts and breakouts, crucial for spotting potential reversals.
Customizable sensitivity and length settings to adapt to various market conditions and trading strategies. Use 3 different timeframes on the same chart.
🔹 Buy Side & Sell Side Liquidity Zones:
Highlights liquidity zones on both buy and sell sides, offering a clear view of market pressure points.
Configurable settings for detection length, margin, and alert conditions for liquidity sweeps like the 15-minute Buy Side Liquidity (BSL) and Sell Side Liquidity (SSL).
These lines from Swing Highs & Lows:
Automatically plots horizontal lines at the most recent swing highs and lows.
Lines are removed once the closing price breaches these levels, ensuring real-time updates and clean charting.
🔹 Fair Value Gap (FVG) Detection:
Detects FVG formations on 5-minute and 1-minute charts, making it ideal for scalpers capturing liquidity gaps.
Includes directional arrows and customizable alerts based on higher and lower timeframe FVG analysis, helping traders time their entry and exit points.
🔹IFVG (Inverse fair value gap) - yellow
🔹IFVG + SMT - Light blue
🔹IFVG + SMT + HTF FVG - green/red (1 min only)
🔹IFVG + SMT + BSL/SSL Swept - green/red (1 min only)
for example:
🔹 Capture and plot significant price levels at specific times throughout the trading day:
TDO (True Day Open): The price at which a market opens at 12:00 AM US.
TMSO (True Micro Session Open): The open price of the Q2 of the micro session.
RVT (Revolving True Open): The price recorded at 12:00 PM US.
AO (Asia True Open Price): The price captured at 7:30 PM US, specifically representing the opening price of the Asian session.
LO (London True Open Price): 1:30 AM US
AM (New York Session - Afternoon Market True Open Price): 7:30 AM US
PM (Post Market Open Price): 1:30 PM US.
For example TMSO:
🔹 AI-Powered Entry Detection:
The script helps identify entry points based on specific candle patterns, while also considering the exponential moving averages (EMAs) for trend confirmation.
🔶FFMS Strategy: (First Five Minute Strategy)
Check 5-min time frame if the price is between the high and low of the previous day. then, when NYO if there is retest on the High/Low on the 5-min chart after crossover or crossunder the 5 minute first candle high/low lines.
🔶PSP & PSP + FVG
🔹The Precision Swing Point (PSP). It helps you visually identify price decorrelation (type of SMT) among key futures contracts (NQ/ES or NQ/ES/YM/ZB) and set alerts for these significant market movements.
🔹The PSP HTF 15 Min + FVG LTF 1 Min
In this strategy the script is looking for PSP in HTF (15-Min) and capture the FVG in LTF (1-Min) only if its between High and Low of the PSP.
If there is a retracement in parallel micro session time, for example: Q1 with Q3 or Q2 with Q4, Q3 with Q1, etc…
if the retracement was happened and the price close above/below the high/low of the FVG from the LTF that captured according to the direction for long/short, it plots an arrow.
Update the script that checks the purple arrows and shows all of them each time there is a new PSP in a 15-minute timeframe and then FVG in 1 Min timeframe with the reference to the TDO/TMSO/Open session
for example:
Step 1: PSP 15Min LOW/HIGH Lines look for FVG by the conditions above - purple arrow
Step 2:FVG founded - purple arrow
SMT Fill on 15 min timeframe + IFVG 1 min - Detected option:
When Sym1 closed above/below FVG and Sym2 didn't it is SMT FILL (15 Min timeframe)
White arrows when captured SMT FIll + IFVG:
option to turn on alert on this strategy too.
🔹Detect liquidity swept on 15-min timeframe by $$ - green/red
🔹Detect liquidity to sweep zones on by diamonds - green/red
🔹Alerts for all Events and full scenarios.
Real-time notifications ensure traders can act quickly on potential trade setups.
🔵 Conclusion:
This Ultimate Indicator by ATK brings together critical elements of market analysis in one tool for ICT traders, offering real-time insights, alerts, and visual aids to enhance trading strategies. Whether you’re focused on short-term price action or long-term market trends, this indicator provides the tools necessary for informed decision-making and improved trading performance.
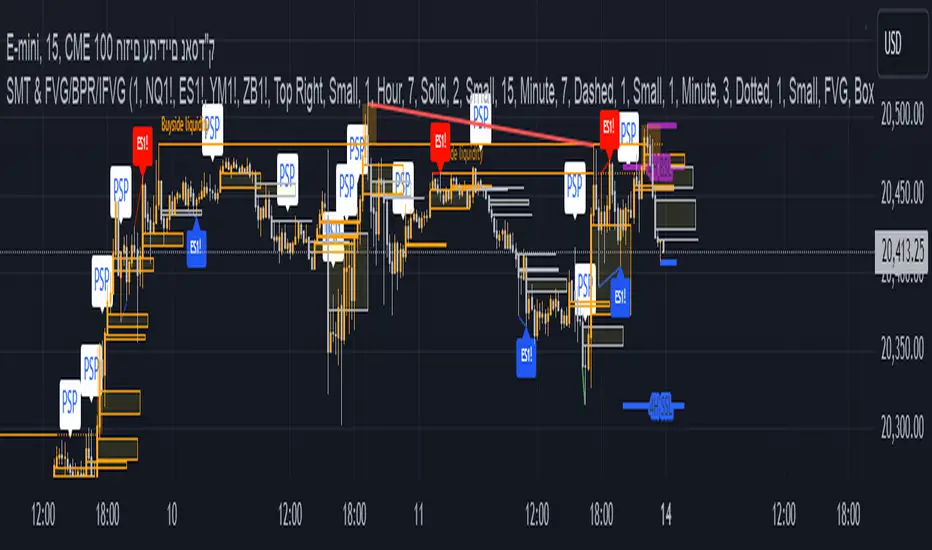
PumpC Price Action Candles & MAsPumpC – PAC & MAs (Open Source)
A complete Price Action Candles (PAC) toolkit with Fair Value Gaps, Inside Bars, Hammers, and Inverted Hammers—combined with a flexible Moving Averages (MAs) module. Draws forward-extending boxes, optionally recolors levels once price trades back through them, qualifies signals with a global High-Volume filter, and ships with ready-made alerts. Works on intraday through swing across any market (e.g., NASDAQ:QQQ , $CME:ES1!, FX:EURUSD , CRYPTO:BTCUSD ).
This is an open-source script. The description explains purpose, behavior, and configuration so traders can evaluate fit. It makes no performance claims and does not provide trade advice.
Acknowledgment & credits
This script builds upon structural and box-handling code patterns originally derived from the Super OrderBlock / FVG / BoS Tools by makuchaku & eFe . Their work established the foundation for array handling, forward-extending boxes, and mitigation recoloring. I have adapted, reorganized, and expanded this framework to integrate PAC-specific logic, Al Brooks-inspired price action interpretations, high-volume filters, and a custom multi-timeframe MA module.
What it does
Fair Value Gaps (FVG): Highlights three-bar displacement gaps with forward-extending boxes, labeled FVG+ (bullish) and FVG- (bearish). Optional mitigation recolor when price later trades back into the gap.
Inside Bars (IB): Boxes inside ranges when a bar is fully contained in the prior bar. Can require high volume to emphasize participation.
Hammers (H) & Inverted Hammers (IH): Detects candles using configurable body/upper/lower-wick thresholds. Can require high volume.
Mitigation recolor: Per-pattern option to flip a box to a mitigated color after price trades back through its vertical range.
Moving Averages (MAs): Up to four configurable lines with a global type (EMA or SMA), custom lengths, per-MA timeframe selection, per-MA color, and a clean plotting rule to avoid clutter when downshifting timeframes.
Alerts included: New FVG+, FVG-, IB, H, and IH events can trigger TradingView alerts and webhooks.
How it works
FVG: Identifies a gap between the current bar and the bar two periods back. A box spans the gap and extends forward. If mitigation recolor is enabled, the box changes to the mitigated color once price trades back inside it.
IB: A bar is “inside” when its high is at or below the previous high and its low is at or above the previous low. The box extends forward; high-volume qualification is optional.
Hammer / Inverted Hammer: Classifies candles by body size relative to total range and wick proportions. Each event becomes a forward-extending box; high-volume qualification is optional.
MAs: Choose EMA or SMA globally, set each MA’s length and (optionally) a higher timeframe source. When a higher timeframe is chosen, the line only plots when that timeframe is above the chart’s timeframe, keeping visuals honest and uncluttered.
Connection to Al Brooks’ PAC teachings
This script reflects Al Brooks’ Price Action Candles (PAC) methodology: micro-patterns like Inside Bars, Hammers, and Inverted Hammers gain meaning not in isolation, but in context of the surrounding trend, supply/demand zones, and failed breakouts. Brooks emphasizes reading effort vs. result —what participants are trying to do, and whether they succeed.
By highlighting these PACs and layering in volume confirmation, the script helps traders see which small patterns are worth paying attention to.
Why the High-Volume filter matters
Volume is a practical proxy for conviction. A pattern formed on light volume can be misleading noise; one formed on above-average volume has greater weight and aligns with Brooks’ view of price action strength.
The global high-volume filter in this script lets you:
Elevate Inside Bars that show absorption or compression with significant activity.
Distinguish Hammers that reject lower prices aggressively from those that simply drift.
Highlight Inverted Hammers where sellers dominate with conviction.
This makes PAC readings cleaner and more actionable, especially in thin sessions or small timeframes.
Inputs & customization
Inputs are grouped for fast configuration: visibility first, then colors and styling, then labels, with a shared High-Volume baseline.
High-Volume Filter (global)
High-Vol Lookback: Length for the average volume baseline.
High-Vol Multiple: A pattern only qualifies (when its toggle is on) if its volume exceeds the baseline multiplied by this factor.
Fair Value Gaps
Plot / Recolor Mitigated: Show gaps and optionally flip boxes when price trades back inside.
Colors: Separate colors for FVG+ and FVG- , plus mitigated color.
Box style & capacity: Border style, transparency, and maximum number of boxes.
Labels: Toggle label, choose label color and size.
Inside Bar (IB)
Plot / Require High Volume / Recolor Mitigated: Main controls.
Colors: IB color and mitigated color.
Box style & capacity: Border style, transparency, max boxes.
Labels: Toggle label, color, size.
Hammer (H)
Plot / Require High Volume / Recolor Mitigated: Main controls.
Colors & style: Primary and mitigated colors, border style, transparency, max boxes.
Labels: Toggle label, color, size.
Thresholds: Body-to-range maximum %, minimum lower-wick-to-range %, and maximum upper-wick-to-range %.
Inverted Hammer (IH)
Plot / Require High Volume / Recolor Mitigated: Main controls.
Colors & style: Primary and mitigated colors, border style, transparency, max boxes.
Labels: Toggle label, color, size.
Thresholds: Body-to-range maximum %, minimum upper-wick-to-range %, and maximum lower-wick-to-range %.
Moving Averages (MAs)
MA Type: EMA or SMA (global selection).
Source: Choose price source (default: close).
Per-MA settings (x4): Toggle on/off, length, optional higher-timeframe source, color.
Clean plotting rule: If a higher timeframe is selected, the line displays only when that timeframe is above the chart timeframe, preventing clutter and keeping visuals accurate.
Alerts
Five alert conditions fire when a new pattern is created on the detecting bar—ideal for notifications or webhook automation.
New Bullish FVG (+)
New Bearish FVG (-)
New Inside Bar (IB)
New Hammer (H)
New Inverted Hammer (IH)
Suggested workflow
Pick market & timeframe: Script works across equities, futures, forex, and crypto from scalping to swing.
Toggle what you trade: Enable only the patterns you act on. Assign distinct colors for clarity.
Use MAs for bias: Track trend, slope, and pullbacks. Consider sourcing one or more MAs from a higher timeframe for structural context.
Enable High-Volume gating when needed: Filter out weak PACs during low participation. Tune the lookback/multiple per market.
Monitor mitigation state: Recolored boxes immediately reveal which levels have been interacted with.
Set alerts with purpose: Only enable alerts for setups aligned with your plan, then combine with structure, timing, and risk rules.
Originality
Unified PAC engine: FVG, IB, H, and IH presented consistently as forward-extending boxes with optional mitigation.
Brooks-inspired design: Patterns are contextualized with volume and MAs, reflecting Al Brooks’ PAC methodology.
Flexible high-volume gating: Shared baseline with per-pattern toggles supports cleaner signals across markets.
MTF-aware MAs: Higher-timeframe averaging with clutter-free plotting rules.
Open-source transparency: Code is fully available for learning, modifying, or extending.
Disclaimer
For educational and informational purposes only. Not financial advice. Trading carries risk; always manage exposure and test before live use.

IFVG ExtendedThis indicator identifies and visualizes "Imbalance Fair Value Gaps" (IFVGs) on a price chart. It highlights these gaps, tracks their evolution, and signals when they are "filled" or "invalidated" by price action. The script is quite advanced, using custom types, arrays, and dynamic drawing.
1. Types and Variables
Custom Types:
lab: Stores label information (x, y, direction).
fvg: Stores Fair Value Gap data, including its boundaries, direction, state, labels, and other properties.
Arrays:
Four arrays track bullish and bearish FVGs, and their "invalidated" (filled) versions.
Signals:
Boolean variables to store if a bullish or bearish signal is triggered.
2. User Inputs and Parameters
Display Settings:
How many recent FVGs to show, signal preference (close or wick), ATR multiplier for gap size filtering, and colors for bullish/bearish/midline.
3. Chart Data
Price Data:
Open, high, low, close, and ATR (Average True Range) are stored for use in calculations.
4. Functions
label_maker:
Draws an up or down arrow label at a given point, colored for bullish or bearish.
fvg_manage:
Checks if any FVGs in the array have been "invalidated" (i.e., price has crossed their boundary). If so, moves them to the invalidated array.
inv_manage:
Manages invalidated FVGs, checking if a signal should be fired (i.e., price has reacted to the gap). Also removes old FVGs.
send_it:
Draws the FVGs and their labels on the chart, using boxes and lines for visualization.
5. Main Logic and Visualization
FVG Detection:
On each bar, checks for new bullish or bearish FVGs based on price action and ATR filter.
Adds new FVGs to the appropriate array.
FVG Management:
Updates the arrays, moves invalidated FVGs, and checks for signals.
Drawing:
On the last bar, clears all previous drawings and redraws the current FVGs and their labels.
6. Alerts
Alert Conditions:
Sets up alerts for when a bullish or bearish IFVG signal is triggered, so users can be notified.
Summary
In short:
This script automatically finds and tracks "Imbalance Fair Value Gaps" on your chart, highlights them, and alerts you when price interacts with them in a significant way. It uses advanced Pine Script features to manage and visualize these zones dynamically, helping traders spot potential reversal or continuation points based on gap theory
