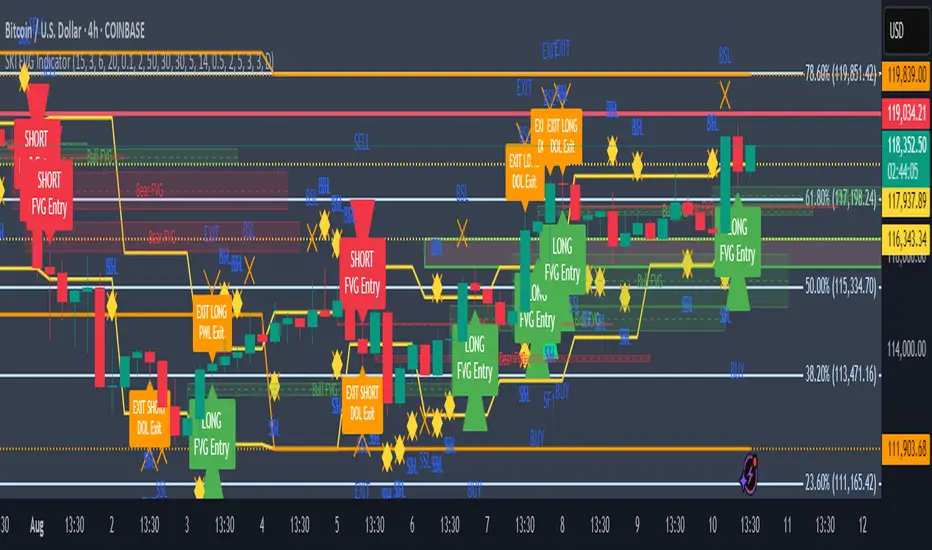
SKI FVG IndicatorIt uses ICT concepts and takes entries and exits. Identifies good FVG and shows an entry to buy or short and also exits at swing high or low , discount areas, primary areas, DOL (draw on liquidity)
在腳本中搜尋"fvg"
Order Blocks & FVG con Mitigación CRISVASPERIdentifica Bloques de ordenes y FVG, pero muestra el porcentaje de mitigaciones
Trading Path
Below indicator are combined in them.
POI
VOLUME FVG
ORDER BLOCKS
VWAP
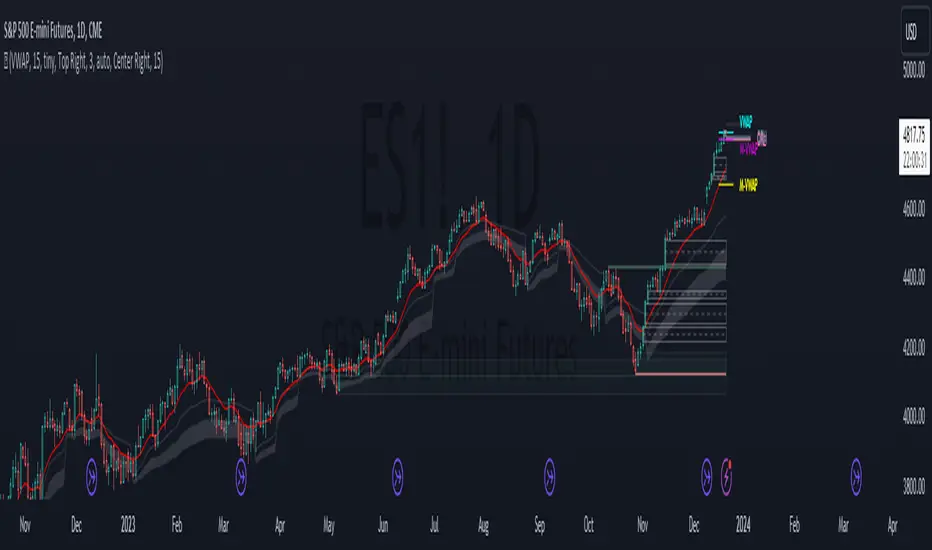
200 EMA HIGH
PIVOT
Advanced Liquidity & FVG Detector With Entry/Exit SignalsThe Advanced Liquidity & FVG Detector is more than just an indicator—it's a complete trading system that brings institutional-grade market analysis to individual traders. By combining liquidity detection, fair value gap analysis, sweep/grab pattern recognition, and intelligent risk management, this indicator provides everything needed for sophisticated market analysis and high-probability trading opportunities.
Whether you're a day trader, swing trader, or position trader, this indicator adapts to your style and timeframe, providing the insights needed to make informed trading decisions with confidence. The Pine Script v6 compatibility ensures future-proof performance and seamless integration with the latest TradingView features.
Transform your trading experience with professional-grade market structure analysis—tradable insights delivered in real-time, right on your chart.

Enhanced FVG + BOS & Liquidity Prediction with Alerts### How to use:
1. Add this script to TradingView.
2. Go to the **Alerts** tab.
3. Create new alerts:
- Choose **"Enhanced FVG + BOS & Liquidity Prediction with Alerts"**.
- Select **"Bullish Reversal Alert"** or **"Bearish Reversal Alert"**.
- Set the trigger to **"Once"** or **"Every time"** based on your preference.
### Summary:
- The alerts fire when the combined signals (BOS, Liquidity Sweep, trend, candlestick pattern) strongly suggest a reversal.
- The **labels** and **shapes** give visual confirmation on your chart.
Breakout Indicator + OB & FVG📈 Breakout Indicator + OB & FVG
This script is designed to assist with identifying potential breakout zones following periods of low volatility or price consolidation. It integrates price structure analysis with optional lunar phase filtering for enhanced visual insights.
🔍 Key Features
Consolidation Detection: Automatically identifies price ranges with low volatility over a user-defined lookback period.
Breakout Signals: Highlights potential breakout zones when price moves beyond consolidation range highs or lows.
Take-Profit & Stop-Loss Levels: Automatically calculates three TP levels and one SL level based on user-defined multipliers.
Lunar Filter (Optional): Applies a visual overlay during full moon phases as a unique experimental timing filter.
Visual Elements:
Entry/TP/SL levels shown on chart with colored lines and labels.
Consolidation zones shaded with customizable colors.
Dynamic panel with volatility metrics and last signal info.
⚙️ Inputs & Customization
Adjustable lookback period, volatility threshold, and risk multipliers.
Optional lunar phase aggression multiplier.
Full customization of zone colors, label visibility, and transparency.
📌 Disclaimer
This indicator is a visual tool for analysis and does not provide financial advice or guaranteed outcomes. Its purpose is to support discretionary decision-making, not replace it. Past signals do not guarantee future performance. Always test tools thoroughly and use appropriate risk management.
🧠 Developer Notes
Based on simple volatility and price action mechanics.
The lunar filter is symbolic and not based on real astronomical data.
No repainting or future leaks; signals are generated based on confirmed candle closes.

[T] FVG Size MarkerThis scripts marks the size of the FVG on the chart. As well as lets you place custom text based on gap size. Custom text lets you overlay contract size risk based on the gap size.

POC-Candle-EMA-ATR-LongShadow-50percCandleThis is a script for those who trade based on volume and smart money strategies.
Some of the features of this script:
- Display "Time Price Opportunity Chart". These points help traders to identify price opportunities over time and have a better analysis of the market.
- Mark candles that have traded more volume than previous candles.
- Mark candles whose body is at least and not more than 50% of the total candle size, these candles can be found more easily in smart money strategies.
- Mark spike candles to find FVG faster
- Mark candles that have a shadow of at least more than 380 points and can be good reversal points.
- EMA indicator to check the market trend
- DonchianChannel indicator to check the price trend on the chart
Regards

ICT Unicorn Breaker + FVG Alert📌 How to Use the ICT Breaker Block Indicator
The ICT Breaker Block Indicator helps you spot potential trade opportunities by setting up alerts. Here’s how to get started:
1️⃣ Draw Your Breaker Block
First, find a Bullish or Bearish Breaker Block on your chart.
Bullish Breaker Block: This forms when a bearish order block doesn't hold, and price breaks through to the upside. This indicates a shift from a bearish to a bullish market, with the previous bearish order block now acting as support.
Bearish Breaker Block: This forms when a bullish order block fails to hold, and price breaks through to the downside. This indicates a shift from a bullish to a bearish market, with the previous bullish order block now acting as resistance.
Use the drawing tool to mark the Breaker Block on your chart.
2️⃣ Set Your Entry & Stop Levels
Entry: For a bullish trade, enter at the top of the Breaker Block; for a bearish trade, enter at the bottom.
Stop Loss: Place this on the opposite side of the Breaker Block.
3️⃣ Choose Your Trade Direction
Bullish setup: Choose Buy for a bullish Breaker Block (upward break).
Bearish setup: Choose Sell for a bearish Breaker Block (downward break).
4️⃣ Create Two Alerts
You’ll need to set up the following two alerts in order:
✅ Unicorn Alert (Once Per Bar Close): Set this alert first for your selected Breaker Block (Bullish or Bearish). It triggers when price closes above the entry level (for a bullish setup) or below the entry level (for a bearish setup), and checks for bullish or bearish unmitigated Fair Value Gaps (FVGs) that overlap within the Breaker Block.
✅ Terminus Alert (Triggered Once): Once the Unicorn alert has been triggered, change the alert to a Terminus Alert. This alert is activated once the TP (terminus) is hit before the limit order fills from the Unicorn alert signal.
5️⃣ Automate with Webhook (Optional)
Want to automate your trades? Simply enter your Trader Post Webhook URL in the alert settings to send signals directly to your trading bot! 🤖

Order Block Overlapping Drawing [TradingFinder]🔵 Introduction
Technical analysis is a fundamental tool in financial markets, helping traders identify key areas on price charts to make informed trading decisions. The ICT (Inner Circle Trader) style, developed by Michael Huddleston, is one of the most advanced methods in this field.
It enables traders to precisely identify and exploit critical zones such as Order Blocks, Breaker Blocks, Fair Value Gaps (FVGs), and Inversion Fair Value Gaps (IFVGs).
To streamline and simplify the use of these key areas, a library has been developed in Pine Script, the scripting language for the TradingView platform. This library allows you to automatically detect overlapping zones between Order Blocks and other similar areas, and visually display them on your chart.
This tool is particularly useful for creating indicators like Balanced Price Range (BPR) and ICT Unicorn Model.
🔵 How to Use
This section explains how to use the Pine Script library. This library assists you in easily identifying and analyzing overlapping areas between Order Blocks and other zones, such as Breaker Blocks and Fair Value Gaps.
To add "Order Block Overlapping Drawing", you must first add the following code to your script.
import TFlab/OrderBlockOverlappingDrawing/1
🟣 Inputs
The library includes the "OBOverlappingDrawing" function, which you can use to detect and display overlapping zones. This function identifies and draws overlapping zones based on the Order Block type, trigger conditions, previous and current prices, and other relevant parameters.
🟣 Parameters
OBOverlappingDrawing(OBType , TriggerConditionOrigin, distalPrice_Pre, proximalPrice_Pre , distalPrice_Curr, proximalPrice_Curr, Index_Curr , OBValidGlobal, OBValidDis, MitigationLvL, ShowAll, Show, ColorZone) =>
OBType (string)
TriggerConditionOrigin (bool)
distalPrice_Pre (float)
proximalPrice_Pre (float)
distalPrice_Curr (float)
proximalPrice_Curr (float)
Index_Curr (int)
OBValidGlobal (bool)
OBValidDis (int)
MitigationLvL (string)
ShowAll (bool)
Show (bool)
ColorZone (color)
In this example, various parameters are defined to detect overlapping zones and draw them on the chart. Based on these settings, the overlapping areas will be automatically drawn on the chart.
OBType : All order blocks are summarized into two types: "Supply" and "Demand." You should input your Current order block type in this parameter. Enter "Demand" for drawing demand zones and "Supply" for drawing supply zones.
TriggerConditionOrigin : Input the condition under which you want the Current order block to be drawn in this parameter.
distalPrice_Pre : Generally, if each zone is formed by two lines, the farthest line from the price is termed Pervious "Distal." This input receives the price of the "Distal" line.
proximalPrice_Pre : Generally, if each zone is formed by two lines, the nearest line to the price is termed Previous "Proximal" line.
distalPrice_Curr : Generally, if each zone is formed by two lines, the farthest line from the price is termed Current "Distal." This input receives the price of the "Distal" line.
proximalPrice_Curr : Generally, if each zone is formed by two lines, the nearest line to the price is termed Current "Proximal" line.
Index_Curr : This input receives the value of the "bar_index" at the beginning of the order block. You should store the "bar_index" value at the occurrence of the condition for the Current order block to be drawn and input it here.
OBValidGlobal : This parameter is a boolean in which you can enter the condition that you want to execute to stop drawing the block order. If you do not have a special condition, you should set it to True.
OBValidDis : Order blocks continue to be drawn until a new order block is drawn or the order block is "Mitigate." You can specify how many candles after their initiation order blocks should continue. If you want no limitation, enter the number 4998.
MitigationLvL : This parameter is a string. Its inputs are one of "Proximal", "Distal" or "50 % OB" modes, which you can enter according to your needs. The "50 % OB" line is the middle line between distal and proximal.
ShowAll : This is a boolean parameter, if it is "true" the entire order of blocks will be displayed, and if it is "false" only the last block order will be displayed.
Show : You may need to manage whether to display or hide order blocks. When this input is "On", order blocks are displayed, and when it's "Off", order blocks are not displayed.
ColorZone : You can input your preferred color for drawing order blocks.
🟣 Output
Mitigation Alerts : This library allows you to leverage Mitigation Alerts to detect specific conditions that could lead to trend reversals. These alerts help you react promptly in your trades, ensuring better management of market shifts.
🔵 Conclusion
The Pine Script library provided is a powerful tool for technical analysis, especially in the ICT style. It enables you to detect overlapping zones between Order Blocks and other significant areas like Breaker Blocks and Fair Value Gaps, improving your trading strategies. By utilizing this tool, you can perform more precise analysis and manage risks effectively in your trades.

World Class SMC [WinWorld]This indicator uses valid pullbacks in order to draw market structure with strict accordance to TradingHub strategy.
Features
Our indicator uses a number of price concepts, such as:
IDM
BoS & ChoCh ( also their sweeps )
Automatic resolving of ChoCh-IDM and IDM-BoS conflicts
Orderblocks (IDM, Extreme)
True Fair Value Gaps (FVG)
True PDH/PDL
SCOB pattern
One of the core features is the ability to choose a time point, from which the market structure will be drawn. This feature alone allows you to test your most desired hypotheses about the market movements within a few clicks, so no more guesses and "what if"s, because you get the opportunity to test everything yourself and right now.
Settings
Let's review the settings themselves:
Extended Structure: allows you to choose between drawing market structure for a whole timeline or from specific time point only;
Build OB by sweeps: allows you to only draw orderblocks from candle, which took liquidity from previous candle by sweep;
Structure colours & text: allows you to customise visuals representations of market structure elements on your chart;
Structure visuals: allows you to choose which elements of market structure you want / don't want to see on your chart;
Show trend: allows you to choose the way market structure trend will be displayed on your chart: divider or background colouring ;
Alerts for each and every event , whether it is a new BoS, ChoCh, orderblock and etc.
Usage Examples
IDM Orderblock ( OB-IDM )
Basic demonstration
When price reaches OB-IDM, you will be able to receive an alert. After that, check if the candle, that reached OB-IDM, closed inside or above ( bearish scenario )/ below ( bullish scenario ) OB-IDM's boundaries. If conditions above were met, go on LTF and look for an entry.
Extreme Orderblock ( OB-EXT )
Basic demonstration
Similar to OB-IDM situation: When price reaches OB-EXT, you will be able to receive an alert. After that, check if the candle, that reached OB-EXT, closed inside or above ( bearish scenario )/ below ( bullish scenario ) OB-EXT's boundaries. If conditions above were met, go on LTF and look for an entry.
Sweep PDH/PDL
Basic demonstration
* PDH — Previous Day High
* PDL — Previous Day Low
When you received PDH sweep alert and current trend is bearish, go on LTF to find entry point. ( bullish scenario: PDL sweep and current trend is bullish )
Sweep ChoCh
Basic demonstration
If you get alert of sweeped ChoCh, it usually means that price grabbed the liquidity from extremum points and is ready to continue going with the trend. Go on LTF to find an entry.

Cuck WickAcknowledgement
This indicator is dedicated to my friend Alexandru who saved me from one of these scam cuck wicks which almost liquidated me.
Alexandru is one of the best scalpers out there and he always nails his entries at the tip of these wicks.
This inspired me to create this indicator.
What's a cuck wick?
It's that fast stop-hunting wick that cucks everyone by triggering their stop-loss and liquidation.
Liquidity is the lifeblood of stock market and liquidation is the process that moves price.
This indicator will identify when a liquidity pool is getting raided to trigger buy or sell stops, they are also know as stop-hunts.
How does it work?
When market consolidates in one direction, it builds up liquidity zones.
Market maker will break out of these consolidation phases by having dramatic price action to either pump or dump to raid these liquidity zones.
This is also called stop-hunts or liquidity raids. After that it will start reversing back to the opposite direction.
This is most noticeable by the length of the wick of a given candle in a very short amount of time and the total size of the candle.
This indicator highlights them accordingly.
Settings
Wick and Candle ratio works with default values but finetune will enhance user experience and usability.
Wick Ratio: Size of the wick compared to body of a candle.
Adjust this to higher ratio on smaller timeframe or smaller ratio on bigger timeframe to your trading style to spot a trend reversal.
Candle Ratio: The size of the candle, by default it is 0.75% of the current price.
For example, if BTC is at 20,000 then the size of the candle has to be minimum 150.
This can be fine tuned to bigger candle size on higher time frames or smaller for shorter timeframe depending on the trade type.
How to use it?
This indicator will identify when a liquidity pool is getting raided to trigger buy or sell stops, they are also know as stop-hunts. It can be used of its own for scalping but there are also a good few indicators which would most definitely help to confluence bigger timeframe trades.
Scalp
This indicator shows the most chaotic moments in price action; therefore it works best on smaller timeframes, ideally 3 or 5 minute candle.
- Wait for the market to start pumping or dumping.
- Current candle will change colour (Bullish/Bearish).
- Enter trade as soon as price starts to reverse back.
- Place the stop-loss outside of the current candle.
- Wait for the cuck wick to appear as confirmation.
Price is very chaotic during a liquidity stop-hunt raid but there is a saying:
"In the midst of chaos, there is also opportunity" - Sun-Tzu
Since this is a very high risk, high reward strategy; it is advised to practice on paper trade first.
Practice until perfection and this indicator would be the perfect bread and butter scalp confirmation.
Fair Value Gap
FVG strategy is the most accurate in conjunction with this indicator.
Normally price would reverse after consuming fair value gaps but often it's difficult to know when and where.
This indicator would identify those crucial entry points for reverse course direction of the price action.
Support and Resistance
This indicator can also be used in conjunction with support and resistance lines.
Generally the cuck will go deep below the support or spike much further up the resistance lines to liquidate positions.
Bollinger Bands
Bolling Bands strategy would be to wait until the price breaks out of the band.
Once the wick is formed, it would be an ideal entry point.
Script change
This is an open-source script and feel free to modify according to your need and to amplify your existing strategy.

ICT Implied Fair Value Gap (IFVG) [LuxAlgo]An Implied Fair Value Gap (IFVG) is a three candles imbalance formation conceptualized by ICT that is based on detecting a larger candle body & then measuring the average between the two adjacent candle shadows.
This indicator automatically detects this imbalance formation on your charts and can be extended by a user set number of bars.
The IFVG average can also be extended until a new respective IFVG is detected, serving as a support/resistance line.
Alerts for the detection of bullish/bearish IFVG's are also included in this script.
🔶 SETTINGS
Shadow Threshold %: Threshold percentage used to filter out IFVG's with low adjacent candles shadows.
IFVG Extension: Number of bars used to extend highlighted IFVG's areas.
Extend Averages: Extend IFVG's averages up to a new detected respective IFVG.
🔶 USAGE
Users of this indicator can primarily find it useful for trading imbalances just as they would for trading regular Fair Value Gaps or other imbalances, which aims to highlight a disparity between supply & demand.
For trading a bullish IFVG, users can find this imbalance as an area where price is likely to fill or act as an area of support.
In the same way, a user could trade bearish IFVGs by seeing it as a potential area to be filled or act as resistance within a downtrend.
Users can also extend the IFVG averages and use them as longer-term support/resistances levels. This can highlight the ability of detected IFVG to provide longer term significant support and resistance levels.
🔶 DETAILS
Various methods have been proposed for the detection of regular FVG's, and as such it would not be uncommon to see various methods for the implied version.
We propose the following identification rules for the algorithmic detection of IFVG's:
🔹 Bullish
Central candle body is larger than the body of the adjacent candles.
Current price low is higher than high price two bars ago.
Current candle lower shadow makes up more than p percent of its total candle range.
Candle upper shadow two bars ago makes up more than p percent of its total candle range.
The average of the current candle lower shadow is greater than the average of the candle upper shadow two bars ago.
where p is the user set threshold.
🔹 Bearish
Central candle body is larger than the body of the adjacent candles.
Current price high is higher than low price two bars ago.
Current candle upper shadow makes up more than p percent of its total candle range.
Candle lower shadow two bars ago makes up more than p percent of its total candle range.
The average of the candle lower shadow 2 bars ago is greater than the average of the current candle higher shadow.
where p is the user set threshold.
🔶 SUPPLEMENTARY MATERIAL
You can see our previously posted script that detects various imbalances as well as regular Fair Value Gaps which have very similar usability to Implied Fair Value Gaps here:

PATIThis indicator is part of our educational suite focused on teaching price structure, momentum, and mean reversion trading strategies for intraday trading. Our team has selected this set of tools and metrics, which define our trading style and serve as the foundation for our teaching, to be included in this indicator. We are displaying each component in a way we believe is helpful to their understanding which also provides a clean, comprehensive look.
This indicator is for Intraday Trading
Our Traders most commonly use this indicator on the 1,3 or 5 minute chart.
Components of this Indicator:
Multiple VWAP Levels: monthly, weekly, standard (anchored to the right of price)
Dynamically Anchored VWAP Cloud (trend tool)
13 EMA (trend tool)
Structural Orderblocks
Multi-Timeframe Fair Value Gap detection
Key Daily Price Levels (anchored to the right of price)
Customizable Opening Range (anchored to the right of price)
15 minute “Golden Zone” (shows the .5-.618 zone of the previous 15m candle)
ADR (Average Daily Range)
A4R (Average 4hr Range)
These tools are used in conjunction with the education we provide to help our users determine their optimal trade plan to utilize their edge.
Specific Functionalities and Uses:
Monthly-VWAP & Weekly-VWAP (M-VWAP/W-VWAP):
VWAP = “Volume Weighted Average Price”
These levels provide probable zones where price may mean revert and risk should be taken off/ put on. We have anchored these to the right-hand side of your chart by default to minimize the noise on your chart.
Average Daily Range (ADR): The Average Daily Range is a technical indicator used to measure the volatility of an asset. It displays how much an instrument can move on average during a given day. The significance is that each market has a unique range that is likely to be covered on any given day.
Average 4hr Range (A4R): The Average 4hr Range is a technical indicator used to measure the volatility of an asset twice in a single session. It displays how much an instrument can move on average during a session and is measured twice in a day. Calculating a smaller volatility range may seem strange at first but can be a huge advantage by analyzing the volatility of the intraday action, giving you average price targets based on more recent market data.
Tip: When used in conjunction with key support and resistance levels, ADR & A4R can be a huge edge to traders to determine where to push/pull risk.
Opening Range: The open often establishes the trend and sentiment for the day, but there is also statistical significance to the open that is overlooked. Statistically, on average, the open is near the high or low of the day and offers plenty of opportunities to build trading strategies. The chart below provides some potential trades that could be taken once the opening range has been established.
Dynamically Anchored VWAP Cloud: Our dynamically anchored VWAP cloud tracks the most recent impulsive move and re-anchors to show you potential bounce points in a trend. We re-anchor at each structural shift to give the most probable targets for buyers/sellers to defend their positions to continue the current trend push.
By utilizing the re-anchoring at each significant structural inflection point, we can establish a much less lagging trend following technique.
We have also included the feature to substitute this cloud for a 34/55 EMA cloud for the traders already familiar with that system.
The chart below provides potential trades that could be taken using the VWAP cloud system.
FVGS (Fair Value Gaps/ Imbalances): These areas represent potential buy/sell side liquidity imbalances where price is pushed aggressively, sweeping the orderbook and will likely return to “fix” the structure before continuing. Below is an example of 3 possible trade paths we look for inside these structural imbalances.
Structural Orderblocks:
These areas are based on structural pivots that have been pushed out of with aggression determined by subsequent structural breaks to confirm their validity. Because of this, when price returns to these areas we can anticipate this area to be defended.
The blue boxes track Orderblocks. These highlight instances of past participation which create areas likely to be defended again when retested.
Swing High/Low/Previous:
We use swing high and lows as points of short-term support and resistance, a break of these levels can signify a shift in market sentiment.
-The dashed green line shows the previous structural swing high or low pivot point.
-The solid green lines show the high and low in our current trading structure.
Note: Displaying the previous swing can provide us with context of the current market trend, and will assist us make better decisions.
15 Minute Golden Zone:
Displayed as a gray box, it tracks the .5-.618 of the previous 15m candle and gives us an area where we look for short-term resistance/support on smaller time frame price action. This area can be viewed as an equilibrium of the current range. If the price can hold this area, it can show a likely support area for continuation.
13 EMA:
This is the choice length ema of our traders, they use this ema to confirm (short-term) trend direction and reference it for a common bounce point for re-entries. Our traders consider this as a crucial point to speculate reversals and break of short-term trends.
Note: Typically in a trend we see the price hold to one side of this ema, by looking for this characteristic, it brings confidence to staying in trades.
Please check the Author Instructions Below for how to gain access to our indicators.
Gaps + Imbalances + Wicks (MTF) - By LeviathanThis script will identify and draw price gaps, wicks and imbalances with customizable fill conditions, multi-timeframe function, zone size filtering, volume comparison, lookback filtering, as well as highly customizable appearance and settings.
I’ve made this indicator to combine the three similar but different elements that occur in price movements and serve as significant zones of interest or way of PA interpretation in various different strategies.
Imbalances (or Fair Value Gap/FVG/Inefficiency/whatever)
- The Imbalance “pattern” consists of 3 candles (1- candle before the sharp move, 2 - sharp move candle and 3- candle after the sharp move). When price makes a move downwards, the imbalance zone is defined as the area between the low of 1 and the high of 3 When price makes a move upwards, the imbalance zone is defined as the area between the high of 1 and the low of 3.
Gaps
A price gap is an area on a chart where no trading activity has taken place. A gap up means that the low of the current candle is higher than the high of the previous candle and a gap down means that the high of the current candle is lower than the low of the previous candle.
Wicks (or shadows/tails/whatever)
Wicks are used to indicate where the price has fluctuated relative to the opening and closing price of the candle. An upper wick is the zone between candle high and candle close/open (whichever is higher) and a lower wick is the zone between candle’s low and candle’s close/open (whichever is lower).
Settings Overview
“Zone Type” - This input lets you decide which zones should the script plot and on which timeframe. You should always pick a timeframe higher than your chat’s.
“Middle Line, Top Line, Bottom Line” - Show or hide the Middle Line (horizontal level in the middle of each zone), Show or hide Top Line (horizontal level at the top of the zone), Show or hide Bottom Line (horizontal level at the bottom of the zone)
“UP/DOWN Zones" - This input lets you show/hide UP Zones or DOWN Zones an pick their color, border color and label color.
”Fill Condition” - If turned ON, the zones will end drawing when your prefered Fill Condition is met (Full Filll = price mitigates the whole zone, Half Fill = zone is at least halfway mitigated and Touch = zone is touched by price). If turned OFF, the zones will only be plotted for the amount of bars defined it “Zone Length”.
”Lookback (D)” - This input lets you limit the amount of zones plotted on the chart by choosing how many days back in time should the script go to find and plot zones. For example, input 1 will only show you the zones of the past day, input 7 will only show you the zones of the past week.
”Hide Filled Zones” - If turned ON, the zones that have been filled will be removed from the chart.
”Show Boxes” - Show or hide the boxes that represent the zones. This is useful for those who want the zones to be visualized by just lines.
“Filter Type” - this input lets you create a filter that will make the script only show zones that are larger than ATR or larger than a certain percentage. You can choose the ATR Length and the multiplier (higher multiplier → larger zone required), as well as the Percentage (%) and its multiplier (higher percentage → larger zone required). If you choose “None”, the zones of all sizes will be plotted.
”Zone Labels” - this part of the settings lets you: show/hide labels, decide on the size of the labels and their positions, choose a custom name for each zone, choose the data that the labels present (Type of the zone/Timeframe/ Volume ).
”Other settings” - ‘Stop/Delete zone after X number of candles’ will force stop/delete the zone if it’s plotted for more than prefered number of bars. ‘Line Style’ lets you choose the style and the color of the lines, ‘Zone Length’ defines the length of the zone if Fill Condition is “None”.
More settings, modifications and improvements coming in future updates. This script is a bit old so I will clean up and optimize the code once I have more time.

Liquidity Hunter - FattyTradesThis indicator is used to automatically identify and plot two forms of liquidity that will be targeted by market makers.
The first form of liquidity is based on multi-time fame highs and lows. It plots 1H, 4H, D, W, & M liquidity on an intraday chart to make it easier to identify. I believe hat liquidity is what drives the market and the most common form of this liquidity can be identified through higher time frame highs and lows. You can use whatever method you prefer to determine which liquidity pool will be targeted. When the liquidity is purged, it will be shown as dotted lines. This should not be used as traditional support/resistance, but rather as targets for the market.
The second form of liquidity is in the form of imbalances or fair value gaps. You can select a higher time frame to be plotted along with the current time frame you're viewing to identify imbalances that will likely be targeted intraday. We know that higher time frame fair value gaps work equally well as targets for market makers. When a higher time frame FVG is broken into, it can also act as a very powerful form of support and resistance. By default, when a fair value gap has been mitigated it will be removed from the chart, however this can be disabled.
Between these two forms of market maker liquidity targets on the chart, it will be easier to formulate a thesis intraday to determine where the market will move. It can help minimize the amount of switching between higher time frames that needs to be done, allowing you to identify targets while trading on your favorite intraday time frame for optimal risk/reward.
In the near future, I will build in alerting mechanism to alert when liquidity on higher time frames as been purged/mitigated.

Sonarlab - Double Fair Value Gap (DFVG)The Double Fair Value Gap will give great zones where price in the future can react off. The script is Multi Timeframe. Of course the name says it already, the script basically searches for area's where a FVG gets rebalanced with another Fair Value Gap - a double fair value gap. Amazing for searching strong buying and selling pressure in the markets.
You can see below for example that price creates a Double Fair Value Gap and comes back to fill it.
You can customize the script how you like it, with the following settings and inputs:
Show double fair value gap
DFVG Lookback: {value}
Display Limit {value}
Colors: Bullish and Bearish DFVG
Extension
Extend to {recent or max}
Custom extension: {value}
Mitigation
Mitigated: {remove or stop}
Mitigation level {value %}
Customize Box Text
Premium Zone
Midline
Show midline
Styling settings
Alerts]
Bullish Alert
Bearish Alert

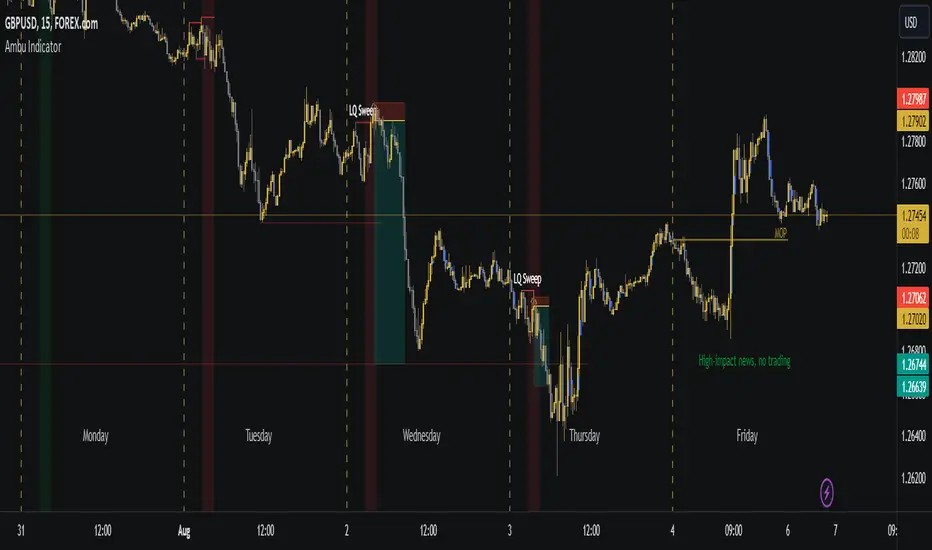
Ambu IndicatorAids in analysis and trading with ICT models by automatically plotting concepts taught by Michael J. Huddleston, the Inner Circle Trader.
Mainly tailored around my specific trading needs, I just decided to share because it might help other people too.
What's Plotted and Included in the Indicator:
1. FVGs
2. ICT Sessions - Since this indicator is tailored specific to my trading needs, I disabled LCKZ, NYCKZ, IPDA TD, etc.
Asian Killzone - 1900-0000 EST
London Open Killzone - 0200-0500 EST
NY Open Killzone - 0700-1000 EST
Central Bank Dealer's Range - 1600-2000 EST
3. Seasonal Tendencies - The background color of the Killzones reflect the seasonal tendency of the specific pair. Currently, the only pairs supported are DXY, GBPUSD, EURUSD, and NAS100. More pairs being supported is planned for the future.
4. Midnight Opening Price - 0000 EST
To Do:
1. Pairs to add seasonal tendencies for (in-order)
SP500
US30
AUDUSD
USDCAD
XAUUSD
2. Weekly Opening Price
3. For indices, the 0830 (EST) IPDA shift opening price
4. PWH/PWL?
5. PMH/PML?
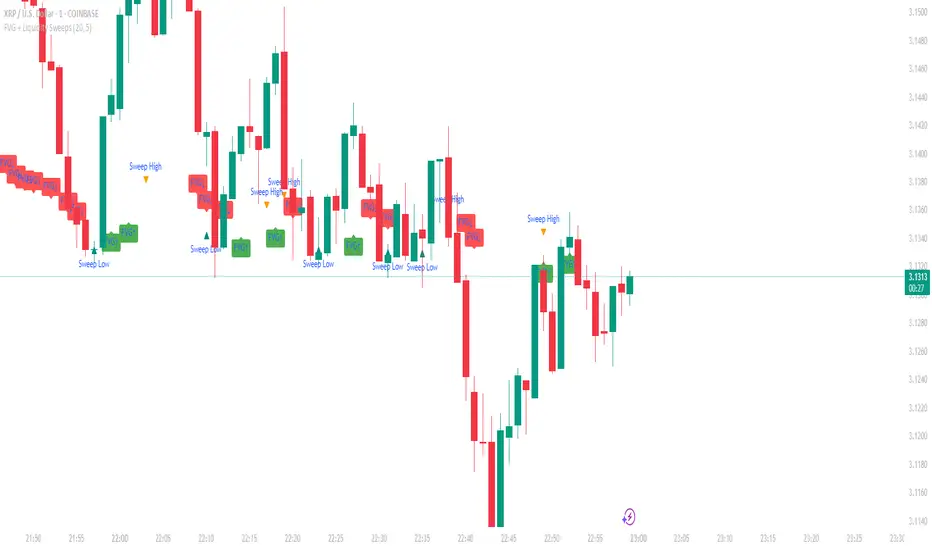
FVG + Liquidity Sweepsthis is a test and i don't know if it is gonna actually work but let me know if it does.
FVG + IFVG Gap (ULTRA) by Aditya NejeThis Indicator shows Fair Value Gap and Inverse Fair Value gaps

FVG Finder (MONEYTALLKERS)An indicator for determining Imbalance in the market structure. It will help you identify important areas where market algorithms have failed.

FvgObject█ OVERVIEW
This library provides a suite of methods designed to manage the visual representation and lifecycle of Fair Value Gap (FVG) objects on a Pine Script™ chart. It extends the `fvgObject` User-Defined Type (UDT) by attaching object-oriented functionalities for drawing, updating, and deleting FVG-related graphical elements. The primary goal is to encapsulate complex drawing logic, making the main indicator script cleaner and more focused on FVG detection and state management.
█ CONCEPTS
This library is built around the idea of treating each Fair Value Gap as an "object" with its own visual lifecycle on the chart. This is achieved by defining methods that operate directly on instances of the `fvgObject` UDT.
Object-Oriented Approach for FVGs
Pine Script™ v6 introduced the ability to define methods for User-Defined Types (UDTs). This library leverages this feature by attaching specific drawing and state management functions (methods) directly to the `fvgObject` type. This means that instead of calling global functions with an FVG object as a parameter, you call methods *on* the FVG object itself (e.g., `myFvg.updateDrawings(...)`). This approach promotes better code organization and a more intuitive way to interact with FVG data.
FVG Visual Lifecycle Management
The core purpose of this library is to manage the complete visual journey of an FVG on the chart. This lifecycle includes:
Initial Drawing: Creating the first visual representation of a newly detected FVG, including its main box and optionally its midline and labels.
State Updates & Partial Fills: Modifying the FVG's appearance as it gets partially filled by price. This involves drawing a "mitigated" portion of the box and adjusting the `currentTop` or `currentBottom` of the remaining FVG.
Full Mitigation & Tested State: Handling how an FVG is displayed once fully mitigated. Depending on user settings, it might be hidden, or its box might change color/style to indicate it has been "tested." Mitigation lines can also be managed (kept or deleted).
Midline Interaction: Visually tracking if the price has touched the FVG's 50% equilibrium level (midline).
Visibility Control: Dynamically showing or hiding FVG drawings based on various criteria, such as user settings (e.g., hide mitigated FVGs, timeframe-specific visibility) or external filters (e.g., proximity to current price).
Deletion: Cleaning up all drawing objects associated with an FVG when it's no longer needed or when settings dictate its removal.
Centralized Drawing Logic
By encapsulating all drawing-related operations within the methods of this library, the main indicator script is significantly simplified. The main script can focus on detecting FVGs and managing their state (e.g., in arrays), while delegating the complex task of rendering and updating them on the chart to the methods herein.
Interaction with `fvgObject` and `drawSettings` UDTs
All methods within this library operate on an instance of the `fvgObject` UDT. This `fvgObject` holds not only the FVG's price/time data and state (like `isMitigated`, `currentTop`) but also the IDs of its associated drawing elements (e.g., `boxId`, `midLineId`).
The appearance of these drawings (colors, styles, visibility, etc.) is dictated by a `drawSettings` UDT instance, which is passed as a parameter to most drawing-related methods. This `drawSettings` object is typically populated from user inputs in the main script, allowing for extensive customization.
Stateful Drawing Object Management
The library's methods manage Pine Script™ drawing objects (boxes, lines, labels) by storing their IDs within the `fvgObject` itself (e.g., `fvgObject.boxId`, `fvgObject.mitigatedBoxId`, etc.). Methods like `draw()` create these objects and store their IDs, while methods like `updateDrawings()` modify them, and `deleteDrawings()` removes them using these stored IDs.
Drawing Optimization
The `updateDrawings()` method, which is the most comprehensive drawing management function, incorporates optimization logic. It uses `prev_*` fields within the `fvgObject` (e.g., `prevIsMitigated`, `prevCurrentTop`) to store the FVG's state from the previous bar. By comparing the current state with the previous state, and also considering changes in visibility or relevant drawing settings, it can avoid redundant and performance-intensive drawing operations if nothing visually significant has changed for that FVG.
█ METHOD USAGE AND WORKFLOW
The methods in this library are designed to be called in a logical sequence as an FVG progresses through its lifecycle. A crucial prerequisite for all visual methods in this library is a properly populated `drawSettings` UDT instance, which dictates every aspect of an FVG's appearance, from colors and styles to visibility and labels. This `settings` object must be carefully prepared in the main indicator script, typically based on user inputs, before being passed to these methods.
Here’s a typical workflow within a main indicator script:
1. FVG Instance Creation (External to this library)
An `fvgObject` instance is typically created by functions in another library (e.g., `FvgCalculations`) when a new FVG pattern is identified. This object will have its core properties (top, bottom, startTime, isBullish, tfType) initialized.
2. Initial Drawing (`draw` method)
Once a new `fvgObject` is created and its initial visibility is determined:
Call the `myFvg.draw(settings)` method on the new FVG object.
`settings` is an instance of the `drawSettings` UDT, containing all relevant visual configurations.
This method draws the primary FVG box, its midline (if enabled in `settings`), and any initial labels. It also initializes the `currentTop` and `currentBottom` fields of the `fvgObject` if they are `na`, and stores the IDs of the created drawing objects within the `fvgObject`.
3. Per-Bar State Updates & Interaction Checks
On each subsequent bar, for every active `fvgObject`:
Interaction Check (External Logic): It's common to first use logic (e.g., from `FvgCalculations`' `fvgInteractionCheck` function) to determine if the current bar's price interacts with the FVG.
State Field Updates (External Logic): Before calling the `FvgObjectLib` methods below, ensure that your `fvgObject`'s state fields (such as `isMitigated`, `currentTop`, `currentBottom`, `isMidlineTouched`) are updated using the current bar's price data and relevant functions from other libraries (e.g., `FvgCalculations`' `checkMitigation`, `checkPartialMitigation`, etc.). This library's methods render the FVG based on these pre-updated state fields.
If interaction occurs and the FVG is not yet fully mitigated:
Full Mitigation Update (`updateMitigation` method): Call `myFvg.updateMitigation(high, low)`. This method updates `myFvg.isMitigated` and `myFvg.mitigationTime` if full mitigation occurs, based on the interaction determined by external logic.
Partial Fill Update (`updatePartialFill` method): If not fully mitigated, call `myFvg.updatePartialFill(high, low, settings)`. This method updates `myFvg.currentTop` or `myFvg.currentBottom` and adjusts drawings to show the filled portion, again based on prior interaction checks and fill level calculations.
Midline Touch Check (`checkMidlineTouch` method): Call `myFvg.checkMidlineTouch(high, low)`. This method updates `myFvg.isMidlineTouched` if the price touches the FVG's 50% level.
4. Comprehensive Visual Update (`updateDrawings` method)
After the FVG's state fields have been potentially updated by external logic and the methods in step 3:
Call `myFvg.updateDrawings(isVisibleNow, settings)` on each FVG object.
`isVisibleNow` is a boolean indicating if the FVG should currently be visible.
`settings` is the `drawSettings` UDT instance.
This method synchronizes the FVG's visual appearance with its current state and settings, managing all drawing elements (boxes, lines, labels), their styles, and visibility. It efficiently skips redundant drawing operations if the FVG's state or visibility has not changed, thanks to its internal optimization using `prev_*` fields, which are also updated by this method.
5. Deleting Drawings (`deleteDrawings` method)
When an FVG object is no longer tracked:
Call `myFvg.deleteDrawings(deleteTestedToo)`.
This method removes all drawing objects associated with that `fvgObject`.
This workflow ensures that FVG visuals are accurately maintained throughout their existence on the chart.
█ NOTES
Dependencies: This library relies on `FvgTypes` for `fvgObject` and `drawSettings` definitions, and its methods (`updateMitigation`, `updatePartialFill`) internally call functions from `FvgCalculations`.
Drawing Object Management: Be mindful of TradingView's limits on drawing objects per script. The main script should manage the number of active FVG objects.
Performance and `updateDrawings()`: The `updateDrawings()` method is comprehensive. Its internal optimization (checking `hasStateChanged` based on `prev_*` fields) is crucial for performance. Call it judiciously.
Role of `settings.currentTime`: The `currentTime` field in `drawSettings` is key for positioning time-dependent elements like labels and the right edge of non-extended drawings.
Mutability of `fvgObject` Instances: Methods in this library directly modify the `fvgObject` instance they are called upon (e.g., its state fields and drawing IDs).
Drawing ID Checks: Methods generally check if drawing IDs are `na` before acting on them, preventing runtime errors.
█ EXPORTED FUNCTIONS
method draw(this, settings)
Draws the initial visual representation of the FVG object on the chart. This includes the main FVG box, its midline (if enabled), and a label
(if enabled for the specific timeframe). This method is typically invoked
immediately after an FVG is first detected and its initial properties are set. It uses drawing settings to customize the appearance based on the FVG's timeframe type.
Namespace types: types.fvgObject
Parameters:
this (fvgObject type from no1x/FvgTypes/1) : The FVG object instance to be drawn. Core properties (top, bottom,
startTime, isBullish, tfType) should be pre-initialized. This method will
initialize boxId, midLineId, boxLabelId (if applicable), and
currentTop/currentBottom (if currently na) on this object.
settings (drawSettings type from no1x/FvgTypes/1) : A drawSettings object providing all visual parameters. Reads display settings (colors, styles, visibility for boxes, midlines, labels,
box extension) relevant to this.tfType. settings.currentTime is used for
positioning labels and the right boundary of non-extended boxes.
method updateMitigation(this, highVal, lowVal)
Checks if the FVG has been fully mitigated by the current bar's price action.
Namespace types: types.fvgObject
Parameters:
this (fvgObject type from no1x/FvgTypes/1) : The FVG object instance. Reads this.isMitigated, this.isVisible,
this.isBullish, this.top, this.bottom. Updates this.isMitigated and
this.mitigationTime if full mitigation occurs.
highVal (float) : The high price of the current bar, used for mitigation check.
lowVal (float) : The low price of the current bar, used for mitigation check.
method updatePartialFill(this, highVal, lowVal, settings)
Checks for and processes partial fills of the FVG.
Namespace types: types.fvgObject
Parameters:
this (fvgObject type from no1x/FvgTypes/1) : The FVG object instance. Reads this.isMitigated, this.isVisible,
this.isBullish, this.currentTop, this.currentBottom, original this.top/this.bottom,
this.startTime, this.tfType, this.isLV. Updates this.currentTop or
this.currentBottom, creates/updates this.mitigatedBoxId, and may update this.boxId's
top/bottom to reflect the filled portion.
highVal (float) : The high price of the current bar, used for partial fill check.
lowVal (float) : The low price of the current bar, used for partial fill check.
settings (drawSettings type from no1x/FvgTypes/1) : The drawing settings. Reads timeframe-specific colors for mitigated
boxes (e.g., settings.mitigatedBullBoxColor, settings.mitigatedLvBullColor),
box extension settings (settings.shouldExtendBoxes, settings.shouldExtendMtfBoxes, etc.),
and settings.currentTime to style and position the mitigatedBoxId and potentially adjust the main boxId.
method checkMidlineTouch(this, highVal, lowVal)
Checks if the FVG's midline (50% level or Equilibrium) has been touched.
Namespace types: types.fvgObject
Parameters:
this (fvgObject type from no1x/FvgTypes/1) : The FVG object instance. Reads this.midLineId, this.isMidlineTouched,
this.top, this.bottom. Updates this.isMidlineTouched if a touch occurs.
highVal (float) : The high price of the current bar, used for midline touch check.
lowVal (float) : The low price of the current bar, used for midline touch check.
method deleteDrawings(this, deleteTestedToo)
Deletes all visual drawing objects associated with this FVG object.
Namespace types: types.fvgObject
Parameters:
this (fvgObject type from no1x/FvgTypes/1) : The FVG object instance. Deletes drawings referenced by boxId,
mitigatedBoxId, midLineId, mitLineId, boxLabelId, mitLineLabelId,
and potentially testedBoxId, keptMitLineId. Sets these ID fields to na.
deleteTestedToo (simple bool) : If true, also deletes drawings for "tested" FVGs
(i.e., testedBoxId and keptMitLineId).
method updateDrawings(this, isVisibleNow, settings)
Manages the comprehensive update of all visual elements of an FVG object
based on its current state (e.g., active, mitigated, partially filled) and visibility. It handles the drawing, updating, or deletion of FVG boxes (main and mitigated part),
midlines, mitigation lines, and their associated labels. Visibility is determined by the isVisibleNow parameter and relevant settings
(like settings.shouldHideMitigated or timeframe-specific show flags). This method is central to the FVG's visual lifecycle and includes optimization
to avoid redundant drawing operations if the FVG's relevant state or appearance
settings have not changed since the last bar. It also updates the FVG object's internal prev_* state fields for future optimization checks.
Namespace types: types.fvgObject
Parameters:
this (fvgObject type from no1x/FvgTypes/1) : The FVG object instance to update. Reads most state fields (e.g.,
isMitigated, currentTop, tfType, etc.) and updates all drawing ID fields
(boxId, midLineId, etc.), this.isVisible, and all this.prev_* state fields.
isVisibleNow (bool) : A flag indicating whether the FVG should be currently visible. Typically determined by external logic (e.g., visual range filter). Affects
whether active FVG drawings are created/updated or deleted by this method.
settings (drawSettings type from no1x/FvgTypes/1) : A fully populated drawSettings object. This method extensively
reads its fields (colors, styles, visibility toggles, timeframe strings, etc.)
to render FVG components according to this.tfType and current state. settings.currentTime is critical for positioning elements like labels and extending drawings.
